. 2025 Apr 8:12:1545577.
doi: 10.3389/fvets.2025.1545577. eCollection 2025.

Investigating the interplay of stressors and health in horses through fecal cortisol metabolite analysis

Affiliations

Investigating the interplay of stressors and health in horses through fecal cortisol metabolite analysis

Aurelia C Nowak et al. Front Vet Sci. .

Abstract

Introduction: Horses are highly sensitive to stress, which can affect their wellbeing and lead to various health issues. Effective and objective stress assessment is therefore crucial for improving their care and management. The production of the glucocorticoid cortisol is increased in response to stressful stimuli and its metabolites can be measured non-invasively in feces. Therefore, this study aimed to explore the impact of different environmental and physiological stressors on fecal cortisol metabolite (FCM) concentrations in horses, with a particular focus on the relationship between stress, health, and welfare. We hypothesized that increased FCM levels may be indicative of disease and thus improve early detection and subsequent intervention.

Methods: Fresh fecal samples of N = 41 horses (20 geldings and 21 mares) from the same herd were collected once weekly for 1 year. Horses had been housed in the same stable for at least a month and were accustomed to the habitat, daily routine, and social groups. Environmental conditions, health data, and potentially stressful events were recorded. Fecal concentrations of 11,17-dioxoandrostanes were measured via 11-oxoetiocholanolone enzyme immunoassay.

Results: We showed stable baseline FCM concentrations of 6.3 ng/g feces (range 0.6-28.1 ng/g feces). During the summer months, median FCM concentrations increased significantly (p < 0.05; One Way RM ANOVA), and this increase correlated with higher ambient temperatures (p < 0.0001, adj r 2 = 0.669, Pearson Product Moment correlation). Additionally, other factors such as breed, coat color, and housing conditions influenced the FCM concentrations. Stressful events, such as riding exams and some painful conditions, also resulted in elevated FCM levels, although the magnitude of these responses varied across individual horses. However, not all diseases were associated with increased FCMs.

Discussion: Our findings emphasize the complexity of the hypothalamic-pituitary-adrenal axis in horses, suggesting that while high FCM levels can indicate stress, they may not be reliable biomarkers for early disease detection. Particularly in the light of climate change, the impact of heat stress in the summer months should not be neglected and measures to improve the housing conditions accordingly should become an essential part of equine health management.

Keywords: disease; glucocorticoids; heat; horse/equine; pain; stress.


Conflict of interest statement

The authors declare that the research was conducted in the absence of any commercial or financial relationships that could be construed as a potential conflict of interest.

Figures

Figure 1
Figure 1
(A) Individual FCM values for all horses at all time points sampled. Dots of the same color represent FCM values of one horse for each week over the period of 1 year. (B) Median FCM values of all horses for each month. Boxplots show median (line within the box) ± interquartile range (shown by the box) and minimum and maximum values (whiskers), dots represent the median FCM concentrations for each horse in the respective month. Different letters indicate a statistically significant difference between the months (N = 41, One Way RM ANOVA, p < 0.05).
Figure 2
Figure 2
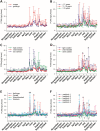
Median (±95% CI) FCM concentrations of horses divided into groups comparing (A) sex (N = 20 geldings, N = 21 mares), (B) age (N = 8 < 10 years, N = 19 11–15 years, N = 14 > 16 years), (C) rank (N = 10 high ranked, N = 26 middle, N = 5 low ranked horses), (D) coat color (N = 7 light, N = 12 intermediate, N = 23 dark coated horses) and (E) breed (N = 8 Haflingers, N = 6 Ponies, N = 18 warm-blooded horses, N = 6 Western horses), (F) paddock groups (paddock 1: N = 7, paddock 2: N = 8, paddock 3: N = 6, paddock 4: N = 7, paddock 5: N = 8). There were significant interactions between sampling timepoints and groups regarding paddock groups, coat color and breed (p < 0.05; Two-Way RM ANOVA), but not for any of the other factors. Asterisks indicate significantly higher values in paddock groups 2 and 5, rhombs indicate significantly lower values in paddock group 3 in comparison to other groups.
Figure 3
Figure 3
Sigmoidal correlation between mean ambient temperature and median FCM concentrations (Pearson Product Moment Correlation, adjr2= 0.669, p < 0.0001).
Figure 4
Figure 4
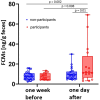
Median FCM concentrations of horses participating in a riding exam were higher than baseline values measured 1 week before (N = 16; red boxes) as well as compared with non-participating herd mates (N = 25; blue boxes) (One-Way ANOVA). Boxplots show median (line within the box) ± interquartile range (shown by the box) and minimum and maximum values (whiskers). Dots represent the FCM concentrations for each horse at the respective timepoint.
Figure 5
Figure 5
Comparison of FCM values in (A) diseased horses (N = 18) before (blue boxes), during (red boxes), and after (green boxes) the reported disease resulting in significantly increased values during the time of disease (One Way RM ANOVA), as well as (B) distinguishing the etiology of the disease showing that traumatic injuries (N = 6) significantly increased FCM concentrations, whereas orthopedic (N = 6) and gastrointestinal disease (N = 6) did not (Two Way RM ANOVA; **p < 0.01). Boxplots show median (line within the box) ± interquartile range (shown by the box) and minimum and maximum values (whiskers), dots represent the median FCM concentrations for each horse at the respective timepoint.

Similar articles

Cited by

References

    1. Scheidegger MD, Gerber V, Bruckmaier RM, van der Kolk JH, Burger D, Ramseyer A. Increased adrenocortical response to adrenocorticotropic hormone (ACTH) in sport horses with equine glandular gastric disease (EGGD). Vet J. (2017) 228:7–12. 10.1016/j.tvjl.2017.09.002 - DOI - PubMed
    1. Sykes BW, Hewetson M, Hepburn RJ, Luthersson N, Tamzali Y. European college of equine internal medicine consensus statement—equine gastric ulcer syndrome in adult horses. J Vet Intern Med. (2015) 29:1288–99. 10.1111/jvim.13578 - DOI - PMC - PubMed
    1. Leal BB, Alves GE, Douglas RH, Bringel B, Young RJ, Haddad JPA, et al. . Cortisol circadian rhythm ratio: a simple method to detect stressed horses at higher risk of colic? J Equine Vet Sci. (2011) 31:188–90. 10.1016/j.jevs.2011.02.005 - DOI
    1. Keadle TL, Pourciau SS, Melrose PA, Kammerling SG, Horohov DW. Acute exercises stress modulates immune function in unfit horses. J Equine Vet Sci. (1993) 13:226–31. 10.1016/S0737-0806(06)81019-1 - DOI
    1. Mormède P, Andanson S, Aupérin B, Beerda B, Guémené D, Malmkvist J et al. Exploration of the hypothalamic–pituitary–adrenal function as a tool to evaluate animal welfare. Physiol Behav. (2007) 92:317–39. 10.1016/j.physbeh.2006.12.003 - DOI - PubMed

LinkOut - more resources