

Unaltered maximal power and submaximal performance correlates with an oxidative vastus lateralis proteome phenotype during tapering in male cyclists
- PMID: 40265526
- PMCID: PMC12015642
- DOI: 10.14814/phy2.70302
Unaltered maximal power and submaximal performance correlates with an oxidative vastus lateralis proteome phenotype during tapering in male cyclists
Abstract
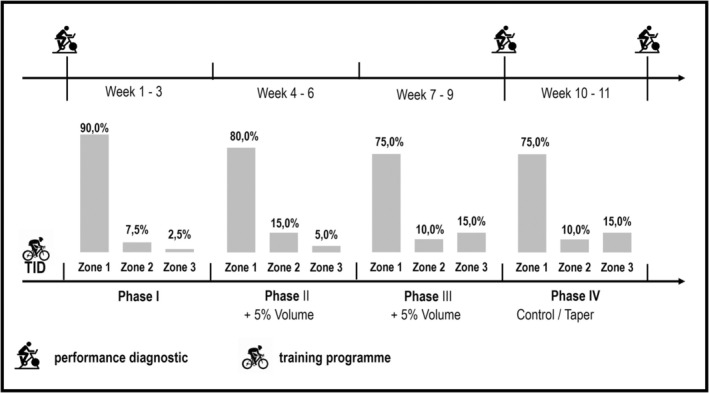
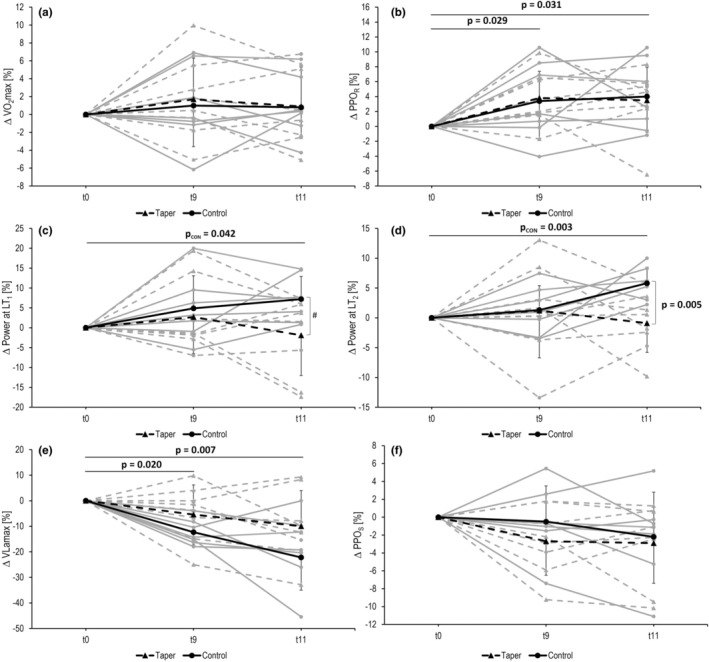
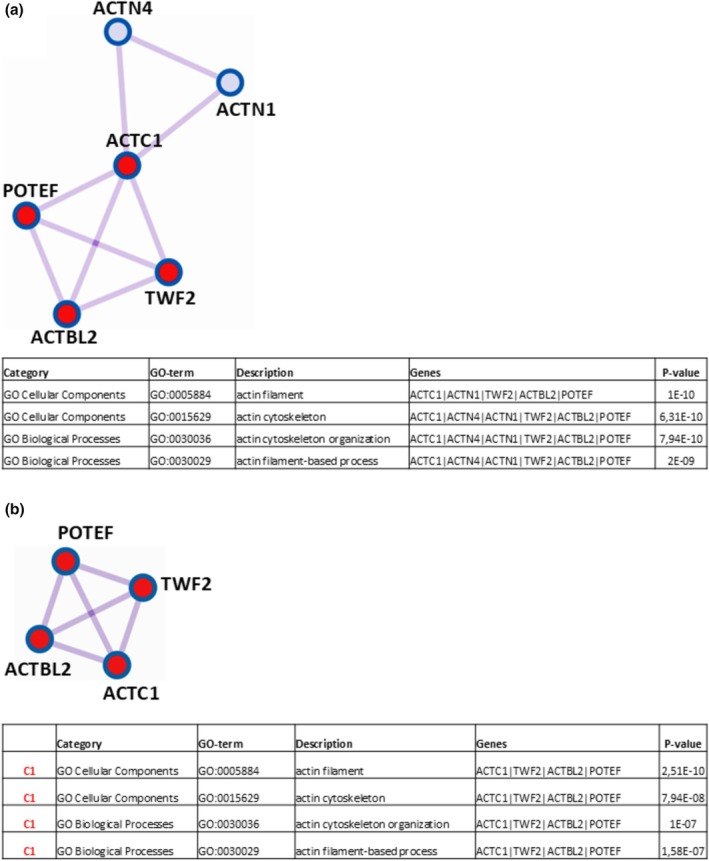
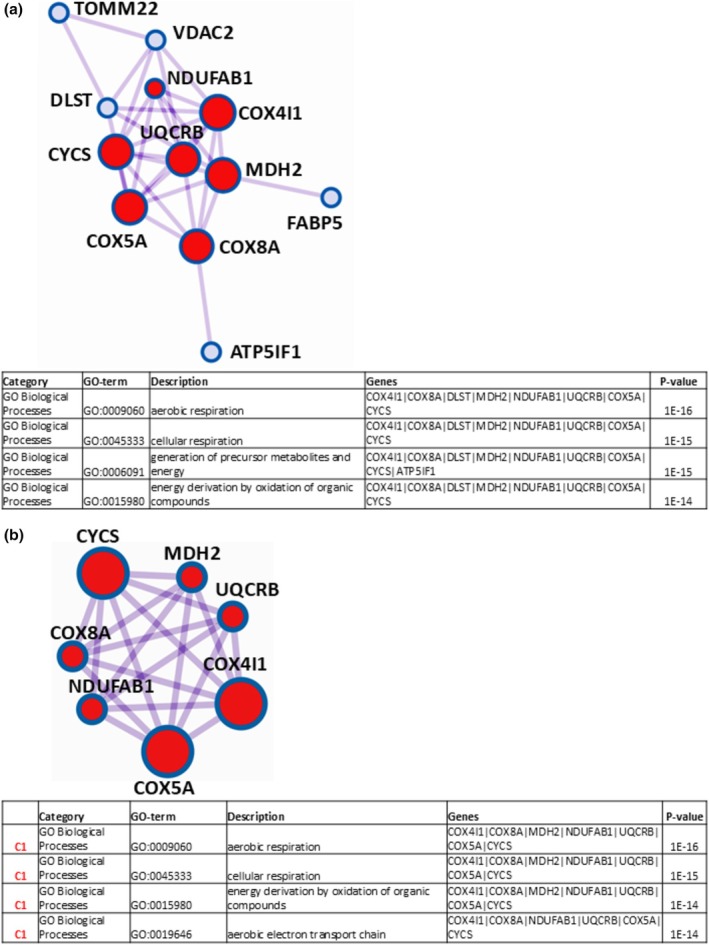
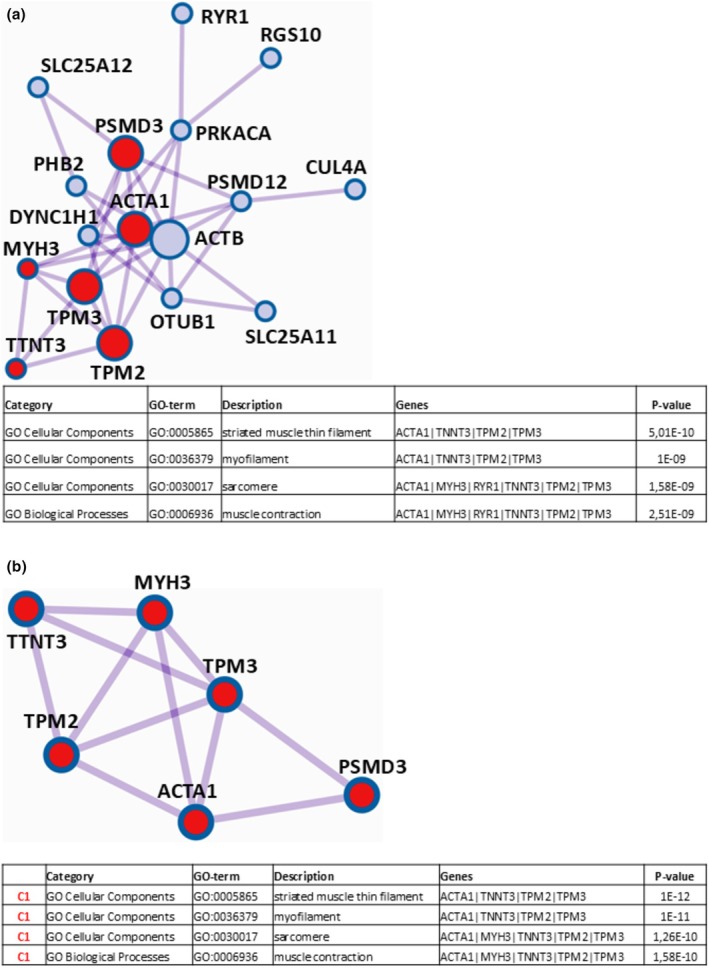
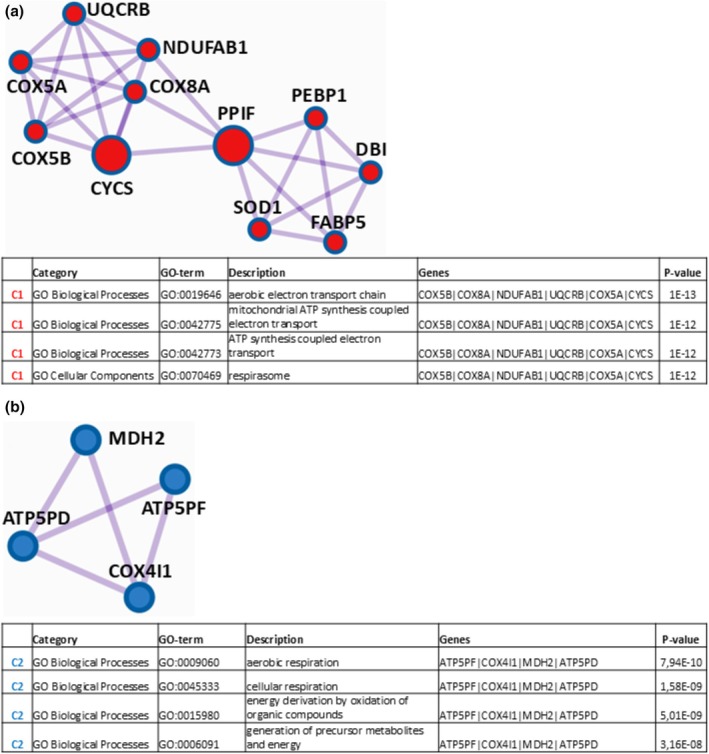
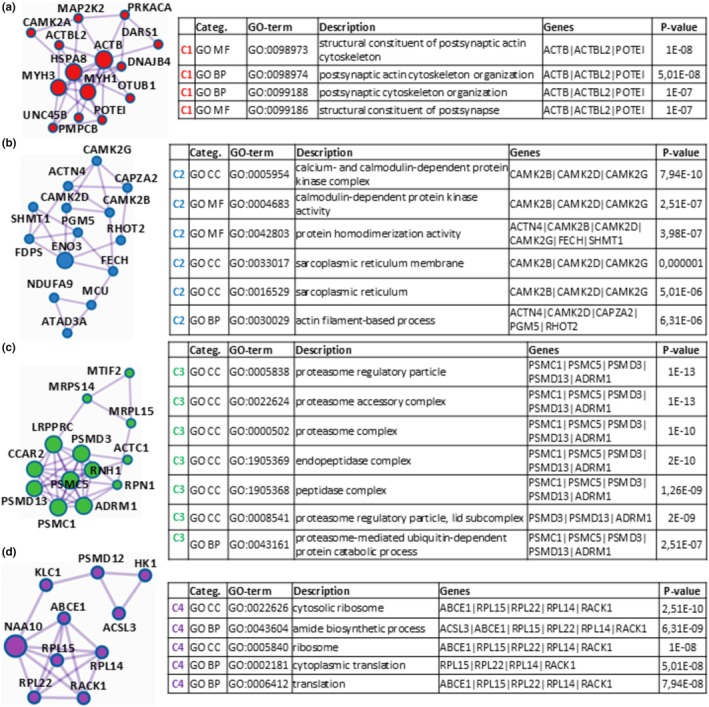
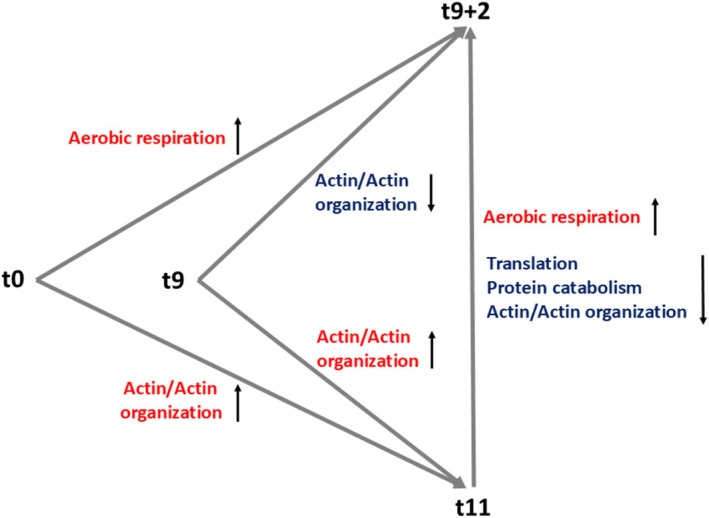
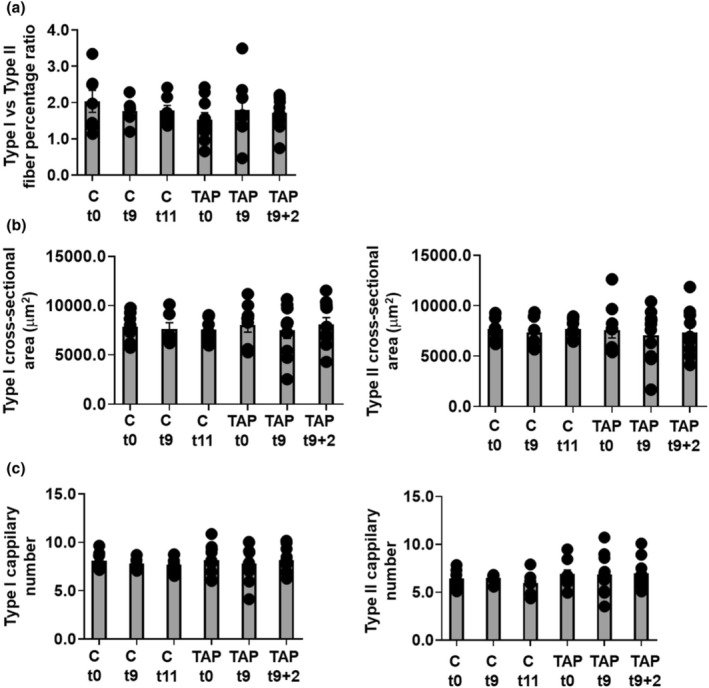
Little is known on how a short-term reduction of training volume changes muscle proteome and physiological parameters. We investigated the impact of halving training volume during regular training of cyclists on physiological parameters in relation to vastus lateralis protein profiles and fiber percentage ratios. Fifteen male cyclists (age: 30.1 ± 9.6 yrs.; VO2max: 59.4 ± 4.4 mL∙kg-1∙min-1; weekly training volume: 8.7 ± 2.3 h) participated in an 11-week training intervention. During 2 weeks after a shared training programme for 9 weeks, a control group continued training and a taper group reduced training volume by 50%. No end-point differences were found for peak power output, maximal oxygen uptake, or peak and mean power in a sprint test (p > 0.05), although in the taper group, muscle proteins involved in mitochondrial aerobic respiration increased whereas those involved in translation, protein catabolism, and actin organization decreased, without between-group differences in type I/type II fiber percentage ratios. Tapering did not decrease power at the first (LT1) and second lactate threshold (LT2) compared to t0, whereas power increased in the control group (LT1: 216 ± 28 W vs. 238 ± 11 W, p = 0.042, LT2: 290 ± 42 W vs. 318 ± 13 W, p = 0.005). Our data indicate that transient 50% training volume reductions may be beneficial for oxidative metabolism in muscle.
Keywords: aerobic capacity; fiber percentage ratio; protein profile; threshold power; training intensity; training volume.
© 2025 The Author(s). Physiological Reports published by Wiley Periodicals LLC on behalf of The Physiological Society and the American Physiological Society.
Figures
Similar articles
-
Low-Volume Speed Endurance Training with Reduced Volume Improves Short-Term Exercise Performance in Highly Trained Cyclists.Med Sci Sports Exerc. 2024 Sep 1;56(9):1709-1721. doi: 10.1249/MSS.0000000000003453. Epub 2024 Apr 23. Med Sci Sports Exerc. 2024. PMID: 38650113
-
The science of cycling: physiology and training - part 1.Sports Med. 2005;35(4):285-312. doi: 10.2165/00007256-200535040-00002. Sports Med. 2005. PMID: 15831059 Review.
-
Inhaled beta2 -agonist, formoterol, enhances intense exercise performance, and sprint ability in elite cyclists.Scand J Med Sci Sports. 2024 Jan;34(1):e14500. doi: 10.1111/sms.14500. Epub 2023 Oct 25. Scand J Med Sci Sports. 2024. PMID: 37880916
-
Effect of tapering after a period of high-volume sprint interval training on running performance and muscular adaptations in moderately trained runners.J Appl Physiol (1985). 2018 Feb 1;124(2):259-267. doi: 10.1152/japplphysiol.00472.2017. Epub 2017 Sep 21. J Appl Physiol (1985). 2018. PMID: 28935825
-
Durability of the moderate-to-heavy-intensity transition is related to the effects of prolonged exercise on severe-intensity performance.Eur J Appl Physiol. 2024 Aug;124(8):2427-2438. doi: 10.1007/s00421-024-05459-6. Epub 2024 Mar 28. Eur J Appl Physiol. 2024. PMID: 38546844 Free PMC article.
References
-
- Cho, I. C. , Park, H. B. , Ahn, J. S. , Han, S. H. , Lee, J. B. , Lim, H. T. , Yoo, C. K. , Jung, E. J. , Kim, D. H. , Sun, W. S. , Ramayo‐Caldas, Y. , Kim, S. G. , Kang, Y. J. , Kim, Y. K. , Shin, H. S. , Seong, P. N. , Hwang, I. S. , Park, B. Y. , Hwang, S. , … Lee, J. W. (2019). A functional regulatory variant of MYH3 influences muscle fiber‐type composition and intramuscular fat content in pigs. PLoS Genetics, 15(10), e1008279. 10.1371/journal.pgen.1008279 - DOI - PMC - PubMed
-
- Coggan, A. R. (2003). Training and Racing with a Power Meter (pp. 123–145). USA Cycling.
MeSH terms
Substances
Grants and funding
LinkOut - more resources
Full Text Sources
