. 2025 Mar 17;14(6):941.
doi: 10.3390/plants14060941.

Multi-Omics Analysis Reveals Differential Molecular Responses of RNA Polymerase Common Subunit ZmRPABC5b for Seedling Development in Maize

Affiliations

Multi-Omics Analysis Reveals Differential Molecular Responses of RNA Polymerase Common Subunit ZmRPABC5b for Seedling Development in Maize

Yaoran Yi et al. Plants (Basel). .

Abstract

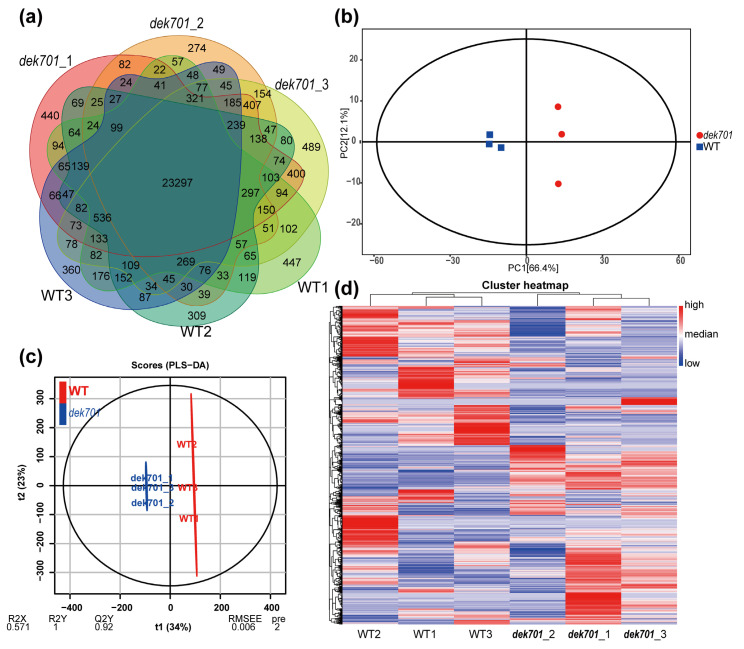
The normal development of maize (Zea mays) seedling is a prerequisite for achieving high crop yields. Although numerous molecular pathways regulate seedling development, the role of RNA polymerases (RNAPs) in this process remains largely unclear, and the function of common RNAP subunits in plants are not well understood. Here, we characterized the loss-of-function mutant of common subunit ZmRPABC5b, defective kernel 701 (dek701), which displays delayed seedling development. To elucidate the role of ZmRPABC5b in maize seedling growth, we conducted transcriptomic and metabolomic analyses. This study found that the loss of ZmRPABC5b function severely impaired early seedling growth, leading to significant reductions in stem length, root length, as well as fresh and dry weight. Transcriptome analysis identified 3780 upregulated and 4385 downregulated differentially expressed genes (DEGs) in dek701 seedlings compared to wild type. Gene Ontology (GO) and Kyoto Encyclopedia of Genes and Genomes (KEGG) enrichment analyses of DEGs revealed that significant enrichment in pathways related to RNA biosynthesis, carbohydrate metabolic, hormone stimulus, cellular transporter and ribosome activity. Metabolome analysis identified 501 differentially expressed metabolites (DEMs) in dek701 seedlings, which were significantly enriched in the amino acid metabolism, secondary metabolites, carbohydrate metabolism, lipid metabolism, transport and translation. These findings provide substantial insight into the ZmRPABC5b regulatory network, positioning it as a central hub for regulating seedling development in maize.

Keywords: RNA polymerase common subunit; maize; metabolome; transcriptome.


Conflict of interest statement

The authors declare no conflicts of interest.

Figures

Figure 1
Figure 1
Phenotypic characterization of seedlings from the dek701 mutant. (a) Comparison of 8 days seedling growth of wild-type (WT) sibling and dek701 mutant. Picture was taken 8 days after seed germination. Bar = 10 cm. (b) Structure of the ZmRPABC5b (Zm00001eb366170) locus and position of dek701 alleles. Lines, introns; black ellipses, exons; white rectangles, untranslated regions. Dek701-F1, dek701-F2 and R1 represent the primer sites. (c) WT and mutant sequence at dek701 locus was identified in the seedlings by PCR using primers Dek701-F1 /R1 and dek701-F2 /R1, respectively. Representative seedlings with the WT (1 to 8) and mutant (9 to 16) phenotype from 8-day seedlings. –, water. (d) RT-PCR analysis of ZmRPABC5b expression in WT sibling and dek701 seedlings. (e,f) The shoot length (e) and root length (f) of the dek701 and wild-type after 8 days of growth was measured. ** p < 0.01 as determined by Student’s t-test. (g,h) The seedlings fresh weight (g) and dry weight (h) of the dek701 and WT after 8 days of growth was measured. ** p < 0.01 as determined by Student’s t-test.
Figure 2
Figure 2
Transcriptome analysis of the dek701 and WT seedling. (a) Venn diagrams of expressed genes identified from dek701 and WT seedlings. (b) Principal component analysis (PCA) of the RNA-Seq data from the three replicated samples of dek701 and WT. (c) PLS-DA of the RNA-Seq data from the three replicated samples of dek701 and WT. (d) Heatmap plotted with fragments per kilobase of transcript per million mapped reads (FPKM) values normalized from low to high based on each gene.
Figure 3
Figure 3
Transcriptome analysis of DEGs between dek701 and WT. (a) Volcano plots of DEGs between dek701 and WT. (b) The DEGs were enriched in ribosome and in response to stimuli according to the results of a GO enrichment analysis. (c) KEGG analyses of the identified DEGs.
Figure 4
Figure 4
Metabolome analysis of the dek701 and WT seedling. (a) Metabolite classification ring diagram. (b) PCA of dek701 and WT based on metabolites. (c) Hierarchical clustering of all samples for heat map analysis. The horizontal coordinate represents different sample groups, the vertical coordinate represents all metabolites, and the color blocks at different locations represent the relative expression of metabolites at different locations, with red indicating high expression of the substance and blue indicating low expression of the substance.
Figure 5
Figure 5
Metabolome analysis of Differentially Accumulated Metabolites (DAMs) between dek701 and WT. (a) Volcano plots of DAMs between dek701 and WT. (b) Kyoto Encyclopedia of Genes and Genomes (KEGG) analyses of the identified DAMs.
Figure 6
Figure 6
Combined transcriptome and metabolome analysis for WT and dek701 seedling. (a) Correlation nine quadrant plot of transcriptome in seedling. The X–axis represents metabolite difference ratio log2, whereas the Y–axis represents gene difference ratio log2. Blue dots indicate consistent and opposite trends in metabolites and genes, green dots indicate only metabolic or genetic differences. (b) Venn diagram of pathways involving differential genes and differential metabolites. (c) The bar plot of differentially expressed genes and differentially accumulated metabolites post KEGG enrichment analysis. The horizontal coordinate represents the metabolic pathway, whereas the vertical coordinate represents the concentration of pathway enrichment.

References

    1. von Hippel P.H. An Integrated Model of the Transcription Complex in Elongation, Termination, and Editing. Science. 1998;281:660–665. doi: 10.1126/science.281.5377.660. - DOI - PubMed
    1. Nudler E. Transcription Elongation: Structural Basis and Mechanisms. J. Mol. Biol. 1999;288:1–12. doi: 10.1006/jmbi.1999.2641. - DOI - PubMed
    1. Schramm L., Hernandez N. Recruitment of RNA Polymerase III to Its Target Promoters. Genes Dev. 2002;16:2593–2620. doi: 10.1101/gad.1018902. - DOI - PubMed
    1. Woychik N.A., Hampsey M. The RNA Polymerase II Machinery: Structure Illuminates Function. Cell. 2002;108:453–463. doi: 10.1016/S0092-8674(02)00646-3. - DOI - PubMed
    1. Grummt I. Life on a Planet of Its Own: Regulation of RNA Polymerase I Transcription in the Nucleolus. Genes Dev. 2003;17:1691–1702. doi: 10.1101/gad.1098503R. - DOI - PubMed

LinkOut - more resources