. 2025 Apr 30;39(8):e70564.
doi: 10.1096/fj.202402876R.

EGF-Induced Macropinocytosis Promotes NAV1-Dependent Internalization of Occludin in Keratinocytes

Affiliations

EGF-Induced Macropinocytosis Promotes NAV1-Dependent Internalization of Occludin in Keratinocytes

Haruka Taira et al. FASEB J. .

Abstract

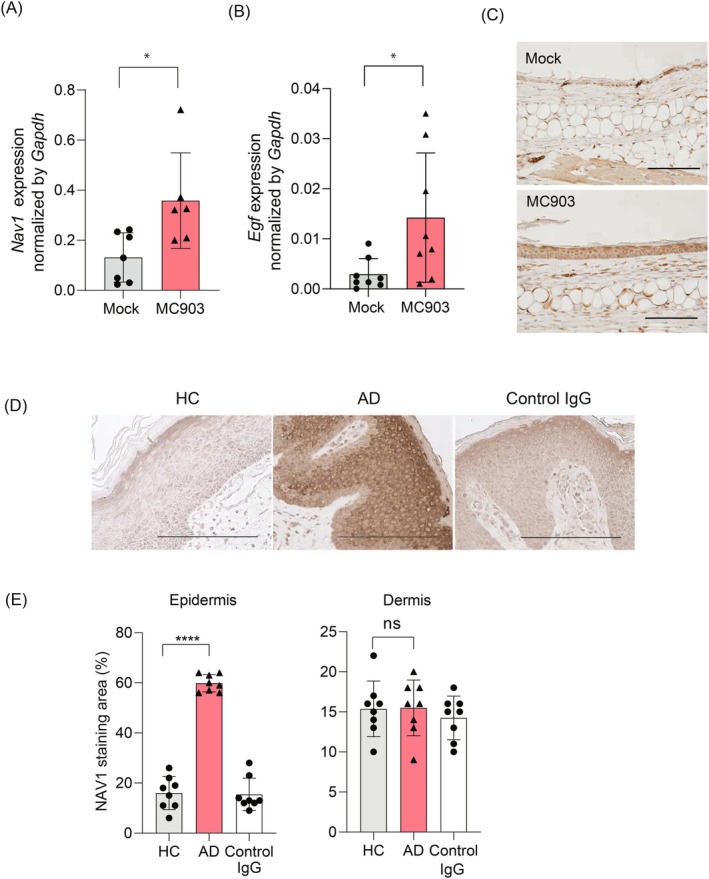
Epidermal keratinocytes form the outermost layer of the skin and serve as a pivotal barrier against external insults. This barrier, however, can be compromised in conditions such as atopic dermatitis (AD), where both genetic and environmental factors contribute to its disruption. Recent studies have indicated that macropinocytosis, a non-selective endocytic process, is involved in the internalization of barrier proteins. In this study, we explored the role of macropinocytosis in differentiated keratinocytes and its potential impact on skin barrier integrity in AD. Our results demonstrated that epidermal growth factor (EGF), but not the type 2 cytokines IL-4 and IL-13, significantly promoted macropinocytosis in differentiated HaCaT keratinocytes. EGF stimulation increased the uptake of 70 kDa dextran and induced the internalization of occludin, a component of tight junction proteins. Furthermore, enhanced macropinocytosis was observed in the epidermis of a mouse model of AD, accompanied by elevated EGF expression in the skin, indicating that the AD skin microenvironment may drive this process. NAV1 was identified as a critical regulator of EGF-induced macropinocytosis, as its knockdown significantly impaired this process. Transcriptome analysis of NAV1-knockdown cells further revealed changes in the expression of Rho family GTPases, including CDC42 and MMP14, suggesting that NAV1 modulates macropinocytosis through Rho-dependent pathways. These findings provide new insights into the regulation of macropinocytosis in keratinocytes and its potential contribution to the barrier dysfunction observed in AD.

Keywords: atopic; dermatitis; endocytosis; rho GTP‐binding proteins; tight junction proteins.


Conflict of interest statement

The authors declare no conflicts of interest.

Figures

FIGURE 1
FIGURE 1
Internalization of 70 kDa FITC‐dextran is induced by EGF but not by IL‐4 and IL‐13. (A) Workflow for the assessment of macropinocytosis in HaCaT cells. HaCaT cells were seeded and differentiated in high concentrations of calcium chloride solution (2.8 mM). Cells were then stimulated with EGF (10 ng/mL), IL‐4 (100 ng/mL), and IL‐13 (100 ng/mL) or left untreated. To assess macropinocytosis, 70 kDa FITC‐dextran was added, and uptake was quantified using flow cytometry. Additionally, immunofluorescence was performed to evaluate occludin localization. (B) Gene expression levels of occludin (OCLN), filaggrin (FLG), keratin 10 (KRT10), and involucrin (INV) in HaCaT cells cultured with 2.8 mM calcium chloride for 4 days or without calcium. Data are presented as mean ± SD. Student's t‐test was conducted for comparison. **p < 0.01, ***p < 0.001. (C) Quantification of 70 kDa FITC‐dextran internalization by flow cytometry. Mean fluorescence intensity (MFI) was measured to assess 70 kDa FITC‐dextran uptake. Data are presented as mean ± SD. One‐way ANOVA analysis of variance with Dunnett's multiple comparisons was conducted for comparison. ****p < 0.0001. ns, not significant. (D) Representative flow cytometry histogram plots depicting the uptake of 70 kDa FITC‐dextran by HaCaT cells stimulated by IL‐4/IL‐13 or EGF. (E) Immunofluorescence images for occludin in HaCaT cells stimulated by IL‐4/IL‐13 or EGF. The scale bar represents 50 μm.
FIGURE 2
FIGURE 2
Enhancement of 70 kDa FITC‐dextran uptake by EGF is dependent on macropinocytosis. Differentiated HaCaT cells were pretreated with either 50 or 100 μM of N‐(ethyl‐N‐isopropyl)‐amiloride (EIPA) for 1 h, followed by stimulation with EGF (10 ng/mL) and addition of 70 kDa FITC‐dextran (0.5 mg/mL). (A) Quantification of 70 kDa FITC‐dextran internalization by flow cytometry. (MFI) values are shown. Data are presented as mean ± SD. One‐way ANOVA analysis of variance with Dunnett's multiple comparisons was conducted for comparison. ****p < 0.0001. (B) Representative flow cytometry histogram plots depicting uptake of 70 kDa FITC‐dextran by HaCaT cells pretreated with indicated concentrations of EIPA (50 or 100 μM), followed by EGF stimulation. (C) Immunofluorescence images for occludin in HaCaT cells pretreated with or without EIPA, followed by EGF stimulation (10 ng/mL). The scale bar represents 50 μm. (D) Gene expression levels of OCLN in HaCaT cells at 6 and 24 h post‐EGF stimulation. Data are presented as mean ± SD. Student's t‐test was conducted for comparison. (E) Immunoblotting for occludin and β‐actin in HaCaT cells at 24 h after EGF stimulation (10 ng/mL). Data are presented as mean ± SD. Student's t‐test was conducted for comparison. ns: Not significant.
FIGURE 3
FIGURE 3
Macropinocytosis is enhanced in the epidermis of the MC903‐induced AD‐like skin dermatitis model. WT mice had either MC903 (2 nM) or vehicle applied externally to their ears for 9 consecutive days. On Day 10, 70 kDa FITC‐dextran (5 mg/mL) was applied to their ears for 1 h to evaluate macropinocytosis. (A) Changes in ear thickness of mock‐treated mice (Mock; N = 5) and MC903‐treated mice (MC903; N = 5) at the indicated time points are shown (right‐hand). Data are presented as mean ± SD. Comparison was conducted using two‐way analysis of variance, followed by Bonferroni's multiple comparisons test. *p < 0.05, **p < 0.01, ***p < 0.001. (B) Representative gross appearance and H&E staining of ear sections (left‐hand) from mice treated with mock or MC903 at Day 10. The scale bar represents 200 μm. (C) Quantification of 70 kDa FITC‐dextran uptake by flow cytometry in the epidermis of mock‐treated mice (N = 9) and MC903‐treated mice (N = 9) on Day 10. Five mice were assigned to the control group and to the MC903 application group, respectively. A total of nine ear samples were analyzed, and the results from three independent experiments were combined for analysis. Data are presented as mean ± SD. Student's t‐test was conducted for comparison for MFI analysis. ****p < 0.0001. (D) Representative flow cytometry histogram plots depicting 70 kDa FITC‐dextran uptake in the auricular epidermis of mock or MC903‐treated mice on Day 10. (E) Application of EIPA (10 mM) was performed prior to topical application of MC903 on Days 5–9. The number of cells showing increased uptake of 70 kDa FITC‐dextran following topical application of MC903, with (N = 4) or without (N = 4) EIPA, was assessed by flow cytometry on Day 10. Four ears from two mice were used in this experiment, and the results were analyzed in a single experiment. Data are presented as mean ± SD. Student's t‐test was conducted for comparison. *p < 0.05.
FIGURE 4
FIGURE 4
EGF‐induced macropinocytosis is partially dependent on NAV1. (A) Gene expression levels of NAV1 in HaCaT cells at 6‐ and 24‐h post‐stimulation by EGF (10 ng/mL). Data are presented as mean ± SD. Student's t‐test was conducted for comparison. *p < 0.05. (B) HaCaT cells were transfected with siRNA for NAV1 (si NAV1‐1 and si NAV1‐2) or negative control siRNA (si NC). The efficiency of siRNA‐mediated gene knockdown was confirmed by RT‐qPCR. Data are presented as mean ± SD. One‐way ANOVA analysis of variance with Dunnett's multiple comparisons was conducted for comparison. ***p < 0.001. (C) HaCat cells transfected with siNAV1‐1, siNAV1‐2, or siNC were differentiated by 2.8 mM calcium chloride solution followed by EGF stimulation (10 ng/mL). Six hours after EGF application, 70 kDa FITC‐dextran uptake was assessed using flow cytometry. Data are presented as mean ± SD. One‐way ANOVA analysis of variance with Dunnett's multiple comparisons was conducted for MFI analysis. ****p < 0.0001. (D) Representative flow cytometry histogram plots depicting internalization of 70 kDa FITC‐dextran by HaCaT cells transfected with siNAV1‐1, siNAV1‐2, and siNC, followed by EGF stimulation.
FIGURE 5
FIGURE 5
Transcriptional analysis of NAV1‐dependent signaling in HaCaT cells. (A) MA plot showing log2 fold changes against the mean of normalized read counts for genes of siNAV1 versus siNC. Genes with an adjusted p‐value < 0.1 and a positive fold change are shown in red, while those with a negative fold change are shown in blue. Representative genes are labeled. (B) Correlation matrix of RNA‐seq samples. The correlation matrix shows Pearson correlation coefficients between replicates of control (siNC‐1, siNC‐2) and NAV1 knockdown (siNAV1‐1, siNAV1‐2) samples. (C) GO and pathway analysis of down‐regulated genes in NAV1 knockdown samples. The top 7 GO terms and pathways, along with their associated −log10 p values and gene ratio, identified using Metascape, are presented. (D) Heatmap showing Z‐scores of normalized read counts for selected macropinocytosis‐related genes across two conditions (siNC and siNAV1) with duplicate samples for each condition. Z‐scores were calculated for each gene to standardize expression levels across samples. Color intensity corresponds to the degree of deviation from the mean expression level, with a gradient from blue (low) to red (high). (E) Bar graphs showing normalized read counts of representative genes associated with macropinocytosis that were downregulated in NAV1‐knockdown cells.
FIGURE 6
FIGURE 6
NAV1 expression and localization in the skin of the MC903‐induced AD‐like skin dermatitis model and AD patient samples. (A, B) Gene expression levels of Nav1 (A) and Egf (B) in the epidermis of the ear of MC903‐treated mice (N = 6–8) were compared with those of the mock‐treated control group (N = 7–8). A total of six to eight ears from three to four mice in each group were used in this experiment, with evaluations compiled from two independent experiments. Data are presented as mean ± SD. An unpaired t‐test with Welch's correction was conducted for comparison. *p < 0.05. (C) Immunohistochemical staining of NAV1 in the skin of mice treated with mock or MC903 at Day 10. Scale bar is 100 μm. (D) Immunohistochemical staining of NAV1 in the skin sections from healthy controls and patients with AD. Results are representative of 4 healthy controls and 4 AD patients. The scale bar represents 200 μm. (E) The percentage of areas with NAV1 staining in the epidermis and dermis of the lesional skin of AD and the skin of healthy counterparts. Data are presented as mean ± SD. One‐way ANOVA analysis of variance with Dunnett's multiple comparisons was conducted for comparison. ****p < 0.0001. ns, not significant.
FIGURE 7
FIGURE 7
Proposed model of EGF‐induced macropinocytosis in keratinocytes. Under homeostatic conditions, keratinocytes maintain a stable barrier function with minimal macropinocytosis. Upon EGF stimulation, NAV1 and members of the Rho family are induced, leading to enhanced macropinocytosis. This process involves internalization of a tight junction protein, occludin, which may disrupt the epidermal barrier.

References

    1. Ständer S., “Atopic Dermatitis,” New England Journal of Medicine 384 (2021): 1136–1143. - PubMed
    1. Drislane C. and Irvine A. D., “The Role of Filaggrin in Atopic Dermatitis and Allergic Disease,” Annals of Allergy, Asthma & Immunology 124 (2020): 36–43. - PubMed
    1. Beck L. A., Cork M. J., Amagai M., et al., “Type 2 Inflammation Contributes to Skin Barrier Dysfunction in Atopic Dermatitis,” JID Innovations 2, no. 5 (2022): 100131, 10.1016/j.xjidi.2022.100131. - DOI - PMC - PubMed
    1. Brunello L., “Atopic Dermatitis,” Nature Reviews Disease Primers 4, no. 1 (2018): 2, 10.1038/s41572-018-0004-9. - DOI - PubMed
    1. Koga C., Kabashima K., Shiraishi N., Kobayashi M., and Tokura Y., “Possible Pathogenic Role of Th17 Cells for Atopic Dermatitis,” Journal of Investigative Dermatology 128 (2008): 2625–2630. - PubMed

LinkOut - more resources