Discrepancy in SARS-CoV-2 Infection Status Among PCR, Serological, and Cellular Immunity Assays of Nucleocapsids: A Historical Cohort Study
- PMID: 40266135
- PMCID: PMC11945907
- DOI: 10.3390/vaccines13030259
Discrepancy in SARS-CoV-2 Infection Status Among PCR, Serological, and Cellular Immunity Assays of Nucleocapsids: A Historical Cohort Study
Abstract
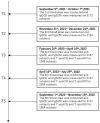
Background/Objectives: Limited research has compared tests assessing humoral and cellular immunity related to SARS-CoV-2 infection. This study evaluated immunoglobulin G for nucleocapsid (IgG(N)) and T-spot for nucleocapsid (T-spot(N)) assays against polymerase chain reaction (PCR) test results for identifying infected individuals. Methods: This study included participants who had completed five blood samplings since their second COVID-19 vaccination between 9 September 2021 and 6 November 2022. Chemiluminescent immunoassay (CLIA) tests measured the humoral immune response, IgG(S) and neutralizing activity tests the immune status, and IgG(N) tests the infection history. For cellar immunity, T-spot(S) indicated immune status, and T-spot(N) indicated infection history. Results: The primary outcome was the proportion of individuals who tested positive for PCR and the proportion who tested positive for IgG(N) and T-spot(N). Overall, this study included 2104 participants. In the PCR-negative group, 1838 individuals tested negative for IgG(N), whereas 64 tested positive at least once. The geometric mean of IgG(S) at T5 was 1541.7 AU/mL in the IgG(N)-negative group and 3965.8 AU/mL in the IgG(N)-positive group, which was 2.6 times higher. In the PCR-positive group, 25 individuals tested negative for IgG(N), while 177 tested positive at least once. The geometric mean of IgG(S) at T5 was 2700.6 AU/mL in the IgG(N)-negative group and 5400.8 AU/mL in the IgG(N)-positive group, showing higher values in the IgG(N)-positive group. Conclusions: A discrepancy was noted between PCR test results and the IgG(N) and T-spot(N) determinations. Combining multiple assays is required to accurately identify the past-infected population.
Keywords: COVID-19; SARS-CoV-2; cellular immunity; humoral immunity; nucleocapsid.
Conflict of interest statement
Kaneko is employed by Medical and Biological Laboratories, Co. (MBL, Tokyo, Japan). MBL imported the testing materials used in this study. Kaneko participated in the testing process; however, he was not involved in the research design and analysis. Kobashi and Tsubokura received a research grant from the Pfizer Health Research Foundation for research that is not associated with this study (from 1 December 2020 to 30 November 2022). All authors declare no other competing interests.
Figures


Similar articles
-
Persistence of T-Cell Immunity Responses against SARS-CoV-2 for over 12 Months Post COVID-19 Infection in Unvaccinated Individuals with No Detectable IgG Antibodies.Vaccines (Basel). 2023 Nov 27;11(12):1764. doi: 10.3390/vaccines11121764. Vaccines (Basel). 2023. PMID: 38140169 Free PMC article.
-
[Investigation of SARS-CoV-2-Specific Humoral and Cellular Immunity Values in Health Care Workers with COVID-19 Disease and Administered with COVID-19 Vaccine].Mikrobiyol Bul. 2022 Jul;56(3):480-492. doi: 10.5578/mb.20229708. Mikrobiyol Bul. 2022. PMID: 35960239 Turkish.
-
[Humoral immunity against SARS-CoV-2 in workers of social health care centers of Castilla y León after vaccination with the BNT162b2 mRNA vaccine from Pfizer/Biontech.].Rev Esp Salud Publica. 2021 Oct 25;95:e202110141. Rev Esp Salud Publica. 2021. PMID: 34690347 Spanish.
-
The humoral immune response more than one year after SARS-CoV-2 infection: low detection rate of anti-nucleocapsid antibodies via Euroimmun ELISA.Infection. 2023 Feb;51(1):83-90. doi: 10.1007/s15010-022-01830-x. Epub 2022 Jun 1. Infection. 2023. PMID: 35648370 Free PMC article.
-
Longitudinal Follow Up of Immune Responses to SARS-CoV-2 in Health Care Workers in Sweden With Several Different Commercial IgG-Assays, Measurement of Neutralizing Antibodies and CD4+ T-Cell Responses.Front Immunol. 2021 Nov 2;12:750448. doi: 10.3389/fimmu.2021.750448. eCollection 2021. Front Immunol. 2021. PMID: 34795668 Free PMC article.
References
-
- Lee J., Song J.U., Shim S.R. Comparing the diagnostic accuracy of rapid antigen detection tests to real time polymerase chain reaction in the diagnosis of SARS-CoV-2 infection: A systematic review and meta-analysis. J. Clin. Virol. 2021;144:104985. doi: 10.1016/j.jcv.2021.104985. - DOI - PMC - PubMed
Grants and funding
LinkOut - more resources
Full Text Sources
Medical
Miscellaneous

