. 2025 Mar 13;13(3):311.
doi: 10.3390/vaccines13030311.

Inflammatory and Humoral Immune Responses to Commercial Autogenous Salmonella Bacterin Vaccines in Light-Brown Leghorn Pullets: Primary and Secondary Vaccine Responses

Affiliations

Inflammatory and Humoral Immune Responses to Commercial Autogenous Salmonella Bacterin Vaccines in Light-Brown Leghorn Pullets: Primary and Secondary Vaccine Responses

Chrysta N Beck et al. Vaccines (Basel). .

Abstract

Background/objectives: Commercial poultry flocks undergo Salmonella vaccinations to manage salmonellosis outbreaks. Due to reports of severe injection site reactions to Salmonella bacterins, assessment of local inflammatory responses is necessary. The objective was to assess local inflammatory and systemic humoral immune responses to commercial autogenous Salmonella bacterin vaccines (SV1 or SV2) following primary or secondary intradermal (i.d.) vaccination in Light-Brown Leghorns (LBLs).

Methods: LBL pullets received primary (14 wks) or secondary (19 wks) vaccination by i.d. growing feather (GF) pulp injection of SV1, SV2, Salmonella Enteritidis (SE) lipopolysaccharide (LPS), or water-oil-water emulsion (V). Local leukocyte levels and relative cytokine mRNA expression were monitored before (0 d) and at 6 h, 1 d, 2 d, 3 d, 5 d, and 7 d post-GF pulp injection (p.i.). Blood was collected through 28 d post-primary or -secondary vaccination, and SE-specific antibodies were quantified via ELISA.

Results: Primary vaccine administration increased local heterophil and macrophage levels and increased IL-6 and IL-8 mRNA expressions at 6 h p.i., independent of treatment. Secondary administration extended these local immune activities through 3 d p.i. and included prolonged IL-17A mRNA expression. Primary and secondary GF-pulp injection with V resulted in rapid lymphocyte recruitment by 6 h p.i., comprised primarily of CD4+ and γδ T cells. SV1 and SV2 also produced a T-dependent systemic humoral immune response, as indicated by the IgM-to-IgG isotype switch, along with a memory phenotype in the secondary response.

Conclusions: These commercial-killed Salmonella vaccines, when prepared in water-oil-water emulsions, stimulated prolonged innate and T helper (Th) 17-type inflammatory responses at the injection site and produced a classic systemic humoral immune response after a second vaccination. Further research is needed to determine if extended inflammation influences adaptive immune responses in eliminating Salmonella infection.

Keywords: Salmonella vaccine; T cells; antibody; chicken; inflammation; innate immunity.


Conflict of interest statement

The authors declare no conflicts of interest.

Figures

Figure 1
Figure 1
Salmonella Enteritidis-specific IgM, IgG, and IgA levels in the peripheral blood of Light-Brown Leghorn (LBL) pullets following a primary subcutaneous (s.c.) and secondary intradermal (i.d.) vaccination with autogenous Salmonella bacterin vaccines or vaccine components. Salmonella Enteritidis (SE)-specific antibodies in peripheral blood were measured in LBL pullets from Group 2. For the primary vaccination, 14-week-old pullets were s.c. vaccinated with 0.5 mL of autogenous Salmonella bacterin vaccine (SV) 1 (n = 4), SV2 (n = 4), SE lipopolysaccharide (LPS; n = 4), or water–oil–water emulsion vaccine vehicle (V; n = 3) in the nape of the neck. For the secondary vaccination, the respective s.c. treatments (trts) were i.d.-injected into the growing feather (GF) pulp at 19 weeks of age (21 GF/pullet, 10 μL/GF, 210 μL total injection volume). Heparinized blood was collected from the brachial wing vein before (0 d) and at 3, 5, 7, 10, 14, 21, and 28 d post-primary and secondary vaccination. Antibody levels were quantified by ELISA. Data were analyzed by two-way repeated measures ANOVA (trt, time, and their interactions) and are presented as mean absorbance units (a.u.) ± SEM. xz: Timepoints that do not share the same superscript are statistically different; ac: Trt that do not share the same superscript are statistically different; Trt*time interactions are denoted above each bar in the figure where timepoints within a trt that do not share the same superscript (xz) are statistically different, and trt groups within a timepoint that do not share the same superscript (ac) are statistically different.
Figure 2
Figure 2
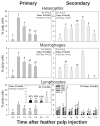
Leukocyte profiles in growing feather (GF) pulps following primary or secondary intradermal injection of commercial Salmonella bacterin vaccines or vaccine components in Light-Brown Leghorn (LBL) pullets. For the primary intradermal (i.d.) vaccination (Group 1), 14-week-old pullets were i.d.-injected into the GF pulp with Salmonella vaccine treatments (trt): SV1 (n = 4), SV2 (n = 4), SE lipopolysaccharide (LPS; n = 4), or water–oil–water emulsion vaccine vehicle (V; n = 3; 10 μL of injected/GF, 12 GF/pullet, 120 μL of total injection volume). For the secondary i.d. vaccination (Group 2), 14-week-old pullets were subcutaneously (s.c.) administered with Group 1 trt in the nape of the neck (0.5 mL), followed by i.d. GF-pulp injection at 19 wk with their respective s.c. trt (21 GF/pullet, 10 μL/GF, and 210 μL of total injection volume). Injected GF from primary and secondary i.d vaccinations were collected before (0 d) and at 6 h, 1 d, 2 d, 3 d, 5 d, and 7 d post-injection. Direct-immunofluorescent staining of GF-pulp cell suspensions with fluorescence-conjugated, chicken leukocyte-specific, mouse monoclonal antibodies (Southern Biotech, Birmingham, AL, USA) identified macrophage and lymphocyte populations. Cell population analysis was conducted using fluorescence-based flow cytometry. Heterophil gating was based on the size and granularity of CD45+ cells [33]. Lymphocytes were calculated by adding the percentages of CD4+ T cells, CD8α+ T cells, CD8α γδ T cells, and B cells. Data were analyzed by two-way ANOVA (trt, time, and their interactions), and shown as mean % pulp cells ± SEM. xz: Timepoints that do not share the same superscript are statistically different; a,b: Trts that do not share the same superscript are statistically different; Trt*time interactions are denoted above each bar in the figure where timepoints within a trt that do not share the same superscript (xz) are statistically different, and trt groups within a timepoint that do not share the same superscript (a,b) are statistically different.
Figure 3
Figure 3
Lymphocyte profiles in growing feather (GF) pulps following primary or secondary intradermal injection of commercial Salmonella bacterin vaccines or vaccine components in Light-Brown Leghorn (LBL) pullets. For the primary intradermal injection, 14-week-old pullets of Group 1 were intradermally (i.d.) injected into the GF pulp with Salmonella vaccine treatments (trt): SV1, SV2, SE lipopolysaccharide (LPS), or water–oil–water emulsion vaccine vehicle (V; 10 μL of injected/GF, 24 GF/pullet and 240 μL of total injection volume). For the secondary intradermal injection, 14-week-old pullets of Group 2 were subcutaneously (s.c.) administered (0.5 mL) with the same treatments (trts) as Group 1 in the nape of the neck followed by i.d. GF-pulp injection at 19 weeks of age with their respective s.c. trt (21 GF/pullet, 10 μL/GF, and 210 μL of total injection volume). Injected GF from primary and secondary i.d. vaccinations were collected before (0 d) and at 6 h, 1 d, 2 d, 3 d, 5 d, and 7 d post-injection (p.i.). Direct-immunofluorescent staining of GF-pulp cell suspensions with fluorescence-conjugated, chicken leukocyte-specific, mouse monoclonal antibodies (Southern Biotech, Birmingham, AL) identified T cell and B cell populations, and cell population analysis was conducted by fluorescence-based flow cytometry. Total T lymphocytes were quantified by adding together the percentages of CD4+ T cells, CD8α+ T cells, and CD8α γδ T cells. Data were analyzed by two-way ANOVA (trt, time, and their interactions), and data are shown as mean % pulp cells ± SEM. x–z: Timepoints that do not share the same superscript are statistically different; a,b: Trt that do not share the same superscript are statistically different; Trt*time interactions are denoted above each bar in the figure where timepoints within a trt that do not share the same superscript (x–z) are statistically different, and trt groups within a timepoint that do not share the same superscript (a,b) are statistically different.
Figure 4
Figure 4
T lymphocyte subpopulations in growing feather (GF) pulps following secondary intradermal (i.d.) injection of commercial Salmonella bacterin vaccines or vaccine components in Light-Brown Leghorn (LBL) pullets. For the secondary intradermal injection (Group 2), 14-week-old pullets were subcutaneously (s.c.) administered (0.5 mL) with Salmonella vaccine treatments (trt): SV1, SV2, SE lipopolysaccharide (LPS), or water–oil–water emulsion vaccine vehicle (V) in the nape of the neck followed by secondary i.d. GF-pulp injection at 19 weeks of age with their respective s.c. trt (21 GF/pullet, 10 μL/GF, and 210 μL of total injection volume). Injected GF from primary and secondary i.d. vaccinations were collected before (0 d) and at 6 h, 1 d, 2 d, 3 d, 5 d, and 7 d post-injection (p.i.). Direct-immunofluorescent staining of GF-pulp cell suspensions with fluorescence-conjugated, chicken leukocyte-specific, mouse monoclonal antibodies (Southern Biotech, Birmingham, AL, USA) identified T cell subpopulations (CD4+, CD8α+, and total γδ T cells). Cell populations were analyzed by flow cytometry. Data were analyzed by two-way ANOVA (trt, time, and their interactions), and data are shown as mean % pulp cells ± SEM for each leukocyte population. x–z: Timepoints that do not share the same superscript are statistically different; a,b: Trts that do not share the same superscript are statistically different; Trt*time interactions are denoted above each bar in the figure where timepoints within a trt that do not share the same superscript (x–z) are statistically different, and trt groups within a timepoint that do not share the same superscript (a,b) are statistically different.
Figure 5
Figure 5
Inflammatory cytokine mRNA expression profiles in growing feather (GF) pulps following primary or secondary intradermal (i.d.) injection of commercial Salmonella bacterin vaccines or vaccine components in Light-Brown Leghorn (LBL) pullets. For the primary i.d. injection (Group 1), 14-week-old pullets were i.d. injected into the GF pulp with Salmonella vaccine treatments (trt): SV1, SV2, SE lipopolysaccharide (LPS), or water–oil–water emulsion vaccine vehicle (V; 10 μL of injected/GF, 24 GF/pullet, 240 μL of total injection volume). For the secondary i.d. injection (Group 2), 14-week-old pullets were subcutaneously (s.c.) administered (500 μL) with the same treatments trt as Group 1 in the nape of the neck followed by i.d. GF-pulp injection at 19 weeks with their respective s.c. trt (21 GF/pullet, 10 μL/GF, 210 μL of total injection volume). Injected GF from primary and secondary i.d. vaccinations were collected before (0 d) and at 6 h, 1 d, 2 d, 3 d, 5 d, and 7 d-post-injection (p.i.). Cytokine mRNA expression was measured by quantitative RT-qPCR. Data were analyzed by two-way ANOVA (trt, time, and their interactions), and presented as mean 40 − ∆CT ± SEM for (A) IL-1β, IL-6, IL-8, and IL-10, and (B) IL-12α and TNF-α. x–z: Timepoints that do not share the same superscript are statistically different; a,b: Trts that do not share the same superscript are statistically different; Trt*time interactions are denoted above each bar in the figure where timepoints within a trt that do not share the same superscript (x–z) are statistically different, and trt groups within a timepoint that do not share the same superscript (a,b) are statistically different.
Figure 6
Figure 6
Effector T cell cytokine mRNA expression profiles in growing feather (GF) pulps following primary or secondary intradermal (i.d.) injection of commercial Salmonella bacterin vaccines or vaccine components in Light-Brown Leghorn pullets. For the primary i.d. administration, 14-week-old pullets were i.d. injected into the GF-pulp with Salmonella vaccine treatments (trt): SV1, SV2, SE lipopolysaccharide (LPS), or water–oil–water emulsion vaccine vehicle (V) (10 μL of injected/GF, 12 GF/pullet, 120 μL of total injection volume). For the secondary i.d. administration, the same trts were subcutaneously (s.c.) administered (0.5 mL) in the nape of the neck of 14-week-old pullets followed by i.d. GF-pulp injection with their respective s.c. trt at 19 weeks of age (21 GF/pullet, 10 μL/GF, 210 μL total injection volume). Injected GF from primary and secondary i.d. vaccinations were collected before (0 d) and at 6 h, 1 d, 2 d, 3 d, 5 d, and 7 d post-injection (p.i.). Cytokine mRNA expression was measured by quantitative RT-qPCR. Data were analyzed by two-way ANOVA (trt, time, and their interactions), and presented as mean 40 − ∆CT ± SEM for (A) IL-13 and IL-17A, and (B) IFN-γ, IL-4, and TGF-β1. x–z: Timepoints that do not share the same superscript are statistically different; a,b: Trts that do not share the same superscript are statistically different; Trt*time interactions are denoted above each bar in the figure where timepoints that do not share the same superscript (x–z) are statistically different, and treatment Groups that do not share the same superscript (a,b) are statistically different.

Similar articles

References

    1. Hy-Line International Vaccination Recommendations. [(accessed on 4 May 2021)]. Available online: https://www.hyline.com/ViewFile?id=7c275f35-64c0-466a-a40f-eb24d1fe0d9f.
    1. Armwood B.T., Rieth A., Baldwin L., Stephen Roney C., Barbieri N.L., Logue C.M. Assessing the Ability of Maternal Antibodies to Protect Broiler Chicks Against Colonization by Salmonella Heidelberg. Avian Dis. 2019;63:289–293. doi: 10.1637/11970-091218-Reg.1. - DOI - PubMed
    1. Crouch C.F., Nell T., Reijnders M., Donkers T., Pugh C., Patel A., Davis P., van Hulten M.C.W., de Vries S.P.W. Safety and Efficacy of a Novel Inactivated Trivalent Salmonella enterica Vaccine in Chickens. Vaccine. 2020;38:6741–6750. doi: 10.1016/j.vaccine.2020.08.033. - DOI - PubMed
    1. Groves P.J., Sharpe S.M., Muir W.I., Pavic A., Cox J.M. Live and Inactivated Vaccine Regimens against Caecal Salmonella Typhimurium Colonisation in Laying Hens. Aust. Vet. J. 2016;94:387–393. doi: 10.1111/avj.12490. - DOI - PMC - PubMed
    1. Kaiser M.G., Lakshmanan N. Lamont Salmonella enterica Serovar Enteritidis Burden in Broiler Breeder Chicks Genetically Associated with Vaccine Antibody Response. Avian Dis. 2002;46:25–31. doi: 10.1637/0005-2086(2002)046[0025:SESEBI]2.0.CO;2. - DOI - PubMed

LinkOut - more resources