

Late-onset GM2 gangliosidosis: magnetic resonance imaging, diffusion tensor imaging, and correlational fiber tractography differentiate Tay-Sachs and Sandhoff diseases
- PMID: 40266357
- PMCID: PMC12018622
- DOI: 10.1007/s00415-025-13091-3
Late-onset GM2 gangliosidosis: magnetic resonance imaging, diffusion tensor imaging, and correlational fiber tractography differentiate Tay-Sachs and Sandhoff diseases
Abstract
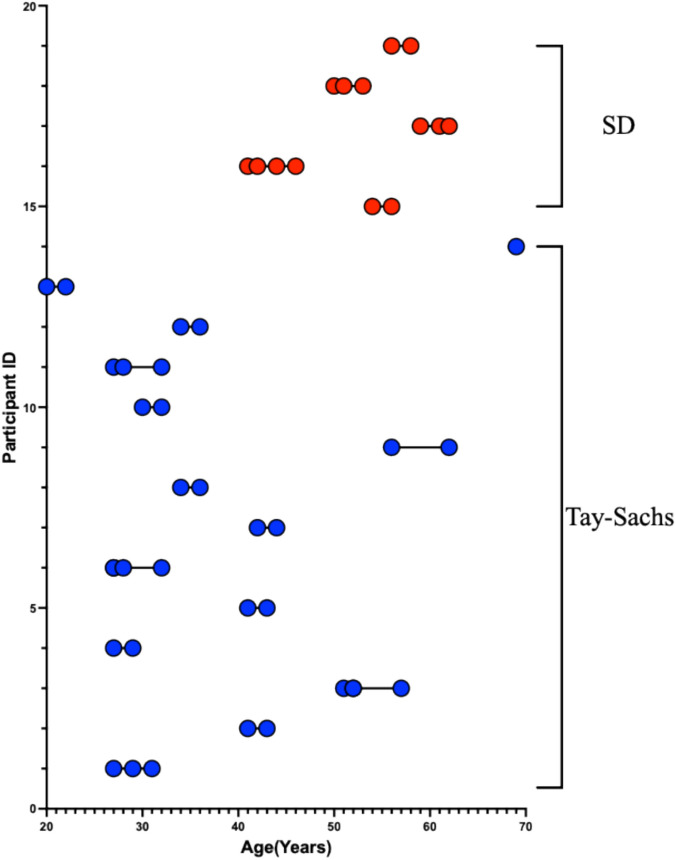
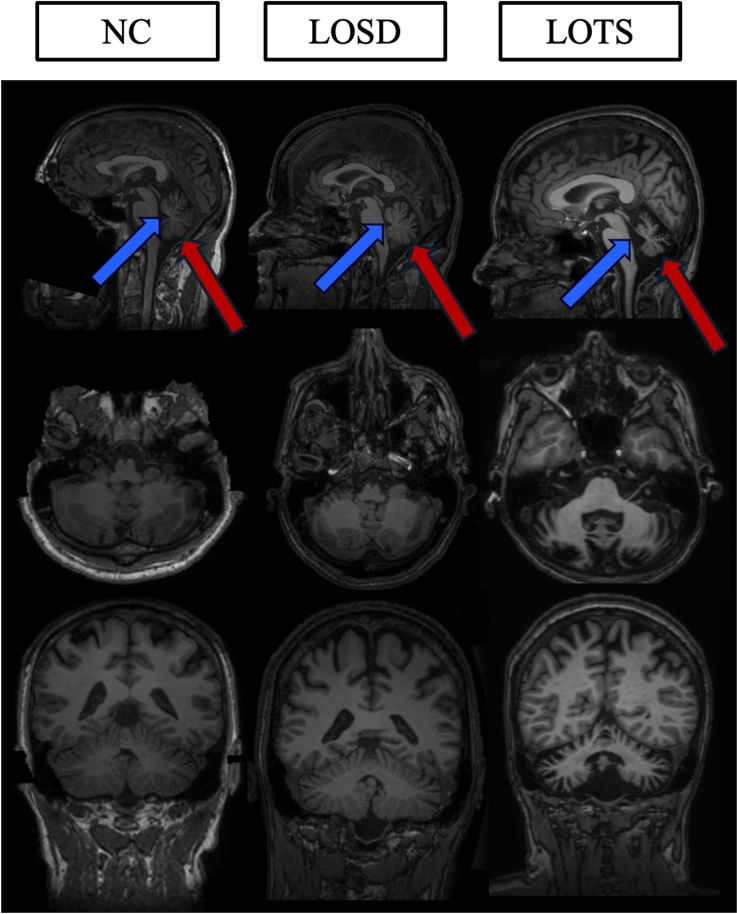
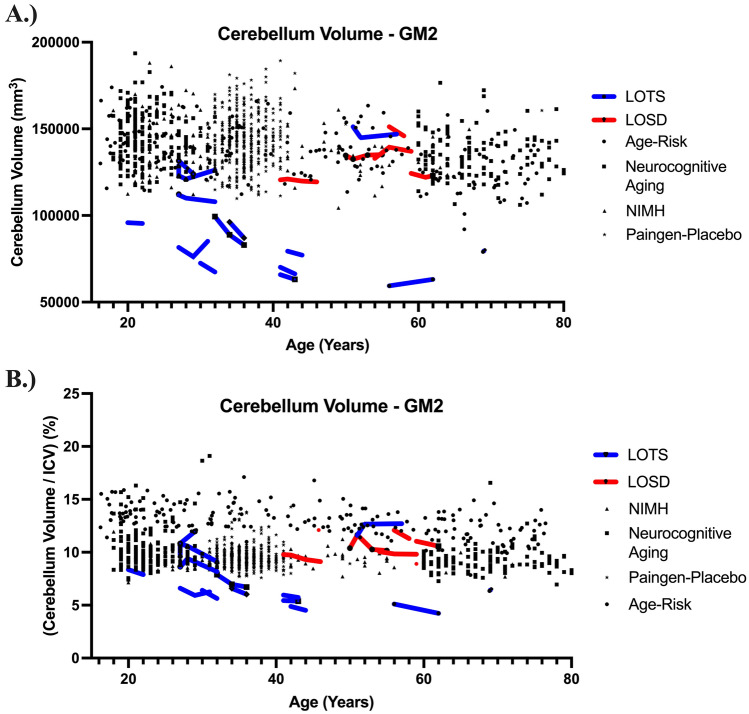
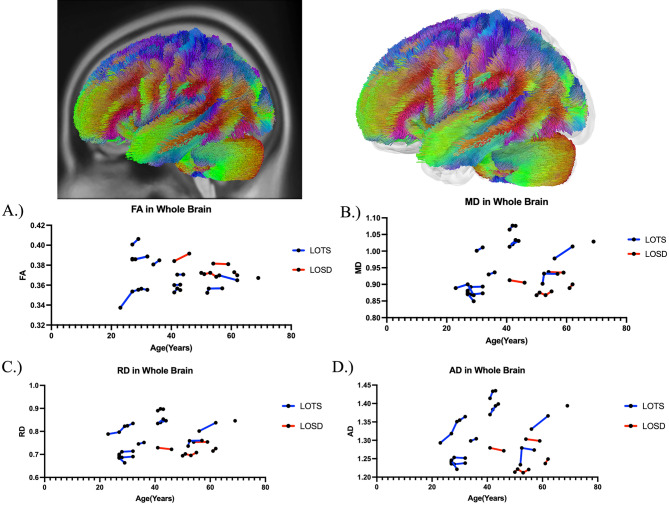
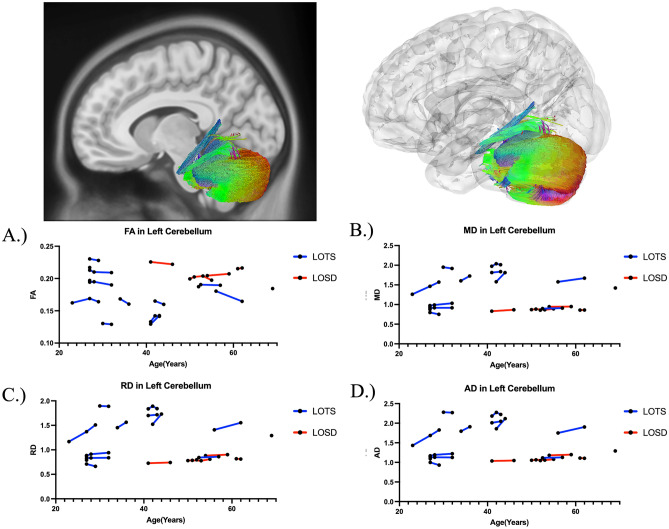
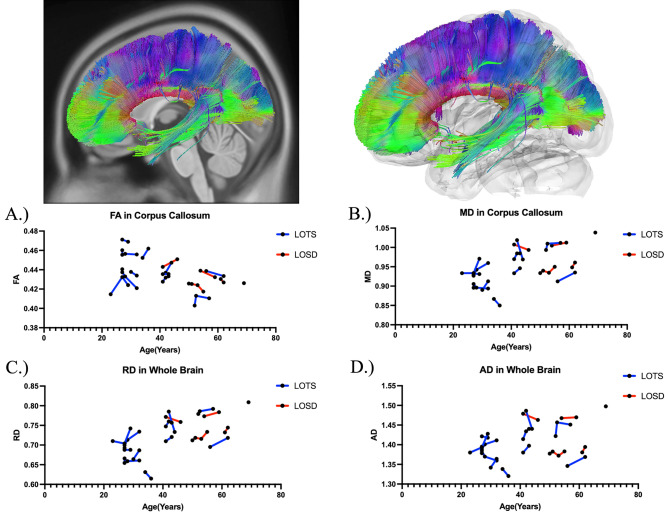
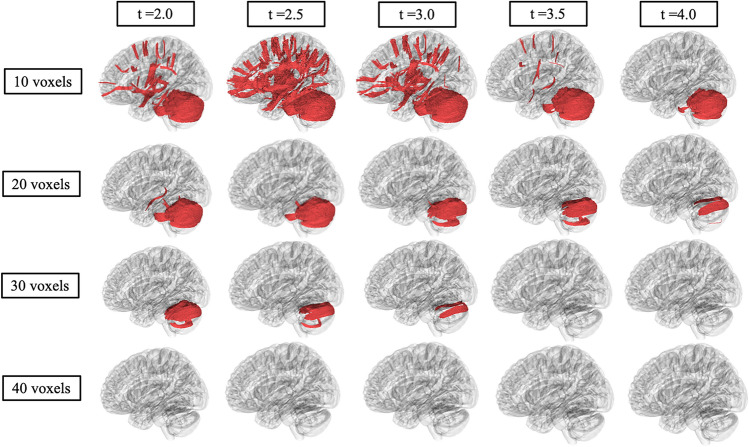
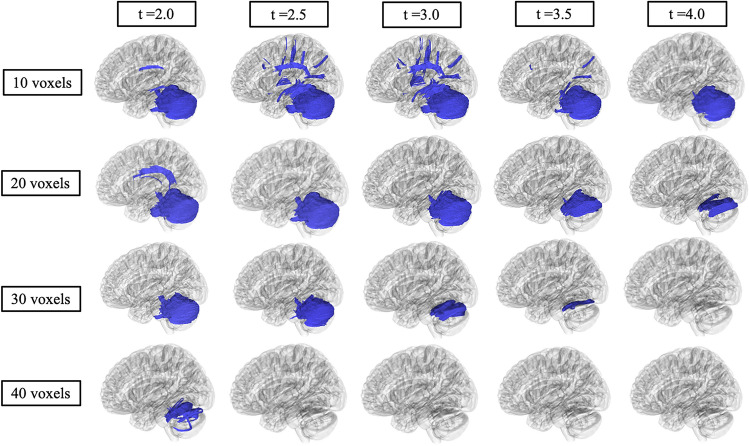
GM2 gangliosidosis is lysosomal storage disorder caused by deficiency of the heterodimeric enzyme β-hexosaminidase A. Tay-Sachs disease is caused by variants in HEXA encoding the α-subunit and Sandhoff disease is caused by variants in HEXB encoding the β-subunit. Due to shared clinical and biochemical findings, the two have been considered indistinguishable. We applied T1-weighted volumetric analysis, diffusion tensor imaging (DTI), and correlational fiber tractography to assess phenotypic differences in these two diseases. 51 T1-weighted and 40 DTI scans from 19 Late-Onset GM2 patients with either late-onset Sandhoff disease (LOSD), or late-onset Tay-Sachs (LOTS) were included and compared to 1033 neurotypical control volumetric MRI scans. LOTS patients had significantly smaller cerebellum volume compared to neurotypical controls (p < 0.0001) and LOSD patients (p < 0.0001). There was no statistical difference for the volume of any structure between LOSD and neurotypical controls. DTI analysis showed LOTS patients had higher mean diffusivity (MD) in the left cerebellum (p = 0.003703), right cerebellum (p = 0.003435), superior cerebellar peduncle (p = 0.007332), and vermis (p = 0.01007) compared to LOSD. LOTS patients had lower fractional anisotropy (FA) in the left cerebellum (p = 0.005537), right cerebellum (p = 0.01905), SCP (p = 0.02844), and vermis (p = 0.02469) when compared to LOSD. Correlational fiber tractography identified fiber tracts in cerebellar pathways with higher FA and lower MD in LOSD patients compared to LOTS patients. Our study shows neurobiologic differences between these two related disorders. To our knowledge, this is the first study using correlational tractography in a lysosomal storage disorder. This result indicates a greater burden of cerebellar pathology in LOTS patients compared with LOSD patients.
Keywords: Correlational tractography; GM2 gangliosidosis; Late-onset Sandhoff; Late-onset Tay–Sachs; Neuroimaging biomarkers.
© 2025. This is a U.S. Government work and not under copyright protection in the US; foreign copyright protection may apply.
Conflict of interest statement
Declarations. Conflicts of interest: The authors declare no conflict of interest. Ethical approval: The NIH Institutional Review Board approved this protocol (02-HG-0107). Informed consent was completed with parents or legal guardians of the patients. Informed consent was completed before participation and all research was completed in accordance with the Declaration of Helsinki.
Figures
Update of
-
Tay-Sachs and Sandhoff Diseases: Diffusion tensor imaging and correlational fiber tractography findings differentiate late-onset GM2 Gangliosidosis.medRxiv [Preprint]. 2024 Dec 16:2024.12.13.24318793. doi: 10.1101/2024.12.13.24318793. medRxiv. 2024. Update in: J Neurol. 2025 Apr 23;272(5):355. doi: 10.1007/s00415-025-13091-3. PMID: 39802759 Free PMC article. Updated. Preprint.
Similar articles
-
Tay-Sachs and Sandhoff Diseases: Diffusion tensor imaging and correlational fiber tractography findings differentiate late-onset GM2 Gangliosidosis.medRxiv [Preprint]. 2024 Dec 16:2024.12.13.24318793. doi: 10.1101/2024.12.13.24318793. medRxiv. 2024. Update in: J Neurol. 2025 Apr 23;272(5):355. doi: 10.1007/s00415-025-13091-3. PMID: 39802759 Free PMC article. Updated. Preprint.
-
Magnetic resonance imaging and spectroscopy in late-onset GM2-gangliosidosis.Mol Genet Metab. 2021 Aug;133(4):386-396. doi: 10.1016/j.ymgme.2021.06.008. Epub 2021 Jun 24. Mol Genet Metab. 2021. PMID: 34226107 Free PMC article.
-
Brainstem Substructure Atrophy in Late-Onset GM2-Gangliosidosis Imaging Using Automated Segmentation.Cerebellum. 2025 Feb 18;24(2):50. doi: 10.1007/s12311-025-01803-4. Cerebellum. 2025. PMID: 39966257 Free PMC article.
-
Clinical and imaging predictors of late-onset GM2 gangliosidosis: A scoping review.Ann Clin Transl Neurol. 2024 Jan;11(1):207-224. doi: 10.1002/acn3.51947. Epub 2023 Nov 27. Ann Clin Transl Neurol. 2024. PMID: 38009419 Free PMC article.
-
[Molecular pathogenesis and therapeutic approach of GM2 gangliosidosis].Yakugaku Zasshi. 2013;133(2):269-74. doi: 10.1248/yakushi.12-00199. Yakugaku Zasshi. 2013. PMID: 23370522 Review. Japanese.
Cited by
-
Advances in Diagnosis, Pathological Mechanisms, Clinical Impact, and Future Therapeutic Perspectives in Tay-Sachs Disease.Neurol Int. 2025 Jun 25;17(7):98. doi: 10.3390/neurolint17070098. Neurol Int. 2025. PMID: 40710901 Free PMC article. Review.
-
Deep Learning Cerebellar Magnetic Resonance Imaging Segmentation in Late-Onset GM2 Gangliosidosis: Implications for Phenotype.medRxiv [Preprint]. 2025 Apr 11:2025.04.08.25325262. doi: 10.1101/2025.04.08.25325262. medRxiv. 2025. PMID: 40297453 Free PMC article. Preprint.
References
-
- Patterson MC (2013) Chapter 174—gangliosidoses. In: Dulac O, Lassonde M, Sarnat HB (eds) Handbook of clinical neurology, vol 113. Elsevier, pp 1707–1708. 10.1016/B978-0-444-59565-2.00039-3 (ISSN 0072-9752, ISBN 9780444595652) - PubMed
-
- Sandhoff R, Sandhoff K (2018) Emerging concepts of ganglioside metabolism†. FEBS Lett 592:3835–3864. 10.1002/1873-3468.13114 - PubMed
-
- Leal AF, Benincore-Flórez E, Solano-Galarza D, Garzón Jaramillo RG, Echeverri-Peña OY, Suarez DA, Alméciga-Díaz CJ, Espejo-Mojica AJ (2020) GM2 gangliosidoses: clinical features, pathophysiological aspects, and current therapies. Int J Mol Sci 21(17):6213. 10.3390/ijms21176213. (PMID:32867370; PMCID:PMC7503724) - PMC - PubMed
-
- Ramani PK, Parayil Sankaran B (2024) Tay–Sachs disease. StatPearls. StatPearls Publishing, Treasure Island ([Updated 2023 Jan 25]) - PubMed
MeSH terms
Grants and funding
LinkOut - more resources
Full Text Sources
Medical
Miscellaneous
