

Mathematical and Dynamic Modeling of the Anatomical Localization of the Insula in the Brain
- PMID: 40266454
- PMCID: PMC12018515
- DOI: 10.1007/s12021-025-09727-4
Mathematical and Dynamic Modeling of the Anatomical Localization of the Insula in the Brain
Abstract
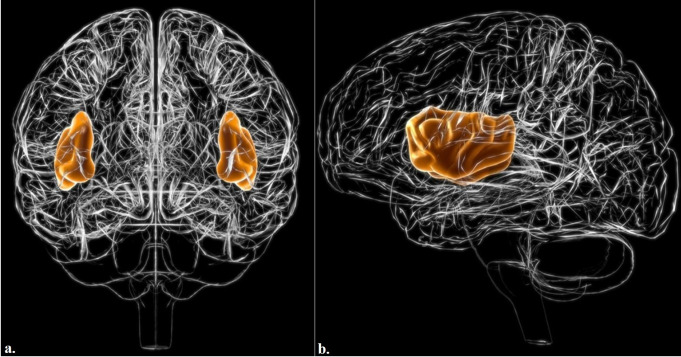
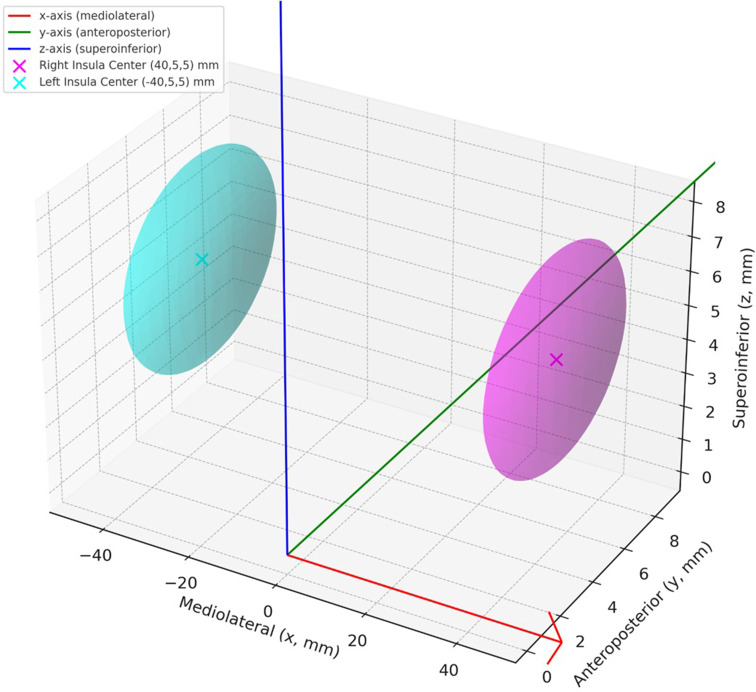
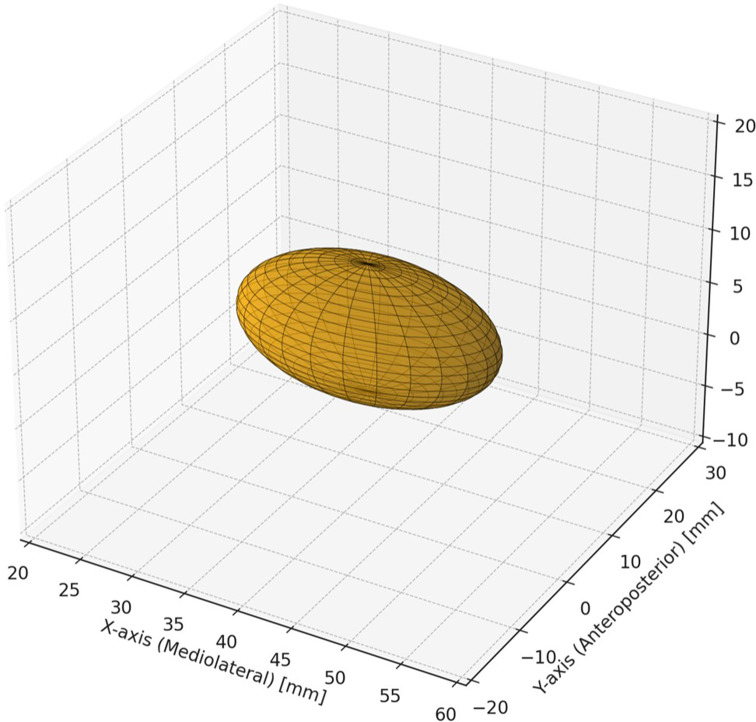
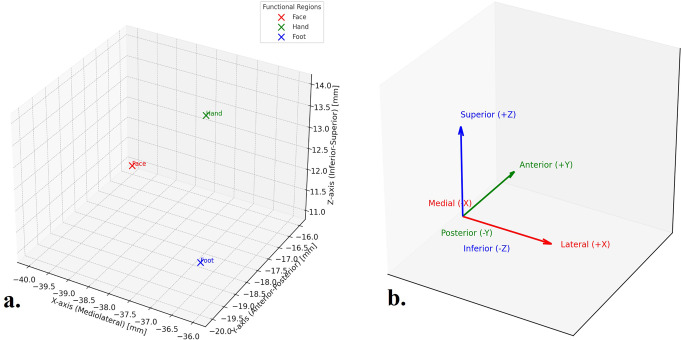
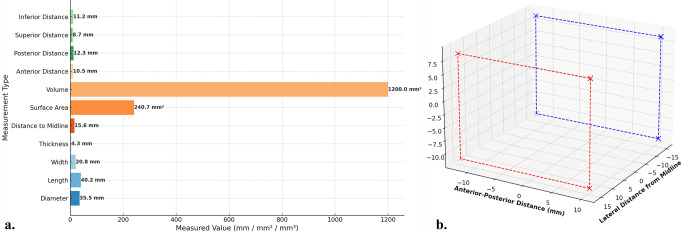
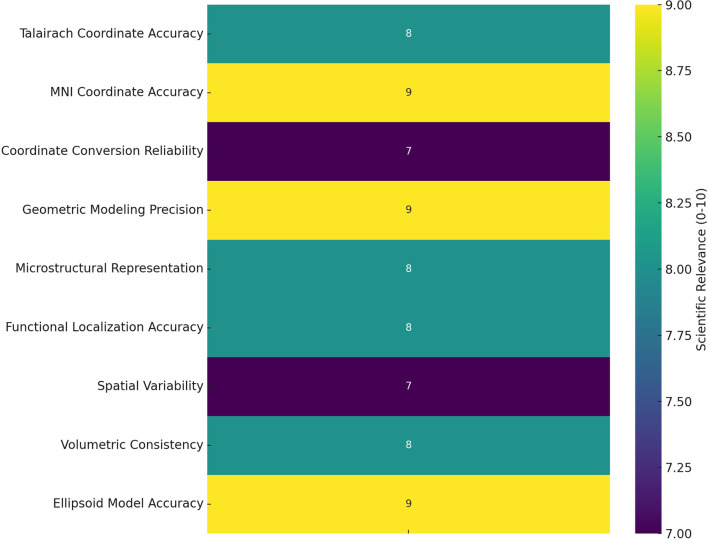
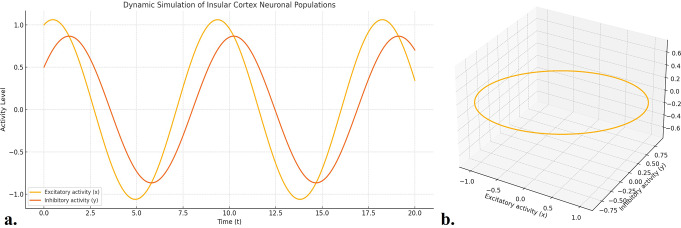
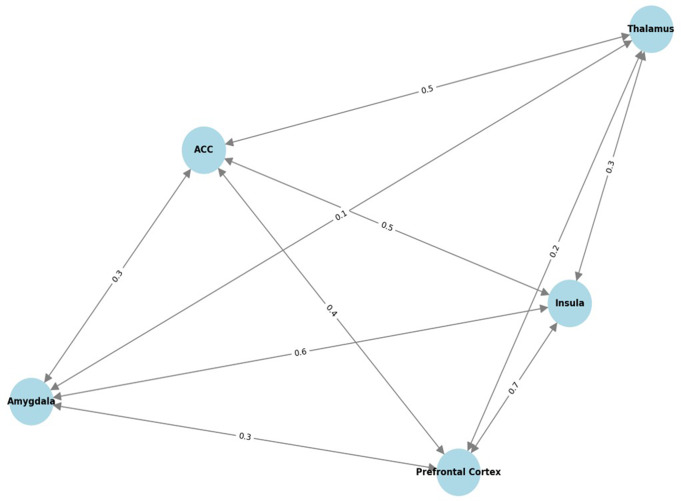
The insula, a deeply situated cortical structure beneath the Sylvian sulcus, plays a critical role in sensory integration, emotion regulation, and cognitive control in the brain. Although several studies have described its anatomical and functional characteristics, mathematical models that quantitatively represent the insula's complex structure and connectivity are lacking. This study aimed to develop a mathematical model to represent the anatomical localization and functional organization of the insula, drawing on current neuroimaging findings and established anatomical data. A three-dimensional (3D) ellipsoid model was constructed to mathematically represent the anatomical boundaries of the insula using Montreal Neurological Institute (MNI) coordinate data. This geometric model adapts the ellipsoid equation to reflect the spatial configuration of the insula and is primarily based on cytoarchitectonic mapping and anatomical literature. Relevant findings from prior imaging research, particularly those reporting microstructural variations across insular subdivisions, were reviewed and conceptually integrated to guide the model's structural assumptions and interpretation of potential applications. The ellipsoid-based 3D model accurately represented the anatomical dimensions and spatial localization of the right insula, centered at the MNI coordinates (40, 5, 5 mm), and matched well with the known volumetric data. Functional regions (face, hand, and foot) were successfully plotted within the model, and statistical analysis confirmed significant differences along the anteroposterior and superoinferior axes (p < 0.01 and p < 0.05, respectively). Dynamic simulations revealed oscillatory patterns of excitatory and inhibitory neural activity, consistent with established insular neurophysiology. Additionally, connectivity modeling demonstrated strong bidirectional interactions between the insula and key regions, such as the prefrontal cortex and anterior cingulate cortex (ACC), reflecting its integrative role in brain networks. This study presents a scientifically validated mathematical model that captures the anatomical structure, functional subdivisions, and dynamic connectivity patterns of the insula. By integrating anatomical data with computational simulations, this model provides a foundation for future research in neuroimaging, functional mapping, and clinical applications involving insula-related disorders.
Keywords: Anatomical localization; Functional connectivity; Insula; MNI coordinates; Mathematical modeling.
© 2025. The Author(s).
Conflict of interest statement
Declarations. Ethical Approval: We confirm that we have read the journal’s position on issues involved in ethical publication and affirm that this report is consistent with those guidelines. Informed Consent: Not applicable. Statement Regarding Research Involving Human Participants And/or Animals: Not applicable. Consent To Participate: Not applicable. Consent To Publish: Not applicable. Competing Interests: The authors declare no competing interests.
Figures
Similar articles
-
Integrated 3D Modeling and Functional Simulation of the Human Amygdala: A Novel Anatomical and Computational Analyses.Neuroinformatics. 2025 Aug 7;23(3):41. doi: 10.1007/s12021-025-09743-4. Neuroinformatics. 2025. PMID: 40772991
-
Morphological analysis and functional connectivity of the insular in patients with dysphagia after cerebral infarction based on resting-state fMRI.BMC Neurol. 2025 Jul 30;25(1):307. doi: 10.1186/s12883-025-04322-1. BMC Neurol. 2025. PMID: 40739609 Free PMC article.
-
Short-Term Memory Impairment.2024 Jun 8. In: StatPearls [Internet]. Treasure Island (FL): StatPearls Publishing; 2025 Jan–. 2024 Jun 8. In: StatPearls [Internet]. Treasure Island (FL): StatPearls Publishing; 2025 Jan–. PMID: 31424720 Free Books & Documents.
-
Cost-effectiveness of using prognostic information to select women with breast cancer for adjuvant systemic therapy.Health Technol Assess. 2006 Sep;10(34):iii-iv, ix-xi, 1-204. doi: 10.3310/hta10340. Health Technol Assess. 2006. PMID: 16959170
-
Health professionals' experience of teamwork education in acute hospital settings: a systematic review of qualitative literature.JBI Database System Rev Implement Rep. 2016 Apr;14(4):96-137. doi: 10.11124/JBISRIR-2016-1843. JBI Database System Rev Implement Rep. 2016. PMID: 27532314
Cited by
-
Anatomical and clinical relevance of Kager's triangle: diagnostic approaches and therapeutic implications for related pathologies.J Orthop Surg Res. 2025 Jul 19;20(1):682. doi: 10.1186/s13018-025-06081-8. J Orthop Surg Res. 2025. PMID: 40684192 Free PMC article. Review.
-
Integrated 3D Modeling and Functional Simulation of the Human Amygdala: A Novel Anatomical and Computational Analyses.Neuroinformatics. 2025 Aug 7;23(3):41. doi: 10.1007/s12021-025-09743-4. Neuroinformatics. 2025. PMID: 40772991
References
-
- Anderson, K., et al. (2009). Morphology of supragranular pyramidal neurons in the human insular cortex: A quantitative golgi study. Cerebral Cortex, 19(9), 2131–2144. - PubMed
-
- Brett, M. (2001). The Talairach atlas was used with the MNI template. Neuroimage, 13(6).
-
- Brooks, J. C. W., et al. (2005). Somatotopic organization of the human Insula to painful heat studied with high-resolution functional imaging. Neuroimage, 27(1), 201–209. - PubMed
Publication types
MeSH terms
LinkOut - more resources
Full Text Sources
