. 2025 Apr 1;66(4):68.
doi: 10.1167/iovs.66.4.68.

Macrophage-Hosted Porphyromonas gingivalis Is a Risk Factor for Cataract Development

Affiliations

Macrophage-Hosted Porphyromonas gingivalis Is a Risk Factor for Cataract Development

Dongzhe Zhang et al. Invest Ophthalmol Vis Sci. .

Abstract

Purpose: We studied the regulatory association of Porphyromonas gingivalis (PG) and cataracts.

Methods: PCR and FISH assays were used for detecting PG 16s ribosomal RNA genome, Immunofluorescence was for expression of RpgA in anterior capsular epithelium and fibrosis markers in anterior subcapsular cataract (ASC) model. Flow cytometry was for reactive oxygen species and apoptosis. RNA deep sequencing is for differential gene expression analysis.

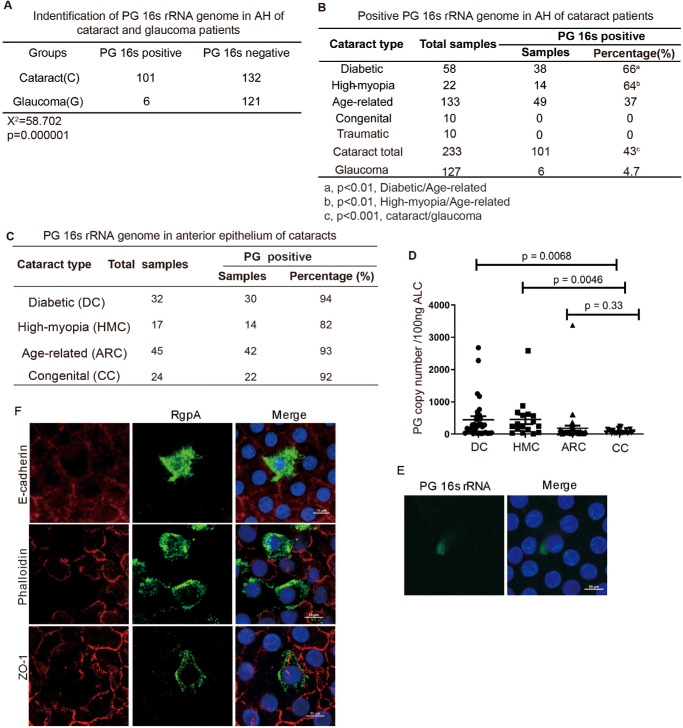
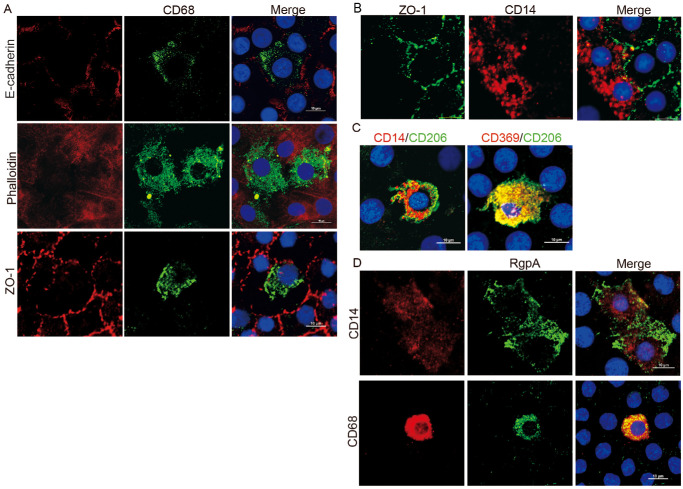
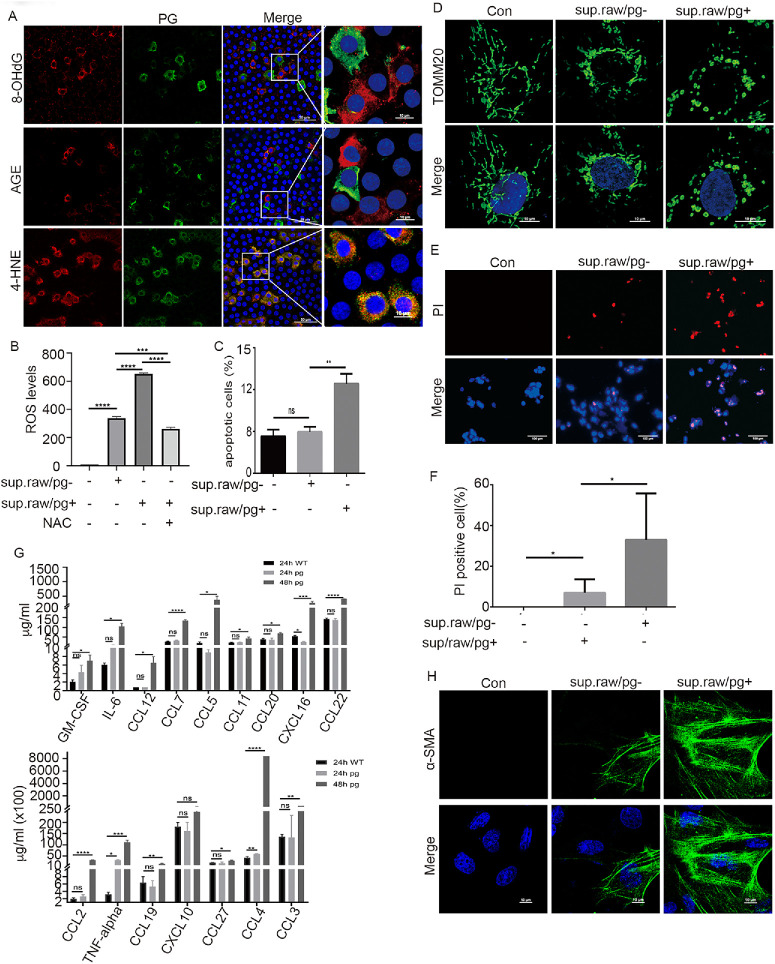
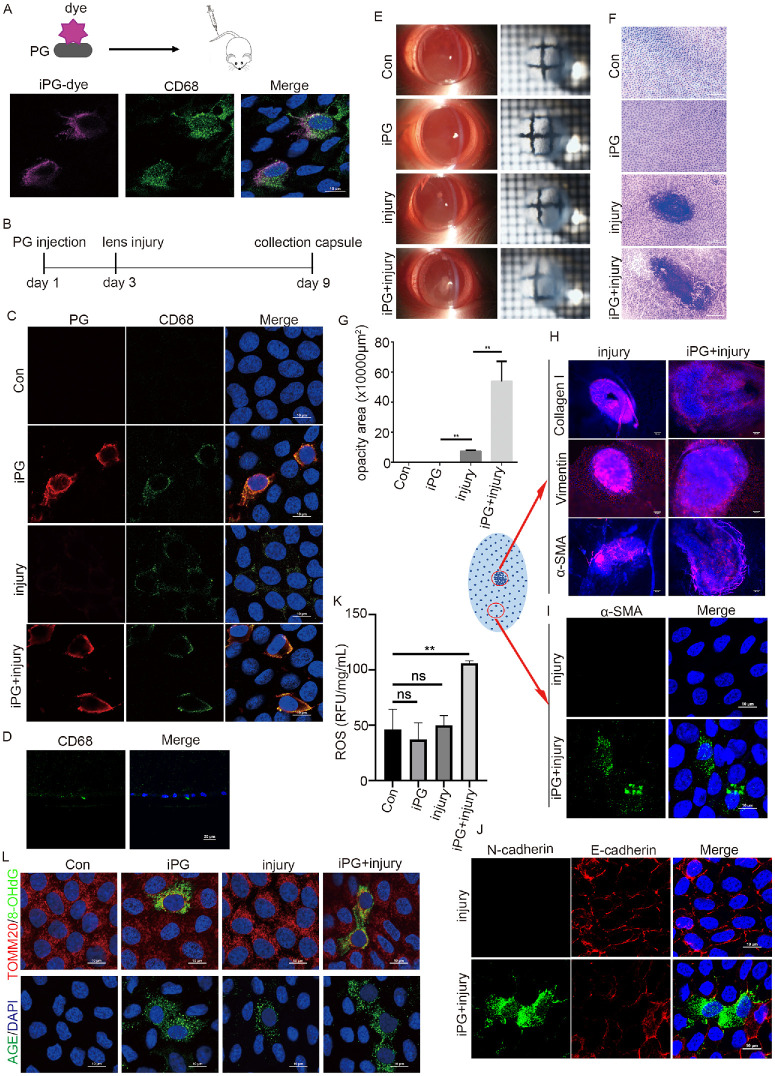
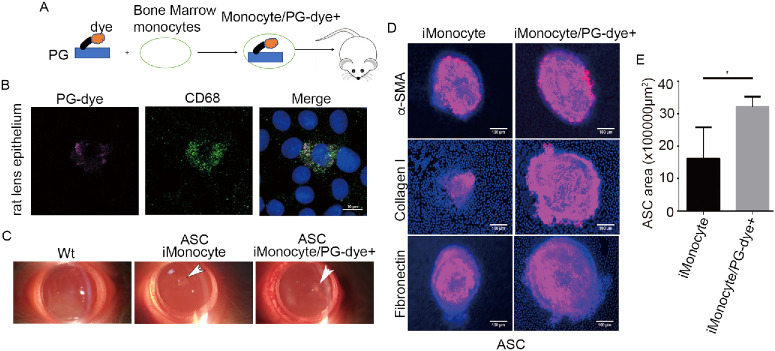
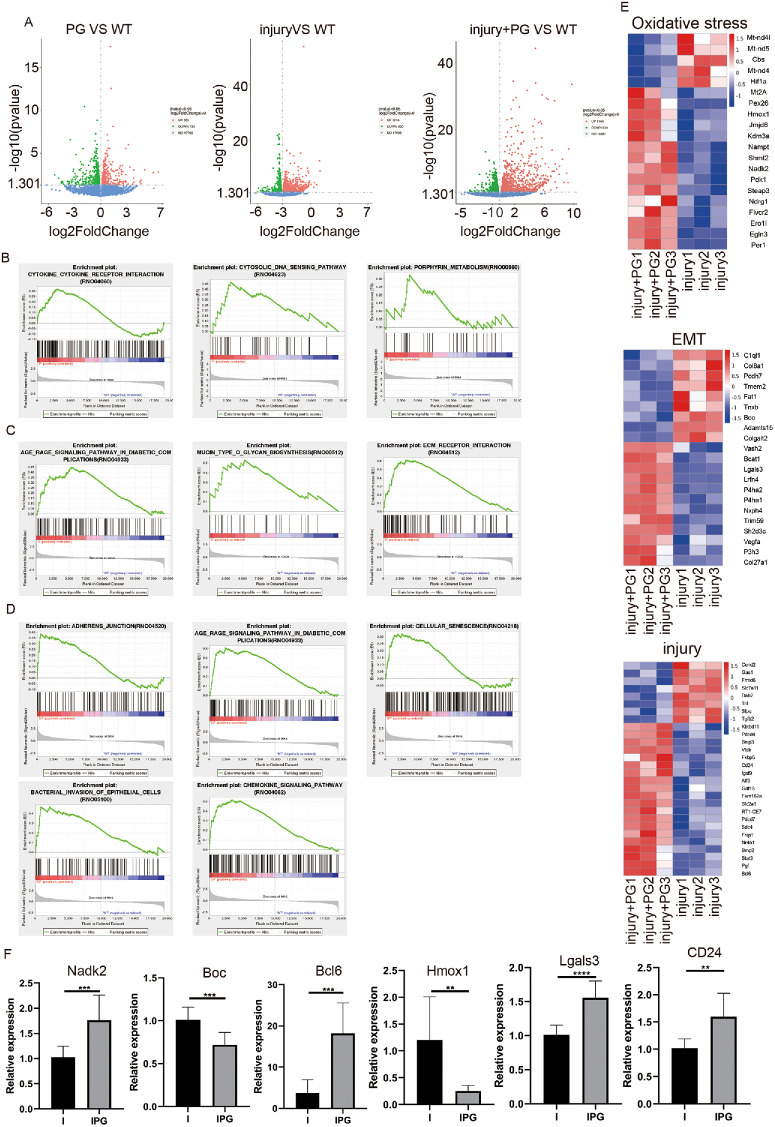
Results: PG's 16s ribosomal RNA gene is positively in 43.3% (101/233 cases) of aqueous humor (AH) samples of patients with cataracts, which differs from 4.7% (6/127) of PG-positive AH in patients with glaucoma. Diabetic and high myopia cataracts increase PG-positive AH compared with age-related cataracts. No PG is observed in AH of congenital cataracts. PG is positive in 82% to 94% of the cataractous anterior capsule tissues from high myopia and age-related, congenital, and diabetic cataracts. The PG-positive cells in the cataractous anterior capsular epithelium are CD68+/CD14+ macrophages, but not anterior epithelial cells. In rat ASC models, PG injected via the tail vein or PG-carried bone marrow monocytes can migrate into the equatorial lens epithelium in form of PG-positive macrophages, which promote ASC progression with upregulation of collagen, fibronectin and α smooth muscle actin (α-SMA) expression, and increase 8-OHdG levels and α-SMA expression in the surrounding lens epithelial cells. Kyoto Encyclopedia of Genes and Genomes and Gene Ontology analysis of the RNA sequencing dataset of ASC tissues shows that signaling pathways related to epithelial-mesenchymal transition, oxidative stress, and cell death are up-regulated in PG + ASC compared with that in ASC alone. Co-culture of supernatants of Raw264.7/PG+ cells with rat primary lens epithelial cells increases the 8-OHdG levels, mitochondrial fission, apoptosis, and expression of α-SMA.

Conclusions: Chronic infection with PG can access the lens epithelium via macrophages during stress conditions, which promotes cataract development by possibly elevating oxidative stress, apoptosis, and epithelial-mesenchymal transition in lens tissues. PG infection is a novel a risk factor for cataract development.


Conflict of interest statement

Disclosure: D. Zhang, None; J. Qu, None; C. Ke, None; X. Kong, None; M. Liu, None; I. Nawaz Khan, None; S. Huang, None; H. Tian, None; T. Xie, None; K. Qiu, None; J. Li, None; M. Wang, None; H. Li, None; F. Yuan, None; W. Guo, None; M. Cao, None; J. Zhang, None; K. Zhu, None; J. Luo, None; F. Zhang, None; X. Cui, None; H. Mu, None; Y. Hu, None

Figures

Figure 1.
Figure 1.
PG infection is closely correlated to cataract incidence. (A) PCR identification of the PG 16s rRNA genomic DNA in the AH of cataracts and glaucoma. The χ2 test was used for statistical analysis. (B) PCR test of the PG 16srRNA genome in AH of different types of cataracts including diabetic, high myopia, age-related, congenital, and traumatic cataracts. χ2 test was used for statistical analysis. (A) Comparison between DC and ARC. (B) Comparison between ARC and HMC. (c) Comparison between cataracts (total) and glaucoma. (C) Percentage of the PGs 16s rRNA genome positive in PCR in the anterior capsular tissues of DCs, HMCs, ARC, and congenital cataracts. (D) Copy number of the PG genome in the anterior capsule of patients with cataracts was detected by TaqMan qPCR. The data shown represent mean ± SD, one-way ANOVA was used for statistical analysis, n = 118. P < 0.01 was considered statistical significance. (E) FISH assay to detect the PGs 16s rRNA (green) in the anterior capsule epithelium of patients with cataracts; cells nuclear was stained by DAPI. Scale bar, 10 µm. (F) Immunofluorescence staining in whole mount for the expression RgpA and E-cadherin; RgpA and ZO-1; RgpA and phalloidin in the anterior capsular epithelium of cataracts. Nuclear was stained with DAPI. Scale bar, 10 µm.
Figure 2.
Figure 2.
PG and macrophage are colocalized in the anterior capsular tissue of patients with cataracts. (AC) Immunofluorescence staining in whole mount the anterior capsular cataractous epithelium with antibodies against CD68 and E-cadherin, CD68, and ZO-1 or CD68/phalloidin (A), CD14 vs. ZO-1 (B) or CD14 vs. CD206, CD369 vs. CD206 (C). The nucleus was stained with DAPI. Scale bar, 10 µm. (D) The immunofluorescence staining in whole mount the anterior capsular cataractous epithelium with antibodies against RgpA and CD14 (top) or RpgA and CD68 (bottom). Scale bar, 10 µm. con, control.
Figure 3.
Figure 3.
Induction of oxidative stress, apoptosis, and EMT of lens epithelial cells by PG-infected macrophages. (A) Whole mount immunofluorescence staining cataractous anterior capsular epithelium with antibody against RgpA together with 8-OHdG, AGE and 4-hydroxynonenal (4-HNE). The nuclear was stained by DAPI. Scale bar, 10 µm. (B) Flow cytometry measures the ROS level in primary rat lens epithelial cells that were treated with the supernatants of Raw264.7/PG- or Raw264.7/PG+ cells. Data are mean ± SD, n = 3. ***P < 0.001, ****P < 0.0001. The ROS inhibitor NAC was used as a control (con). (C) Flow cytometry measuring the apoptosis of primary rat lens epithelial cells that were treated with supernatants of Raw264.7/PG or Raw264.7/PG+ cells. Data are mean ± SD, n = 3. *P < 0.05. (D) Immunofluorescent staining the mitochondria with anti-TOMM20 antibody in primary rat lens epithelial cells that were treated in same way as did in (C). Scale bar, 10 µm. (E) Immunostaining primary rat lens epithelial cells with PI and Hoechst 33433 that were treated in same way as in (C). Scale bar, 100 µm. (F) Quantitation of PI-positive cells vs. the Hoechst-33433–positive cells in (E). Data are mean ± SD, n = 5. *P < 0.05. (G) Luminex multiplex analysis of the expression of chemokines and cytokines in the supernatants of Raw264.7/PG vs. Raw264.7/PG+ cells. Data are mean ± SD, n = 3. *P < 0.05, **P < 0.01, ***P < 0.001, ****P < 0.0001. (H) Immunofluorescent staining the expression of α-SMA in the primary rat lens epithelial cells that were treated in same way as in (C). The nuclei were stained with DAPI. Scale bar, 10 µm.
Figure 4.
Figure 4.
PG infection enhances traumatic anterior capsular cataracts in rats. (A) Immunofluorescence staining CD68-macrophage vs. PG dye in the anterior epithelium of Wistar rats that received a tail vein injection of PG dye. The nucleus was stained with DAPI. Scale bar, 10 µm. (Top) Schematic map of PG labeled by CellVue Claret (PG dye) and PG dye tail vein injection. (B) Schematic map of tail vein injection of PG into ASC rat models. (C) Immunostaining with antibodies against PG and CD68 in the rat lens capsules of the WT group, PG injected group (iPG), lens injury group (injury), and PG injected plus injury group (iPG + injury). The nucleus was stained with DAPI. Scale bar, 10 µm. (D) Immunohistochemistry staining the cryosection of rat lens of iPG + injury group with anti-CD68. The nucleus was stained with DAPI. Scale bar, 20 µm. (E) The images of slit-lamp microscopy and grind transparency of rat lens that were treated in (C). (F) Hematoxylin and eosin staining capsular anterior epithelium of rats that were treated in (C). Scale bar, 200 µm. (G) Quantitation of the ASC area in (F). Data are mean ± SD, n = 6. **P < 0.01. (H and I) Immunofluorescent staining in whole mount expression of collagen I, vimentin, and α-SMA in the ASC tissues (H) or in the peripheral lens epithelium close to ASC tissues of rat lens of the injury group or iPG + injury group, the nuclei were stained with DAPI. Scale bar, 50 µm. (J) Immunofluorescent staining in whole mount the expression of N-cadherin and E-cadherin in the peripheral lens epithelium surrounding ASC tissues of lens from injury group or iPG + injury group, the nuclei were stained with DAPI, Scale bar, 10 µm. (K) Enzyme labeling measures the ROS level in the rat lens of WT group, iPG group, injury group, and iPG + injury group. Data are mean ± SD, n = 3. **P < 0.01. (L) Immunofluorescence staining in whole mount the rat lens capsules of the WT group, iPG group, injury group, and iPG + injury group with antibodies against TOMM20 (red) and 8-OHdG (green) (top) or AGE alone (bottom). The nuclei were stained by DAPI (blue). Scale bar, 10 µm. con, control; ns, not significant.
Figure 5.
Figure 5.
Transplantation of PG monocytes promote cataract progression in rat ASC model. (A) The schematic map of tail vein injection of BMMs that were pre-infected with PG dye. (B) Whole mount immunofluorescence staining of transplanted monocyte/PGdye+ cells in the lens anterior capsular epithelium of rats with anti-CD68 antibody. The nuclei were stained with DAPI, Scale bar, 10 µm. (C) Slit lamp microscopy observed ASC of rats that were received allogeneic monocytes (immunocytes) or immunocyte/PGdye+. (D) Immunofluorescent staining in whole mount the expression of collagen-1, α-SMA, and fibronectin in ASC tissues from rats treated in (C). (E) The quantitation of ASC area of rats in (D) in image J. Data are mean ± SD, n = 20. *P < 0.05.
Figure 6.
Figure 6.
Transcriptome profile analysis of gene expression in rat anterior capsular tissues. (A) Volcano maps and Venn diagram analysis of differentially expressed genes in the anterior capsular tissues of rats from the iPG group vs. WT group; injury group vs. WT group, or iPG + injury group vs. WT group. (B) GSEA analysis of KEGG enrichment in lens of iPG group vs. WT. (C) GSEA analysis of KEGG enrichment in lens of injury group vs. WT. (D) GSEA analysis of KEGG enrichment in lens of iPG + injury group vs. WT. (E) Heat maps exhibition of differentially expressed genes of oxidative stress, injury, cellular matrix, inflammation, differentiation, and EMT in lens anterior capsular tissues of lens of the injury group vs. the iPG + injury group. Three samples of each group were applied for analysis. (F) qPCR analysis of differentially expressed genes in oxidative stress, injury, cellular matrix, inflammation, differentiation, and EMT in (E). Data are mean ± SD, n = 3. *P < 0.05, **P < 0.01, ***P < 0.001.

Similar articles

References

    1. Asbell PA, Dualan I, Mindel J, Brocks D, Ahmad M, Epstein S.. Age-related cataract. Lancet. 2005; 365: 599–609. - PubMed
    1. Liu YC, Wilkins M, Kim T, Malyugin B, Mehta JS.. Cataracts. Lancet. 2017; 390: 600–612. - PubMed
    1. Ang MJ, Afshari NA.. Cataract and systemic disease: a review. Clin Exp Ophthalmol. 2021; 49: 118–127. - PubMed
    1. Rewri P, Sharma M, Vats DP, Singhal A.. Seroprevalence, risk associations, and cost analysis of screening for viral infections among patients of cataract surgery. Indian J Ophthalmol. 2018; 66: 394–399. - PMC - PubMed
    1. York A. P. gingivalis drives carcinoma progression. Nat Rev Microbiol. 2020; 18: 674. - PubMed

MeSH terms

Substances