

Evaluating the Effect of Dietary Protein-Energy Ratios on Yak Intestinal Microbiota Using High-Throughput 16S rRNA Gene Sequencing
- PMID: 40266935
- PMCID: PMC11945990
- DOI: 10.3390/vetsci12030208
Evaluating the Effect of Dietary Protein-Energy Ratios on Yak Intestinal Microbiota Using High-Throughput 16S rRNA Gene Sequencing
Abstract
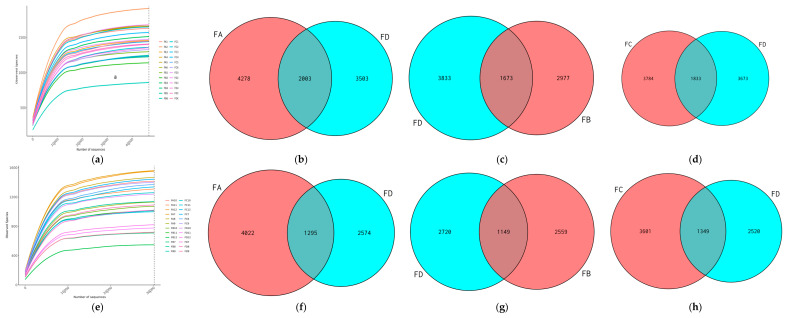
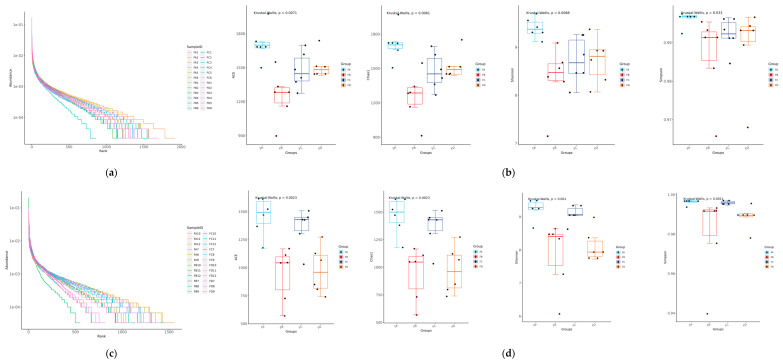
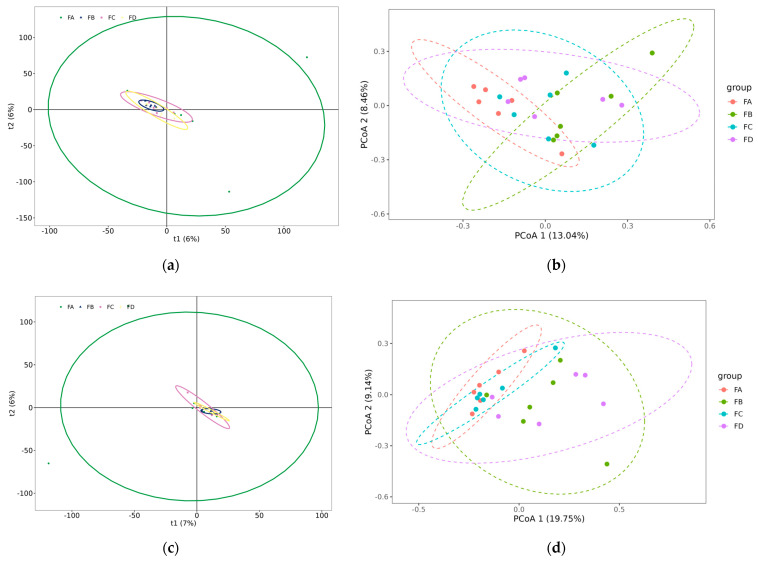
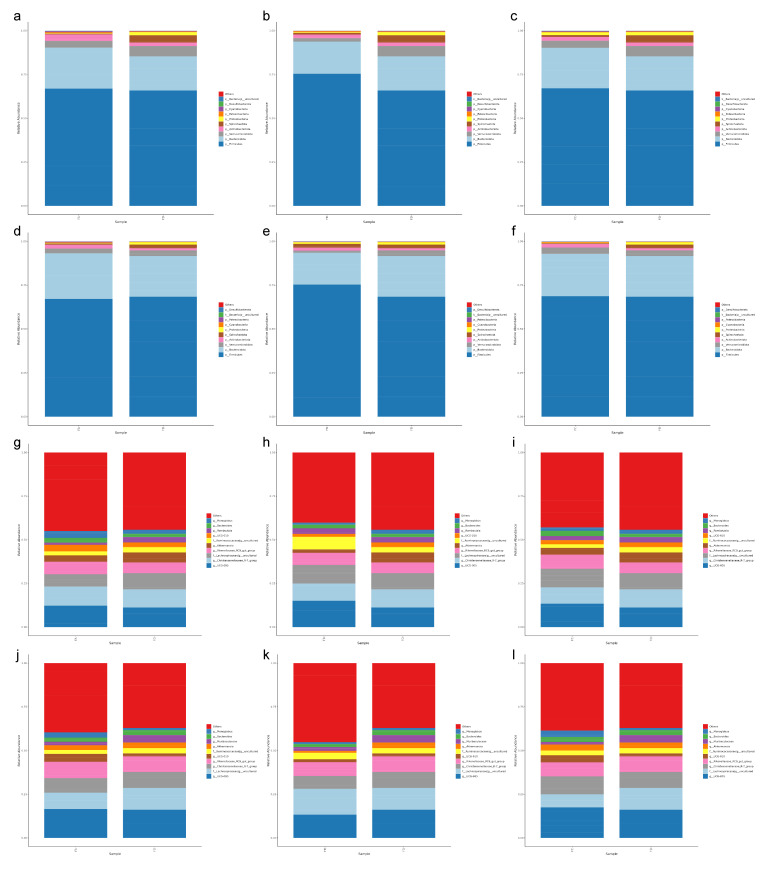
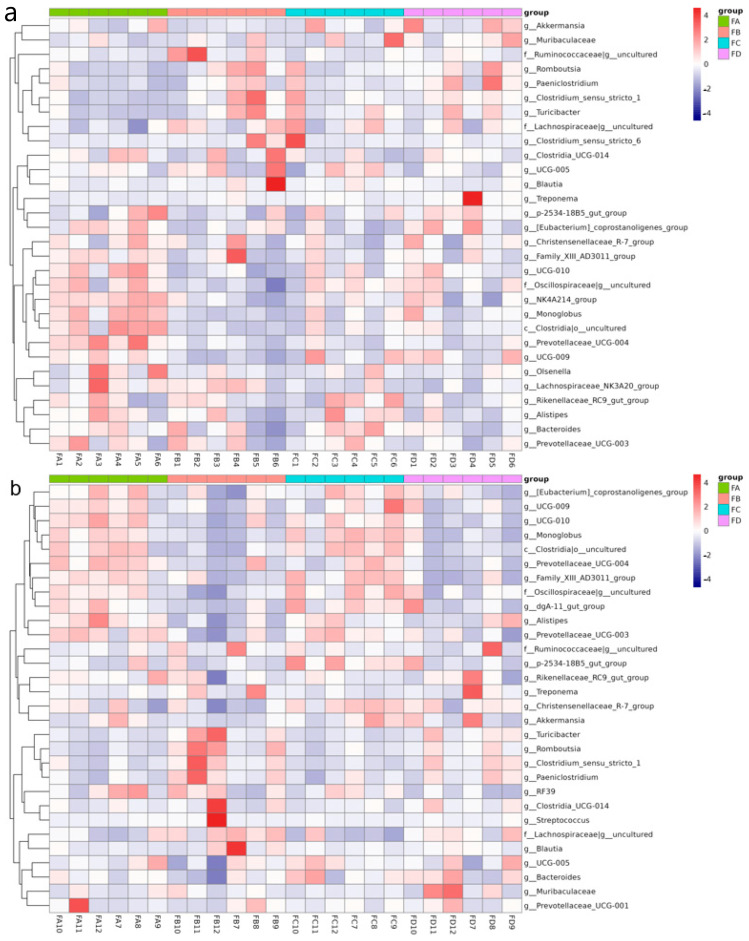
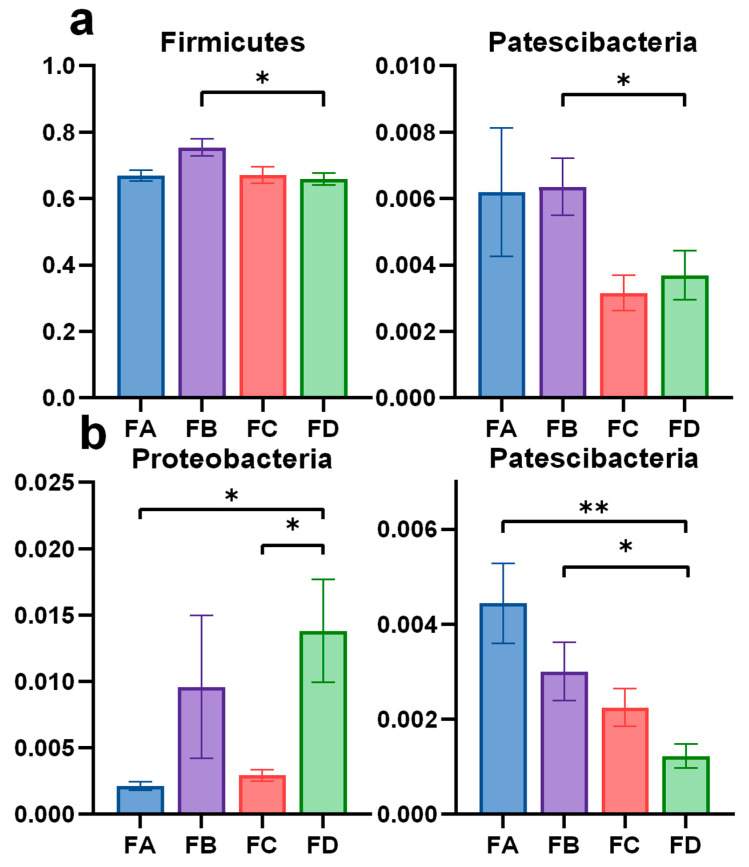
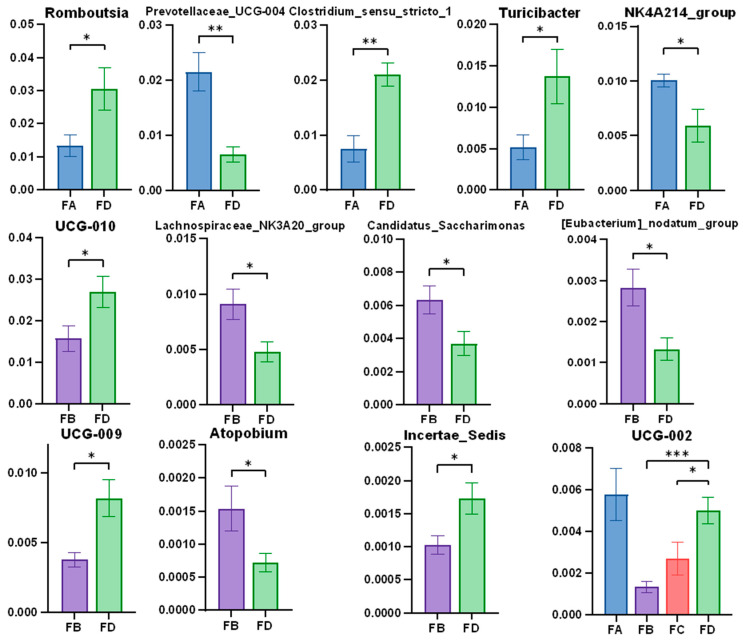
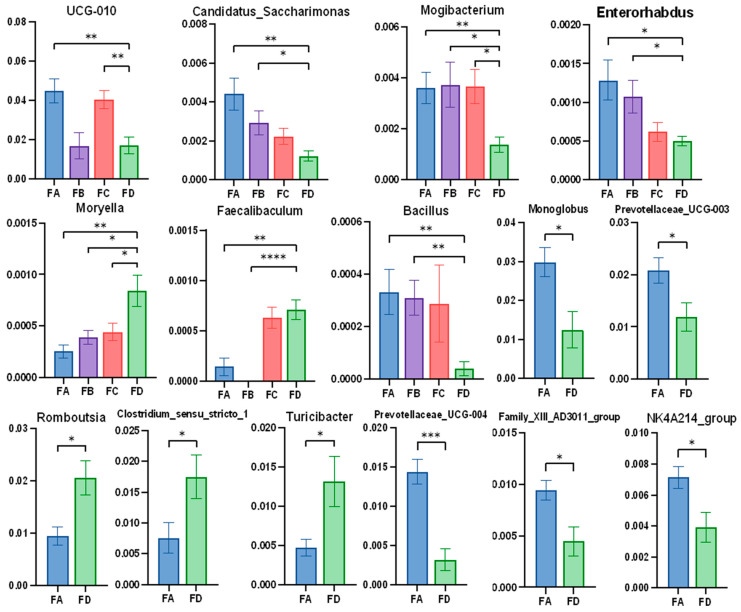
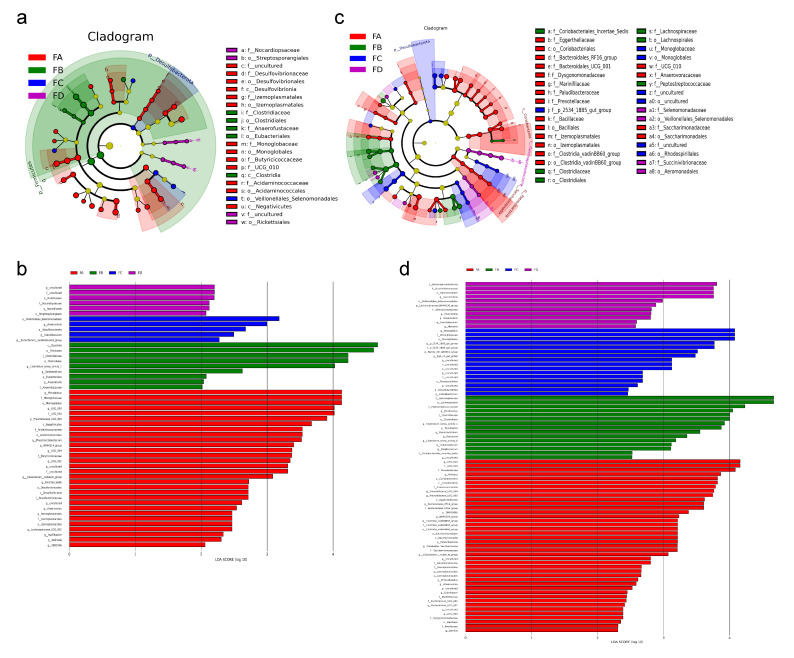
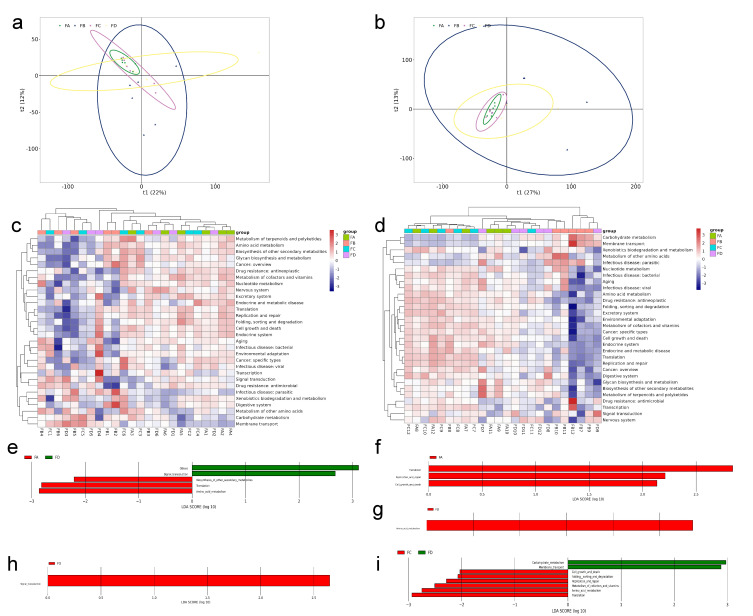
This study investigated the impact of varying dietary protein-energy ratios on the intestinal microbiota composition in postpartum weaned female yak. For this study, forty yaks were divided into four groups and provided with different dietary treatments (group FA: high-energy high-protein, FB: high-energy low-protein, FC: low-energy high-protein, and FD: control group, provided with 48% alfalfa hay, 48% oat grass, and 4% premix) to investigate the variations in microflora profiles and metabolic responses. Rectal fecal samples (n = 24 × 2) were collected at day 15 and 30, from all four groups, and total DNA was extracted to estimate microbial heterogeneity and community structures by 16S rRNA sequencing focusing V3-V4 regions, using the Illumina Nova Seq 6000 platform. The results revealed a total of 5,669,645 raw data sequences (3,189,115 and 2,480,530 from day 15 and day 30, respectively). Results showed that groups FA and FB had enhanced protein metabolism and microbial diversity, which was marked by a significant increase (p < 0.05) in abundance of Ruminococcus. Conversely, the FD group showed a low level of microbial diversity with a significant (p < 0.05) predominance of Clostridium and Proteobacteria, indicating microbial dysbiosis and metabolic stress. It was concluded that imbalanced diets (groups FC and FD) upregulated the stress-related pathways with no favorable microbial shifts, whereas, dietary treatments in group FA and FB significantly (p < 0.05) supported the pathways involved in amino acids and carbohydrate metabolism and beneficially shifted the gut microbiota. These findings emphasize the importance of postpartum supplementation with appropriate proportions of protein and energy feed to promote optimal microbial health and metabolic functioning, particularly for yaks inhabiting high-altitude regions, which is a challenging environment.
Keywords: 16S rRNA sequencing; microbial diversity; protein–energy ratio; yak intestinal microbiota.
Conflict of interest statement
The authors declare no conflicts of interest.
Figures
Similar articles
-
Role of dietary energy and protein proportions on serum inflammatory factors, antioxidant capacity, and rumen microbiota in postpartum weaned female yak.BMC Microbiol. 2025 Jun 6;25(1):354. doi: 10.1186/s12866-025-04050-z. BMC Microbiol. 2025. PMID: 40481426 Free PMC article.
-
Effect of alfalfa hay and starter feed supplementation on caecal microbiota and fermentation, growth, and health of yak calves.Animal. 2021 Mar;15(3):100019. doi: 10.1016/j.animal.2020.100019. Epub 2021 Feb 17. Animal. 2021. PMID: 33610512
-
Fecal metabonomics combined with 16S rRNA gene sequencing to analyze the changes of gut microbiota in rats with kidney-yang deficiency syndrome and the intervention effect of You-gui pill.J Ethnopharmacol. 2019 Nov 15;244:112139. doi: 10.1016/j.jep.2019.112139. Epub 2019 Aug 8. J Ethnopharmacol. 2019. PMID: 31401318
-
Characterization of gut microbiota dysbiosis of diarrheic adult yaks through 16S rRNA gene sequences.Front Vet Sci. 2022 Sep 9;9:946906. doi: 10.3389/fvets.2022.946906. eCollection 2022. Front Vet Sci. 2022. PMID: 36157193 Free PMC article.
-
Yak Gut Microbiota: A Systematic Review and Meta-Analysis.Front Vet Sci. 2022 Jun 28;9:889594. doi: 10.3389/fvets.2022.889594. eCollection 2022. Front Vet Sci. 2022. PMID: 35836500 Free PMC article.
Cited by
-
Lactobacillus Supplementation Modulates Rumen Microbiota and Metabolism in Yaks Under Fattening Feeding Conditions: A Comprehensive Multi-Omics Analysis.Animals (Basel). 2025 Jun 6;15(12):1681. doi: 10.3390/ani15121681. Animals (Basel). 2025. PMID: 40564234 Free PMC article.
-
Angelicae Pubescentis Radix Remitted Intestine Damage in Mice Induced by Escherichia coli via Mediating Antioxidant Defense, Inflammatory Mediators, and Restoring Gut Microbiota.Vet Sci. 2025 Apr 10;12(4):354. doi: 10.3390/vetsci12040354. Vet Sci. 2025. PMID: 40284856 Free PMC article.
References
-
- Lv L.-X., Jiang H.-Y., Yan R., Li L. Interactions Between Gut Microbiota and Hosts and Their Role in Infectious Diseases. Infect. Microbes Dis. 2019;1:3–9. doi: 10.1097/IM9.0000000000000001. - DOI
-
- Meng A., Zhang X., Pubu P., Ali M., Wang J., Xu C., Almutairi M.H., Li K. Protective Effect of Lentinan against LPS-Induced Injury in Mice Via Influencing Antioxidant Enzyme Activity, Inflammatory Pathways and Gut Microbiota. Pak. Vet. J. 2024;44:647–665. doi: 10.1097/QCO.0b013e3283638104. - DOI
Grants and funding
LinkOut - more resources
Full Text Sources
