. 2025 Apr 25;11(17):eadv4410.
doi: 10.1126/sciadv.adv4410. Epub 2025 Apr 23.

Conformational plasticity of mitochondrial VDAC2 controls the kinetics of its interaction with cytosolic proteins

Affiliations

Conformational plasticity of mitochondrial VDAC2 controls the kinetics of its interaction with cytosolic proteins

William M Rosencrans et al. Sci Adv. .

Abstract

The voltage-dependent anion channel (VDAC) is a key conduit of the mitochondrial outer membrane for water-soluble metabolites and ions. Among the three mammalian isoforms, VDAC2 is unique because of its embryonic lethality upon knockout. Using single-molecule electrophysiology, we investigate the biophysical properties that distinguish VDAC2 from VDAC1 and VDAC3. Unlike the latter, VDAC2 exhibits dynamic switching between multiple high-conductance, anion-selective substates. Using α-synuclein (αSyn)-a known VDAC1 cytosolic regulator-we found that higher-conductance substates correlate with increased on-rates of αSyn-VDAC2 interaction but shorter blockage times, maintaining a consistent equilibrium constant across all substates. This suggests that αSyn detects VDAC2's dynamic structural variations before final binding. We explored the dependence of VDAC2's unique amino-terminal extension and cysteines on substate behavior, finding that both structural elements modulate substate occurrence. The discovered conformational flexibility enables VDAC2 recognition by diverse binding partners, explaining its critical physiological role via dynamical adaptation to mitochondrial metabolic conditions.


Figures

Fig. 1.
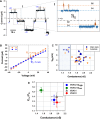
Fig. 1.. VDAC2 stochastically switches between different “open” conductance substates.
(A) Representative record of the current through a single VDAC2 WT channel reconstituted into the PLM formed from a 2PG/PC/PE lipid mixture in 1 M KCl (pH 7.4) at the increasing applied voltages. Two distinct substates of the open state (“O” state) indicated as O1 of 3.0 nS (blue dashed line) and O2 of 3.5 nS (orange dashed line) were observed at all voltages. Characteristic voltage gating behavior is seen at ±60 mV as stepwise current transition to a low-conductance, “closed” state (red dashed lines). Here and elsewhere, the dash-dotted line represents zero current; dashed lines indicate substates. The current record was digitally filtered at 500 Hz using a low-pass Bessel (eight-pole) filter. Inset (I): Transitions between two states are shown in a finer timescale using a digital 1-kHz Bessel filter. (B) Representative current trace obtained on a multichannel (~40 channels) membrane (upper panel) in response to the applied triangular voltage wave of ±60 mV and 5 mHz (bottom panel). Steep slopes at low potentials correspond to open states (orange dashed line), and reduced slopes at higher potentials indicate “closed” states (red dashed line). PLMs were made of polar lipid extract in 1 M KCl and 5 mM Hepes. (C) Voltage dependence of VDAC2 WT normalized conductance, G/Gmax, obtained in multichannel experiments as in (B). G is the conductance at given voltage, and Gmax is the maximum conductance at |V| ≤ 10 mV. Data points are the means of three experiments ± SD. (D) VDAC2 WT single-channel conductance histogram. The main state conductance was measured for 24 independent molecules. (E) ECDF calculated for all main state (blue) and substate (orange) conductances observed in all experiments (n = 24 channels). Solid dots denote raw data points. The shaded region represents the 95% confidence interval from 10,000 bootstrap replicates.
Fig. 2.
Fig. 2.. VDAC2 substates are anion-selective open states.
(A) A representative single-channel trace of the current through VDAC2 WT was obtained using a 1.0 M (cis)/0.2 M (trans) KCl gradient at different applied voltages, as specified. Blue and orange dashed lines indicate two open substates. Inset (I) shows a fragment of ion current (accentuated by a gray box) at a finer timescale, demonstrating two open states, O1 and O2, at the applied voltages of +20 and 0 mV. The current record was digitally filtered using a 500-Hz [1 kHz in (I)] low-pass Bessel (eight-pole) filter. Other experimental conditions were as in Fig. 1. (B) Current/voltage (I/V) curves were obtained for the two states O1 (blue circles) and O2 (orange squares) for the experiment shown in (A). Linear regressions allow for the calculation of the reversal potential (ΨR) indicated by arrows for each state. Positive ΨR corresponds to anion selectivity. (C) Reversal potential (ΨR) versus conductance scatterplot for all observed conductance substates: main or long-lasting (blue circles) and short-lasting (orange stars) substates for 19 individual VDAC2 WT channels. (D) Comparison of the mean open-state conductance and Cl/K+ permeability ratio (PCl−/PK+) for each VDAC isoform. The full set of the analyzed VDAC2 conductances was divided into a high-conductance state of >1.6 nS (Ghigh) and PCl−/PK+ ~ 1.3 similar to those of VDAC1 and VDAC3 and a state with a conductance lower than 1.6 nS (Glow) [highlighted by blue in (C)] and high anion selectivity with PCl−/PK+ ~ 1.5. Error bars are ±SD from at least five independent channel measurements for each VDAC isoform.
Fig. 3.
Fig. 3.. VDAC2 dynamic substates differ from each other in their interaction with the cytosolic regulator αSyn.
(A) Representative current record of a single VDAC2 WT channel in the presence of 10 nM αSyn, displaying robust substate behavior manifested as spontaneous fluctuations between the low-conductance (3 nS) long-lasting (O1) and high-conductance (3.6 nS) short-lasting (O2) substates at 10 and 30 mV. After 10 min, spontaneous transition to a higher-conductance (3.8 nS) substate (O3) is observed. Insets (I) and (II) show αSyn-induced blockage events at a finer timescale for each of the three substates at 30 mV (gray boxes). Open states (O1, O2, and O3) are indicated by dashed lines, and αSyn-blocked states (B1, B2, and B3) are indicated by dotted lines. (B) The cartoon illustrating the αSyn-VDAC interaction events is characterized by the time when the channel is open (τon) and the blockage time (τb), the duration of each blockage event. (C) Representative log-binned histograms of τon [(C), i] and τb [(C), ii] of each state at 30 mV obtained from the experiment in (A). Solid lines are fits to a single-exponential function with characteristic times <τon> equal to 19.7, 8.62, and 3.87 ms for states O1, O2, and O3, respectively [(C), i]; and τoff = <τb> equal to 5.79, 2.59, and 1.63 ms for states B1, B2, and B3, respectively [(C), ii]. (D) Comparison of kinetic parameters: kon = 1/(<τon>[C]), where [C] is the αSyn bulk concentration, τoff, and the equilibrium constant, Keq = konτoff, of αSyn-VDAC binding for each state at 30 mV. Error bars are ±SD of three fitting algorithms for the exponential fits. (E) Comparison of αSyn-blocked conductance of each conducting state. ΔG/G is the relative conductance drop, where ΔG is the difference between open-state (G) and blocked-state conductances of states O1, O2, and O3. Error bars are ±SD between measurements of ΔG/G.
Fig. 4.
Fig. 4.. NTE and cysteine mutations influence but do not abolish VDAC2 substates.
(A) Structure of hVDAC2 (AlphaFold2 prediction) and VDAC1 (hVDAC1: Protein Data Bank ID: 2JK4). Cysteines are shown as yellow balls. The NTE of VDAC2 is shown in green. (B) ECDF was calculated using conductance values of the measured substates for all conductances observed for WT (blue), ΔN (green), and ΔCys (goldenrod) VDAC2 channels. Occurrence was liberally defined as whether a state transition had been observed during the entire recording period for a given channel. Of 24 single-channel recordings of VDAC2 WT, 13 channels displayed substate behavior compared to 25 channels of a total of 27 for ΔN-VDAC2 channels and 3 of 16 channels of VDAC2-ΔCys. Solid dots represent raw data points. The shaded region represents the 95% confidence interval from 1000 bootstrap replicates. (C) Box-and-whisker plots for the MLE probability of the binomial coefficient; substate behavior being observed in VDAC2 WT (blue), ΔN-VDAC2 (green), and VDAC2-ΔCys (goldenrod) channels. A total of 10,000 bootstrapped replicates was simulated from an MLE of the binomial coefficient originally calculated from 25, 27, and 16 observations of VDAC2 WT, ΔN-VDAC2, and VDAC2-ΔCys, respectively. The top and bottom of the box are, respectively, the 75th and 25th percentiles of the data. The line in the middle of the box is the median. The top whisker extends to the maximum of the set of data points that are less than 1.5 times the interquartile regions beyond the top of the box, with an analogous definition for the lower whisker. Data points not between the ends of the whiskers are plotted as individual points. Substate occurrence between mutants was compared with a chi-square test. *P < 0.05 and ***P < 0.001.
Fig. 5.
Fig. 5.. αSyn blocks the higher-conductance substates with a higher on-rate than the lower-conductance states across VDAC2 mutants.
(A) Representative single-channel current trace obtained with the reconstituted ΔN-VDAC2 mutant with 10 nM αSyn added to both sides of the membrane. Three distinct substates, O1, O2, and O3, are observed at ±10 and ±35 mV. Inset (I) shows αSyn-induced blockage events at a finer timescale for each of the three observed substates at −35 mV (accentuated by the gray box in the left trace). Open states O1, O2, and O3 can be observed along with their corresponding αSyn-blocked states B1, B2, and B3. The current record was digitally filtered using a 1-kHz low-pass Bessel (eight-pole) filter. (B) Voltage dependences of the on-rate constant kon [(B), i], the mean blockage time τoff [(B), ii], and the equilibrium constant Keq [(B), iii] (calculated for the retraction regime only) of αSyn binding to two ΔN-VDAC2 substates with conductances of 4 and 3.2 nS. Arrows in [(B), ii] indicate the transitions between blockage/retraction and translocation regimes. Data are the means of three independent experiments ± SD. (C) Representative current record of the VDAC2-ΔCys single channel in the presence of 10 nM αSyn on both sides of the membrane showing one open state of 4 nS. (D) Example of the current record of VDAC2-ΔCys with two substates of 3.5 and 3 nS obtained at the applied voltage of +35 mV. Current records were digitally filtered using 500-Hz (C) and 1-kHz (D) low-pass Bessel (eight-pole) filters.
Fig. 6.
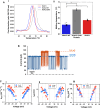
Fig. 6.. The E84 residue of VDAC2 contributes to β barrel stability but does not affect the substate appearance.
(A) [(A), i] The first derivative of the ratio of 350/330 nm tryptophan fluorescence versus temperature demonstrates the inflection melting point (Tm) for VDAC1 (red), VDAC2 WT (blue), and VDAC2 E84A (gray). [(A), ii] Box plot and scatterplot demonstrating average Tm for VDAC1 (red), VDAC2 WT (blue), and VDAC2 E84A (gray). Melting temperatures were compared with Student’s t test; ***P < 0.000001. (B) Representative current record of the VDAC2 E84A mutant showing two equally long-lasting conducting states of 3.0 and 3.6 nS in the presence of 10 nM αSyn on both sides of the membrane at the applied voltage of 30 mV. The current record was digitally filtered using a 1-kHz low-pass Bessel (eight-pole) filter. (C) Voltage dependences of the on-rate constant kon [(C), i], the mean blockage time τoff [(C), ii], and the equilibrium constant Keq [(C), iii] of αSyn binding to two VDAC2 E84A states with conductances of 3.6 and 3.0 nS. Data are the means of three independent experiments ± SD.
Fig. 7.
Fig. 7.. Changes in the transition state energy barrier underlie the kinetic differences in the αSyn-VDAC interaction between substates.
Free energy landscape diagram representing a model of the αSyn-VDAC interaction as a function of the reaction coordinate. The potential well of the initial state of free αSyn bound to the membrane is shown on the left. The potential well of the final state, whereupon the αSyn molecule is captured by the VDAC pore, is shown on the right. The energy landscape experienced by the αSyn molecule as it complexes with higher-conductance VDAC2 substate (1) is represented in orange, whereas the landscape for lower-conductance substate (2) is represented in blue.

Similar articles

Cited by

References

    1. Rahmani Z., Maunoury C., Siddiqui A., Isolation of a novel human voltage-dependent anion channel gene. Eur. J. Hum. Genet. 6, 337–340 (1998). - PubMed
    1. Messina A., Reina S., Guarino F., De Pinto V., VDAC isoforms in mammals. Biochim. Biophys. Acta 1818, 1466–1476 (2012). - PubMed
    1. Piehowski P. D., Zhu Y., Bramer L. M., Stratton K. G., Zhao R., Orton D. J., Moore R. J., Yuan J., Mitchell H. D., Gao Y., Webb-Robertson B. M., Dey S. K., Kelly R. T., Burnum-Johnson K. E., Automated mass spectrometry imaging of over 2000 proteins from tissue sections at 100-μm spatial resolution. Nat. Commun. 11, 8 (2020). - PMC - PubMed
    1. Anflous-Pharayra K., Lee N., Armstrong D. L., Craigen W. J., VDAC3 has differing mitochondrial functions in two types of striated muscles. Biochim. Biophys. Acta 1807, 150–156 (2011). - PMC - PubMed
    1. Sampson M. J., Decker W. K., Beaudet A. L., Ruitenbeek W., Armstrong D., Hicks M. J., Craigen W. J., Immotile sperm and infertility in mice lacking mitochondrial voltage-dependent anion channel type 3. J. Biol. Chem. 276, 39206–39212 (2001). - PubMed

MeSH terms

Substances

LinkOut - more resources