. 2025 Apr 25;11(17):eado6847.
doi: 10.1126/sciadv.ado6847. Epub 2025 Apr 23.

Genetics- and age-driven neuroimmune and disc changes underscore herniation susceptibility and pain-associated behaviors in SM/J mice

Affiliations

Genetics- and age-driven neuroimmune and disc changes underscore herniation susceptibility and pain-associated behaviors in SM/J mice

Emanuel J Novais et al. Sci Adv. .

Abstract

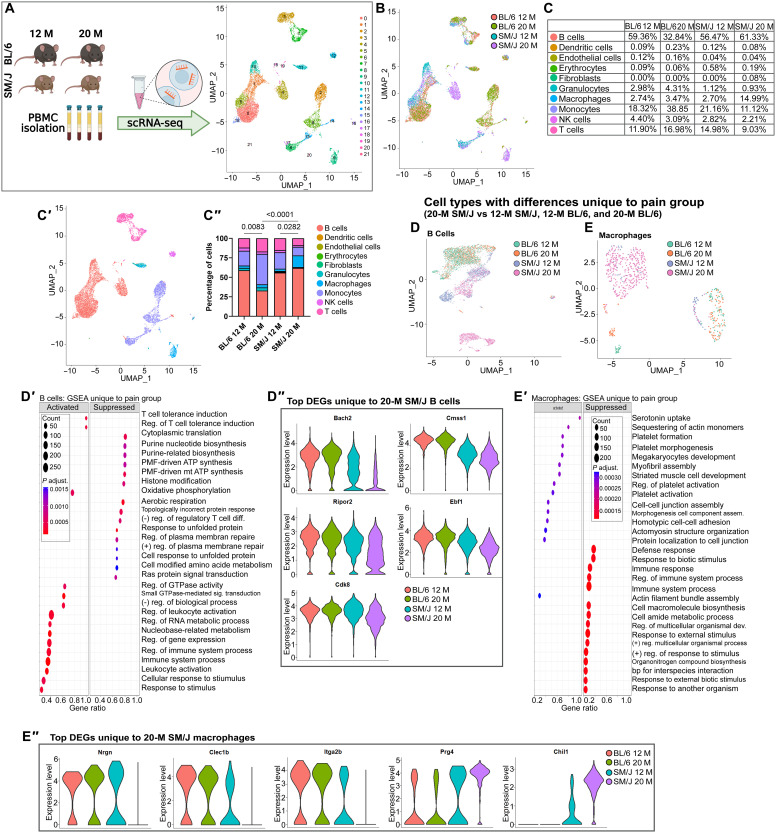
There are no appropriate mouse models to study the pathophysiology of spontaneous disc herniations in a wild-type setting. SM/J mice, a poor healer inbred strain, presented a high incidence of age-associated lumbar disc herniations with neurovascular innervations. Transcriptomic comparisons of the SM/J annulus fibrosus with human tissues showed shared pathways related to immune cell activation and inflammation. Notably, aged SM/J mice showed increased pain sensitization and neuroinflammation with altered extracellular matrix regulation in the dorsal root ganglia and spinal cord. There were increased T cells in the vertebral marrow, and cytometry by time-of-flight analysis showed increased splenic CD8+ T cells, nonspecific activation of CD8+ memory T cells, and enhanced interferon-γ production in the myeloid compartment. Single-cell RNA sequencing of peripheral blood mononuclear cells showed more B cells, with lower proportions of T cells, monocytes, and granulocytes. This study highlights the contribution of genetic background and aging to increased susceptibility of spontaneous intervertebral disc herniations in a clinically relevant murine model.


Figures

Fig. 1.
Fig. 1.. SM/J mice show a high incidence of age-dependent disc herniation, accompanied by cellular deficiencies and matrix remodeling.
(A to C″) Histology of the 6-, 12-, and 20-M-old BL/6 and SM/J lumbar discs. SM/J shows altered tissue architecture and cell morphology, indicating disc degeneration in the NP, AF, and cartilage end plate (CEP). (D to E′) Modified Thompson grade distributions and averages show higher average scores in SM/J NP and AF tissues. (F and G) Prevalence of herniations. Lumbar levels from L1-S1: nBL/6 6 M = 5 (3 females and 2 males); nBL/6 12 M = 6 (2 females and 4 males); nBL/6 20 M = 9 (3 females and 6 males); nSM/J 6 M = 7 (4 females and 3 males); nSM/J 12 M = 10 (6 females and 4 males); nSM/J 20 M = 8 (2 females and 6 males). (H to J″) Staining and abundance of key markers of (H to H″) NP cell phenotype (CA3), (I to I″) local inflammation (IL-6), and (J to J″) cell viability (TUNEL). BL/6: 12 M (n = 5 to 6 mice) and 20 M (n = 5 to 6 mice). SM/J: 12 M (n = 5 to 6 mice) and 20 M (n = 5 to 6 mice); two to three discs per animal. (K to M′) Picrosirius red staining and polarized light microscopy of lumbar disc sections. (N to N″) Analysis of percentage of thin (green), intermediate (yellow), and thick fibers (red). BL/6: 12 M (n = 5 to 6) and 20 M (n = 5 to 6). SM/J: 12 M (n = 5 to 6) and 20 M (n = 5 to 6); two to three discs per mouse. (O) Percentage of 20-M lumbar discs with collagen fibers in the NP. Kruskal-Wallis test for non-normally distributed data followed by Dunn’s multiple comparison test was used for (E) and (E′), presenting adjusted P value. A two-tailed t test or Mann-Whitney test was used for (H″) to (J″) and (N) to (N″), and chi-square test was used for (D), (D′), (G), and (O). Scale bars (5×), 200 μm. Scale bars (20×), 200 μm.
Fig. 2.
Fig. 2.. Transcriptomic signatures of human AF degeneration share similarities with SM/J mice.
(A) Schematic summarizing study design for the transcriptomic analysis of AF tissues. (B) Transcriptomic profiles of 12-M BL/6 AF (n = 5 mice), 20-M BL/6 AF (n = 4 mice), 12-M SM/J AF (n = 4 mice), and 20-M SM/J AF (n = 4 mice) tissues from mice clustered distinctly by principal components analysis. (C) Hierarchical clustering of SM/J aging DEGs (FC ≥ 2 and FDR ≤ 0.05). (D) Common and divergent up-regulated DEGs between SM/J AF and BL/6 AF aging. (E) Common and divergent down-regulated DEGs between SM/J AF and BL/6 AF aging. (F) Representative Panther Pathway processes from herniated group DEGs. (G) Human samples from GSE70362 included in the comparative analysis with SM/J. (H) Hierarchical clustering of herniated versus degenerated DEGs (P ≤ 0.05). (I) Representative Panther Pathway processes from up- and down-regulated herniated versus degenerated DEGs. Panther analysis was performed using the PANTHER Overrepresentation Test with Panther Pathway and Panther Go Slim biological pathway database annotations and a binomial statistical test (FDR ≤ 0.05).
Fig. 3.
Fig. 3.. SM/J mice show an altered subchondral bone structure, tissue innervation, and altered sensitivity to mechanical and temperature stimuli with aging.
(A and A′) Microcomputed tomography reconstruction of 20-M BL/6 and SM/J vertebrae, with the marked subchondral bone region of interest. (B to H) Analysis of subchondral bony end-plate parameters: (B) bone volume, (C) cross-sectional perimeter, (D) tissue mineral density, (E) cross-sectional thickness, (F) bone volume (BV/TV), (G) bone surface/volume (BS/BV), and (H) % closed porosity between 20-M BL/6 and SM/J males and females. nBL/6 female = 2; nBL/6 male = 3; nSM/J female = 2; nSM/J male = 2; four vertebrae (L3-L6 per mouse). Two-tailed t test or Mann-Whitney test was used as appropriate. (I to J″) Neurofilament and endomucin presence in BL/6 and SM/J discs at 12 and 20 M, with the endomucin presence quantified. n = 6 to 8 mice per strain; two to three levels per mouse. Scale bars, 200 μm. (K to L″) Quantified NGF staining (K to L′) in 12- and 20-M BL/6 and SM/J NP (K″) and AF (L″) tissues. (M to O) Sensitization analysis: (M) mechanical (Von Frey), (N) hot (Hargreaves), and (O) cold stimulus. nBL/6 12 M = 6 to 11; nBL/6 20 M = 8; nSM/J 12 M = 11 to 14; nSM/J 20 M = 6 to 7. (P) Schematic of gait analysis and parameters. (Q to X) Gait parameters: (Q) swing time, (R) paw angle variability, (S) stance width variability, (T) step angle, (U) stride length variability, (V) swing duration, (W) paw area peak stance, and (X) gait symmetry. nBL/6 12 M = 9; nBL/6 20 M = 6; nSM/J 12 M = 8; nSM/J 20 M = 7. Kruskal-Wallis test for non-normally distributed data followed by Dunn’s multiple comparison test was used for (M) to (O), with adjusted P value. Two-tailed t test or Mann-Whitney test was used to compare differences between two groups as appropriate for (B) to (H), (K′) to (L″), and (K) to (X). Chi-square test was used for (J″). (I to J′) Scale bars (20×), 200 μm. (K to L′) Scale bars (10×), 200 μm.
Fig. 4.
Fig. 4.. DRGs in SM/J mice show the enrichment of DEGs associated with the glial cells, neuroinflammatory response, cell-matrix adhesion modulation, and immune system regulation.
(A) Principal components analysis of transcriptomic profiles of 12- and 20-M BL/6 (n = 3 females and 3 males per time point) and SM/J (n = 3 females and 3 males per time point) DRG tissues, (B) weighted source of variation, and (C) volcano plot showing up- and down-regulated DEGs from the 20-M SM/J DRGs versus 20-M BL/6 DRG comparison (FC ≥ 2 and FDR ≤ 0.05). (D) Pie chart showing the distribution of up- and down-regulated DEGs and enriched GO processes from the 20-M SM/J versus BL/6 DRGs. (E) Venn diagram of common up-regulated DEGs in 20-M SM/J versus 12-M SM/J and 20-M SM/J versus 20-M BL/6 but not present in 12-M SM/J versus 12-M BL/6. (F) Pathway enrichment analysis of 115 DEGs identified in (E); analysis performed in PantherDB using the statistical overrepresentation test with Gene Ontology database annotations and a binomial statistical test (FDR < 0.05). Values in parentheses demonstrate the number of genes within the annotation set relative to the predicted number of genes. (G to J″″) Quantitative immunohistochemistry of the dorsal horn of the spinal cord in the lumbar region: (G to G″″) IB4, (H to H″″) CGRP, (I to I″″) GFAP, and (J to J″″) IBA1. A.U., arbitrary units. nBL/6 12 M = 6; nBL/6 20 M = 4; nSM/J 12 M = 6; nSM/J 20 M = 4; two spine levels per animal. Two-tailed t test or Mann-Whitney test was used as appropriate. Nonparametric Spearman correlation test was used for analysis in (D) to (G). Scale bars (A to H′), 200 μm.
Fig. 5.
Fig. 5.. SM/J mice show altered plasma cytokine levels and increased T cell and neutrophil recruitment in the vertebral marrow.
(A to R) Multiplex analysis of pro-inflammatory, dual function, and anti-inflammatory proteins in plasma from 12- and 20-M BL/6 and SM/J mice. t test or Mann-Whitney test was used as appropriate. (S to V) Pearson correlation between INF-γ, IL-1, IL-2, and IL-4 plasma levels and Von Frey sensitivities. n = 4 to 6 mice per strain per time point. (W to Z″″″) Quantitative immunohistochemistry of (W to W″″) CD19, (X to X″″) CD3, (Y to Y″″) Ly6G, and (Z to Z″″) MHCII and F4/80 (individually and ratio quantification) at 12 and 20 M in the vertebral bone (n = 6 to 10 vertebrae per strain per time point). Two-tailed t test or Mann-Whitney test was used as appropriate. Scale bars (A to H′), 100 μm.
Fig. 6.
Fig. 6.. SM/J mice show altered immune cell profiles in peripheral circulation.
(A) Schematic showing experimental design and unbiased clustering of PBMC transcripts. n12 M BL/6 = 2 females and 2 males; n12 M SM/J = 2 females and 1 male; n20 M BL/6 = 2 females and 2 males; n20MSM/J = 4 males. (B) Clustering of PBMC transcripts according to strain and time point. (C to C″) Proportion of cell populations labeled with the SingleR program. (D and E) UMAP labeled according to mouse strain and age, showing cell populations identified to be unique to SM/J at 20 M, when mice show disc herniations and pain behaviors: (D) B cells and (E) macrophages. (D′) GSEA in B cells based on DEGs identified in 20-M SM/J PBMCs. (D″) Violin plots of most DEGs in B cells in the SM/J pain group. (E′) GSEA of macrophages from 20-M SM/J. (E″) Violin plots of most DEGs in macrophages in the SM/J pain group (n ~ 5000 cells per strain per time point). Chi-square test was used for (C″).
Fig. 7.
Fig. 7.. CyTOF analysis of splenocytes reveals age- and strain-based frequency differences in immune cell populations, and intracellular marker abundance in 20-M SM/J splenocytes indicates possible repression of the innate immune system and overactivation of CD8+ T cell populations.
(A) Schematic showing the workflow for CyTOF analysis of splenocytes from BL/6 and SM/J mice and the cell population labeling hierarchy. n12 M BL/6 = 2 females and 2 males; n12 M SM/J = 2 females and 1 male; n20 M BL/6 = 2 females and 2 males; n20 M SM/J = 4 males. DC, dendritic cell. (B to C′) Volcano plots showing cell populations in strain- and age-based comparisons based on FDR and FC. (D to I) Frequency plots showing age- or strain-based differences in (D) NK cell, (E) T cell, (F) CD8+ T cell, (G) myeloid cell, (H) CD4+ memory T cell, and (I) CD4+ naïve T cell populations. (J) Heatmap of splenocytes from 20-M SM/J versus BL/6 showing intracellular cytokine and pro-inflammatory marker abundance within each cell population identified through CyTOF analysis. (K to Q) Significant changes in cytokine/pro-inflammatory marker abundance in (K) myeloid cells, (L) conventional dendritic cells, (M) plasmacytoid dendritic cells, (N) Lin− cells, (O) CD8+ naïve T cells, (P) CD8+ T cells, and (Q) CD8+ memory T cells. Two-tailed t test or Mann-Whitney test was used as appropriate.
Fig. 8.
Fig. 8.. Summary schematic describing the SM/J herniation phenotype.
Working hypothesis and phenotypic changes found in the NP, AF, subchondral bone, DRGs, spinal cord, plasma, and immune tissues of SM/J mice relevant to herniation and chronic pain–related behaviors.

References

    1. GBD 2017 Disease and Injury Incidence and Prevalence Collaborators , Global, regional, and national incidence, prevalence, and years lived with disability for 354 diseases and injuries for 195 countries and territories, 1990–2017: A systematic analysis for the Global Burden of Disease Study 2017. Lancet 392, 1789–1858 (2018). - PMC - PubMed
    1. Katz J. N., Lumbar disc disorders and low-back pain: Socioeconomic factors and consequences. J. Bone Joint Surg. Am. 88, 21–24 (2006). - PubMed
    1. Cheung K. M. C., Karppinen J., Chan D., Ho D. W. H., Song Y.-Q., Sham P., Cheah K. S. E., Leong J. C. Y., Luk K. D. K., Prevalence and pattern of lumbar magnetic resonance imaging changes in a population study of one thousand forty-three individuals. Spine 34, 934–940 (2009). - PubMed
    1. Novais E. J., Tran V. A., Miao J., Slaver K., Sinensky A., Dyment N. A., Addya S., Szeri F., van de Wetering K., Shapiro I. M., Risbud M. V., Comparison of inbred mouse strains shows diverse phenotypic outcomes of intervertebral disc aging. Aging Cell 19, e13148 (2020). - PMC - PubMed
    1. Tessier S., Tran V. A., Ottone O. K., Novais E. J., Doolittle A., Di Muzio M. J., Shapiro I. M., Risbud M. V., TonEBP-deficiency accelerates intervertebral disc degeneration underscored by matrix remodeling, cytoskeletal rearrangements, and changes in proinflammatory gene expression. Matrix Biol. 87, 94–111 (2019). - PMC - PubMed