. 2025 Apr 25;11(17):eadu0847.
doi: 10.1126/sciadv.adu0847. Epub 2025 Apr 23.

Acute BRCAness induction and AR pathway blockage through CDK12/7/9 degradation enhances PARP inhibitor sensitivity in prostate cancer

Affiliations

Acute BRCAness induction and AR pathway blockage through CDK12/7/9 degradation enhances PARP inhibitor sensitivity in prostate cancer

Fu Gui et al. Sci Adv. .

Abstract

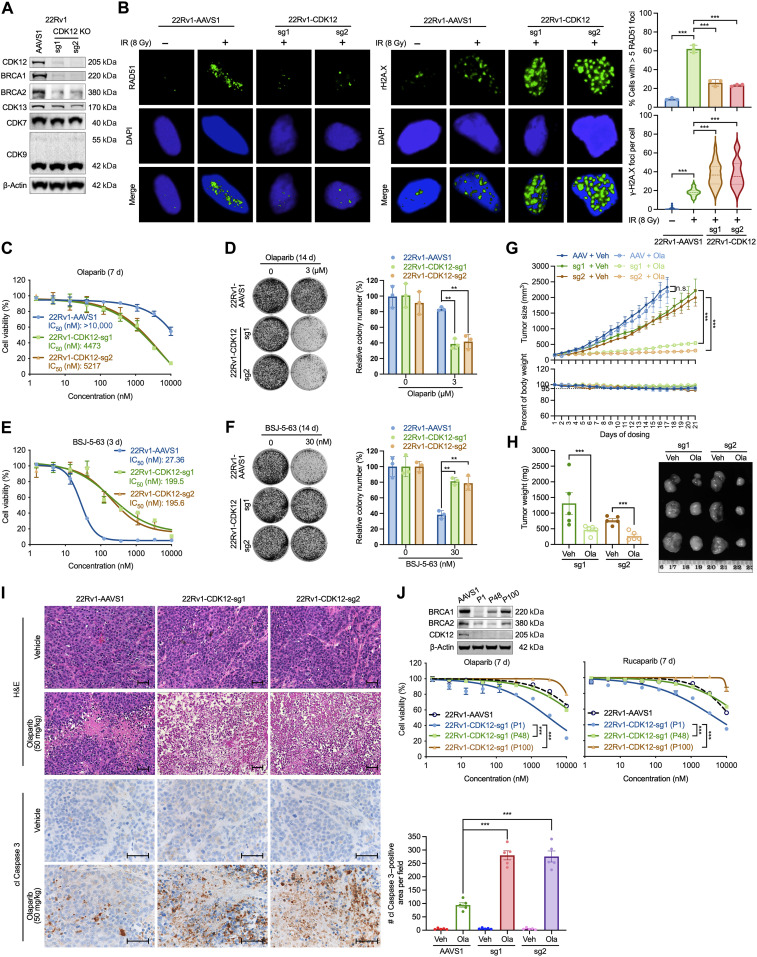
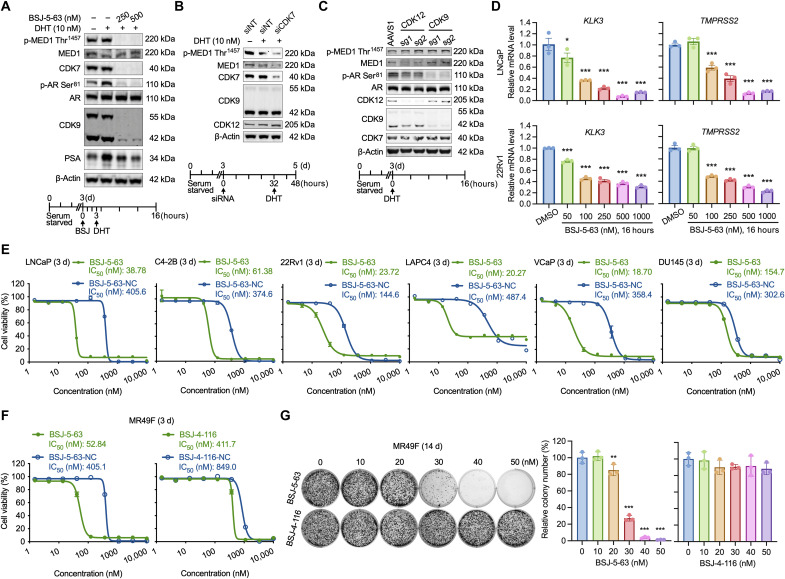
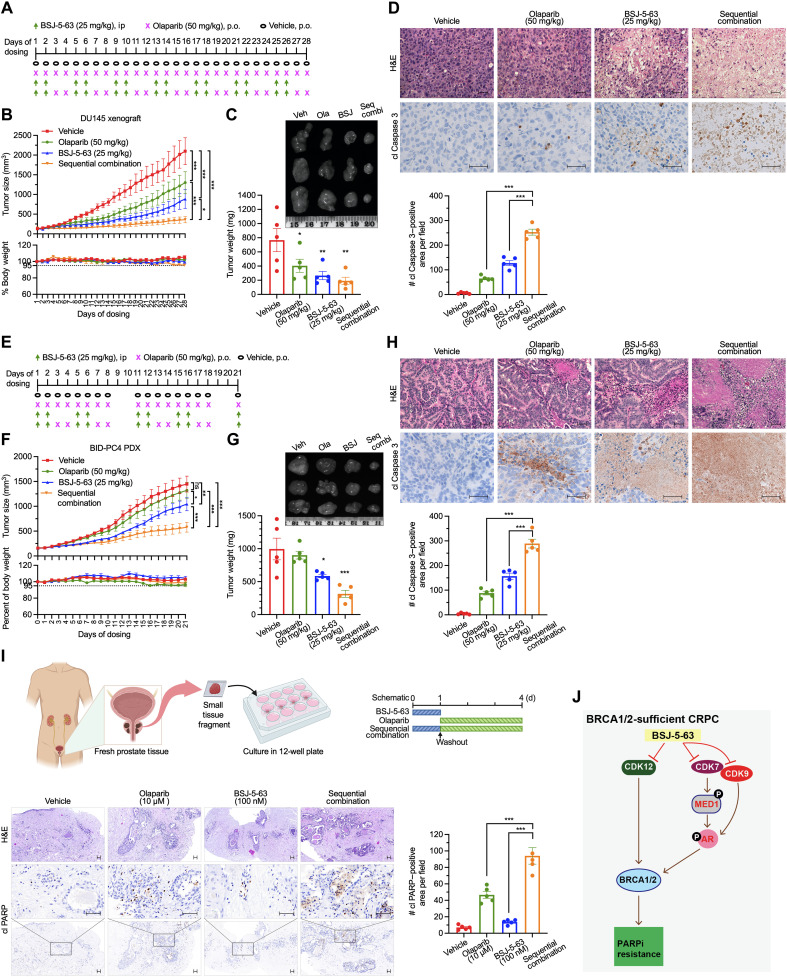
Current treatments for advanced prostate cancer (PCa) primarily target the androgen receptor (AR) pathway. However, the emergence of castration-resistant prostate cancer (CRPC) and resistance to AR pathway inhibitors (APPIs) remains ongoing challenges. Here, we present BSJ-5-63, a proteolysis-targeting chimera (PROTAC) targeting cyclin-dependent kinases (CDKs) CDK12, CDK7, and CDK9, offering a multipronged approach to CRPC therapy. BSJ-5-63 degrades CDK12, diminishing BRCA1 and BRCA2 expression and inducing a sustained "BRCAness" state. This sensitizes cancer cells to PARP inhibitors (PARPis) regardless of their homologous recombination repair (HRR) status. Furthermore, CDK7 and CDK9 degradation attenuates AR signaling, enhancing its therapeutic efficacy. Preclinical studies, including both in vitro and in vivo CRPC models, demonstrate that BSJ-5-63 exerts potent antitumor activity in both AR-positive and AR-negative setting. This study introduces BSJ-5-63 as a promising therapeutic agent that addresses both DNA repair and AR signaling mechanisms, with potential benefits for a board patient population.


Figures

Fig. 1.
Fig. 1.. BSJ-5-63 degrades CDK12/7/9.
(A) Chemical structures of BSJ-5-63 and its negative control analog BSJ-5-63-NC. (B) Proteome-wide selectivity of BSJ-5-63. Quantitative proteomics showing the relative abundance of proteins measured by multiplexed quantitative mass spectrometry (MS)–based proteomic analysis in 22Rv1 cells treated with BSJ-5-63 (100 nM) or dimethyl sulfoxide (DMSO) for 8 hours. The treatment with BSJ-5-63-NC (250 nM) was used as a control. CDK12, CDK7, and CDK9 are marked. Dotted lines indicate the threshold for statistically significant degradation of proteins. (C) Western blots of the indicated proteins in LNCaP, C4-2B, and 22Rv1 cells after 8 hours of treatment with BSJ-5-63 or BSJ-5-63-NC in a dose-dependent manner. Representative blots from three independent experiments are shown. (D) Western blots of the indicated proteins in LNCaP and 22Rv1 cells after treatment with 500 nM BSJ-5-63 in a time-course manner. Representative blots from three independent experiments are shown.
Fig. 2.
Fig. 2.. CDK12 degradation by BSJ-5-63 induces acute BRACness and impairs HRR.
(A) Differentially expressed genes 8 hours after treatment with BSJ-5-63 or BSJ-5-63-NC in 22Rv1 cells. Left: Venn diagram showing the intersection of down-regulated genes between BSJ-5-63 and its negative control analog BSJ-5-63-NC treatment in 22Rv1 cells. Right: Volcano plot showing differentially expressed genes after BSJ-6-63 or BSJ-5-63-NC treatment. Blue dots represent down-regulated genes; red dots represent up-regulated genes. NS, not significant. (B) Top enriched Kyoto Encyclopedia of Genes and Genomes (KEGG) pathways in down-regulated genes after BSJ-5-63 treatment in 22Rv1 cells. (C) Scatter blot showing down-regulated BRACness genes after BSJ-5-63 and BSJ-5-63-NC treatment in 22Rv1 cells. (D) mRNA levels of BRCA1/2 were measured after treatment with BSJ-5-63 and BSJ-5-63-NC as indicated in 22Rv1, LNCaP, and DU145 cells by real-time reverse transcription polymerase chain reaction (RT-PCR). Data represent means ± SEM (n = 3). *P < 0.05; ***P < 0.001, one-way analysis of variance (ANOVA) with Tukey’s multiple comparisons test. (E) Western blots of the indicated proteins in LNCaP and 22Rv1 cells after 48 hours of treatment with BSJ-5-63 or BSJ-5-63-NC in a dose-dependent manner. Representative blots from three independent experiments are shown. (F) Western blots of the indicated proteins in LNCaP and 22Rv1 cells after BSJ-5-63 (100 nM) treatment in a time-course manner. Representative blots from three independent experiments are shown. (G) Representative images of immunofluorescence staining and quantification of the number of RAD51 and γ-H2AX foci in 22Rv1 cells 24 hours after BSJ-5-63 (100 nM) treatment followed by 8-Gy irradiation. Representative images from three independent experiments. For RAD51 foci, data represent means ± SEM (n = 3) with more than 50 cells analyzed each replicate. For γ-H2AX foci, more than 50 cells were analyzed per condition. Dotted lines inside the violin indicate the median. ***P < 0.001; n.s., not significant; the P values were determined using two-sided t test.
Fig. 3.
Fig. 3.. BSJ-5-63 sensitizes PCa cells to PARPis through CDK12 degradation.
(A) 22Rv1 cells were treated with BSJ-5-63 for 2 days, followed by its removal. mRNA levels of BRCA1/2 were measured at the indicated time points using real-time RT-PCR. Data represent means ± SEM (n = 3). (B) Cell viability assays in LNCaP and 22Rv1 cells treated with BSJ-5-63 for 2 days, PARPis [olaparib (Ola), rucaparib (Ruca), niraparib (Nira), or talazoparib (Tala)] for 7 days, or sequential combination where BSJ-5-63 was removed after 2 days and followed by PARPi treatment for additional 5 days. Data represent means ± SEM (n = 3). (C) Colony formation assays in LNCaP, 22Rv1, and DU145 cells treated with BSJ-5-63 for 2 days, PARPis for 14 days, or sequential combination where BSJ-5-63 was removed after 2 days and followed by 12 days of PARPi treatment. Data represent means ± SEM (n = 3). (D) 22Rv1 cells were treated with BSJ-4-116 for 2 days, followed by its removal. mRNA levels of BRCA1/2 were measured at the indicated time points using real-time RT-PCR. Data represent means ± SEM (n = 3). (E) Cell viability assays in LNCaP and 22Rv1 cells treated with BSJ-4-116, PARPis, or a sequential combination as indicated. Data represent means ± SEM (n = 3). (F) Colony formation assays in LNCaP and 22Rv1 cells treated with BSJ-4-116, PARPis, or a sequential combination as indicated. Data represent means ± SEM (n = 3). Experimental procedures are depicted schematically in each panel. *P < 0.05; **P < 0.01; ***P < 0.001, one-way ANOVA with Tukey’s multiple comparisons test. d, days.
Fig. 4.
Fig. 4.. CDK12 KO impairs HRR and sensitizes PCa cells to PARP inhibition.
(A) Western blots showing CDK12 knockout (KO) in 22Rv1 cells using two single-guide RNAs (sgRNAs; sg1 and sg2) compared to the AAVS1 sgRNA control. Representative blots from three independent experiments are shown. (B) Immunofluorescence images and quantification of RAD51 and γ-H2AX foci in CDK12-KO 22Rv1 cells after 8-Gy irradiation, compared to AAVS1-KO control. Data represent means ± SEM (n = 3), with >50 cells analyzed per replicate. Dotted lines in violin plots indicate medians. ***P < 0.001, two-sided t test. (C and D) CDK12 KO significantly sensitized 22Rv1 cells to olaparib in cell viability (C) and colony formation assays (D). Data represent means ± SEM (n = 3). **P < 0.01, one-way ANOVA with Tukey’s test. (E and F) CDK12 KO reduced the antiproliferative effects of BSJ-5-63 in cell viability (E) and colony formation assays (F). Data represent means ± SEM (n = 3). **P < 0.01, one-way ANOVA with Tukey’s test. (G) CDK12 KO enhanced the in vivo antitumor efficacy of olaparib. Tumor volume and mouse body weight curves are shown. Data represent means ± SEM (n = 5). n.s., not significant; ***P < 0.001, two-sided t test. (H) Tumor weights from CDK12-KO 22Rv1 xenografts on day 21 of olaparib treatment with representative images. Data represent means ± SEM (n = 5). ***P < 0.001, two-sided t test. (I) Hematoxylin and eosin (H&E) staining and immunohistochemistry (IHC) analysis showing increased cell death in CDK12-KO tumors with olaparib. Right: Quantification of cleaved (cl) Caspase 3 staining. Scale bars, 50 μm. Data represent means ± SEM (n = 5). ***P < 0.001, one-way ANOVA with Tukey’s test. (J) Long-term passaging of CDK12-KO cells led to PARPi resistance. Data represent means ± SEM (n = 3). ***P < 0.001, one-way ANOVA with Tukey’s test. Top: Western blots showing BRCA1/2 expression. Veh, vehicle.
Fig. 5.
Fig. 5.. CDK7/9 degradation by BSJ-5-63 blocks MED1/AR-mediated transcription and PCa cell growth.
(A) Western blots showing abolished MED1/AR phosphorylation and reduced PSA expression through CDK7/9 degradation after BSJ-5-63 treatment. LNCaP cells were grown in CSS-containing medium for 3 days. Schematic of drug treatment is shown (bottom). (B) Western blots showing reduced phosphorylation of MED1 at T1457 after CDK7 knockdown. Schematic of drug treatment is shown (bottom). (C) Western blots showing reduced phosphorylation of AR at Ser81 after CDK9 KO. The phosphorylation of MED1 at Thr1457 remains unchanged after CDK12 or CDK9 KO. Schematic of drug treatment is shown (Bottom). (D) The expression of AR target genes significantly down-regulated 16 hours after BSJ-5-63 treatment in LNCaP and 22Rv1 cells. mRNA levels of KLK3 and TMPRSS2 were measured by real-time RT-PCR. Data represent means ± SEM (n = 3). *P < 0.05; ***P < 0.001, one-way ANOVA with Tukey’s multiple comparisons test. (E) Dose-response curves for LNCaP, C4-2B, 22Rv1, LAPC4, VCaP, and DU145 cells treated with BSJ-5-63 or BSJ-5-63-NC at indicated dose range for 72 hours. Data represent means ± SEM (n = 3). (F) Cell viability assay showing the inhibition of MR49F cell growth after treatment with BSJ-5-63, but not BSJ-4-116. Dose-response curves for MR49F cells treated with BSJ-5-63, BSJ-5-63-NC, BSJ-4-116, or BSJ-4-1116-NC at indicated dose range for 72 hours. Data represent means ± SEM (n = 3). (G) Colony formation assay showing inhibition of MR49F colony growth after treatment with BSJ-5-63, but not BSJ-4-116. Representative colonies from three independent experiments are shown. Data represent means ± SEM (n = 3). **P < 0.01; ***P < 0.001, one-way ANOVA with Tukey’s multiple comparisons test.
Fig. 6.
Fig. 6.. BSJ-5-63 inhibits the growth of AR-positive 22Rv1 xenografts as a single agent or in combination with olaparib.
(A) Western blot analysis of the expression of CDK12/7/9 in 22Rv1 tumors from mice sacrificed 3 days after BSJ-5-63 treatment as indicated. Representative blots from three independent animals per group are shown. (B) The antitumor efficacy of BSJ-5-63 in 22Rv1 xenograft model. Left: Schematic of the BSJ-5-63 treatment protocol. Right: Tumor volume curve and mouse body weight curve. Data represent means ± SEM (n = 3 or 5 per group). (C) Tumor weights of 22Rv1 xenografts dissected on day 12 of drug treatment with representative images. Data represent means ± SEM (n = 3 or 5 per group). (D) H&E staining and IHC analysis showing significantly increased apoptosis in 22Rv1 tumors after treatment with BSJ-5-63. Scale bars, 50 μm. Right: Quantification of cleaved (cl) Caspase 3 staining. Data represent means ± SEM (n = 3 or 5 per group). (E) Schematic of sequential combination treatment protocol for 22Rv1 xenograft. (F) The in vivo antitumor efficacy of sequential combination of BSJ-5-63 and olaparib in 22Rv1 xenograft model. Top: Tumor volume curve. Bottom: Mouse body weight curve. Data represent means ± SEM (n = 5 per group). (G) Tumor weights of 22Rv1 xenografts dissected on day 21 of drug treatment with representative images. Data represent means ± SEM (n = 5 per group). (H) H&E staining and IHC analysis showing significantly increased apoptosis in 22Rv1 tumors after sequential combination of BSJ-5-63 and olaparib. Scale bars, 50 μm. Right: Quantification of cl Caspase 3 staining. Data represent means ± SEM (n = 5 per group). *P < 0.05; **P < 0.01; ***P < 0.001, one-way ANOVA with Tukey’s multiple comparisons test.
Fig. 7.
Fig. 7.. BSJ-5-63 sensitizes prostate tumors to PARP inhibition in vivo.
(A) Schematic of sequential treatment protocol for DU145 xenograft. (B) Tumor volume and mouse body weight curves for DU145 xenografts treated with BSJ-5-63, olaparib, or their sequential combination. Data represent means ± SEM (n = 5). (C) Tumor weights from DU145 xenografts on day 28 of treatment with representative images. Data represent means ± SEM (n = 5). (D) H&E staining and IHC for cleaved (cl) Caspase 3 of DU145 tumors reveal increased apoptosis after sequential combination therapy. Scale bars, 50 μm. Quantification of cl Caspase 3 is shown. Data represent means ± SEM (n = 5). (E) Schematic of sequential treatment protocol for BID-PC4 PDX model. (F) Tumor volume and moue body weight curves for BID-PC4 PDX treated with BSJ-5-63, olaparib, or their combination. Data represent means ± SEM (n = 5). (G) Tumor weights from BID-PC4 PDX on day 21 of treatment with representative images. Data represent means ± SEM (n = 5). (H) H&E staining and IHC for cl Caspase 3 of BID-PC4 PDX tumors show enhanced apoptosis following sequential combination therapy. Scale bar, 50 μm. Quantification of cl Caspase 3 is shown. Data represent means ± SEM (n = 5). (I) Short-term ex vivo culture of PCa tissue fragments from patient #1 (Gleason score 7a/ISUP grade group 2) treated with the sequential combination. Top: Experimental schematic. Bottom: H&E staining and IHC for cl PARP reveal increased apoptosis. Scale bars, 50 μm. Quantification of cl PARP is shown. Data represent means ± SEM. (J) Proposed model illustrating how BSJ-5-63 induces acute BRCAness and AR pathway inhibition via CDK12/7/9 degradation, sensitizing PCa cells to PARP inhibitors. n.s., not significant; *P < 0.05; **P < 0.01; ***P < 0.001, one-way ANOVA with Tukey’s test.

Update of

References

    1. Siegel R. L., Giaquinto A. N., Jemal A., Cancer statistics, 2024. CA Cancer J. Clin. 74, 12–49 (2024). - PubMed
    1. Einstein D. J., Arai S., Balk S. P., Targeting the androgen receptor and overcoming resistance in prostate cancer. Curr. Opin. Oncol. 31, 175–182 (2019). - PMC - PubMed
    1. E. Lee, Z. Zhang, C. C. Chen, D. Choi, A. C. A. Rivera, E. Linton, Y. J. Ho, J. Love, J. LaClair, J. Wongvipat, C. L. Sawyers, Timing of treatment shapes the path to androgen receptor signaling inhibitor resistance in prostate cancer. bioRxiv 585532 [Preprint] (2024). 10.1101/2024.03.18.585532. - DOI
    1. Abida W., Cyrta J., Heller G., Prandi D., Armenia J., Coleman I., Cieslik M., Benelli M., Robinson D., Van Allen E. M., Sboner A., Fedrizzi T., Mosquera J. M., Robinson B. D., De Sarkar N., Kunju L. P., Tomlins S., Wu Y. M., Nava Rodrigues D., Loda M., Gopalan A., Reuter V. E., Pritchard C. C., Mateo J., Bianchini D., Miranda S., Carreira S., Rescigno P., Filipenko J., Vinson J., Montgomery R. B., Beltran H., Heath E. I., Scher H. I., Kantoff P. W., Taplin M. E., Schultz N., deBono J. S., Demichelis F., Nelson P. S., Rubin M. A., Chinnaiyan A. M., Sawyers C. L., Genomic correlates of clinical outcome in advanced prostate cancer. Proc. Natl. Acad. Sci. U.S.A. 116, 11428–11436 (2019). - PMC - PubMed
    1. Lord C. J., Ashworth A., PARP inhibitors: Synthetic lethality in the clinic. Science 355, 1152–1158 (2017). - PMC - PubMed

MeSH terms