

doi: 10.1182/bloodadvances.2025015894.
T-cell dysfunction during blinatumomab therapy in pediatric acute lymphoblastic leukemia
Affiliations
- PMID: 40267221
- PMCID: PMC12305223
- DOI: 10.1182/bloodadvances.2025015894
Item in Clipboard
T-cell dysfunction during blinatumomab therapy in pediatric acute lymphoblastic leukemia
Blood Adv.
.
No abstract available
Conflict of interest statement
The current affiliation for J.M. is Pediatric Oncology Branch, Cancer for Center Research, National Cancer Institute, National Institutes of Health, Bethesda, MD.
The current affiliation for A.L., S.-J.Y., M.V., and C.P. is Department of Pediatrics, City of Hope Comprehensive Cancer Center, Duarte, CA.
Figures
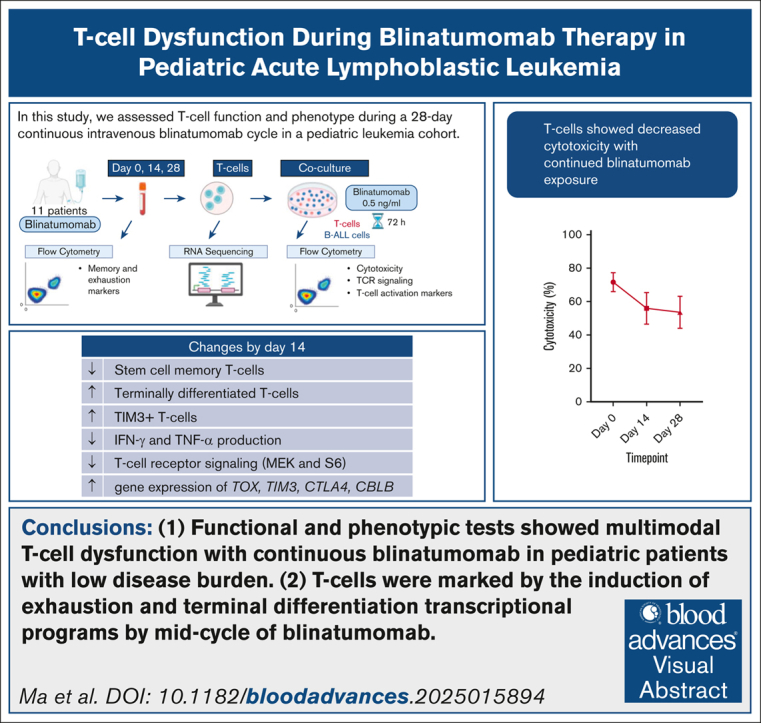
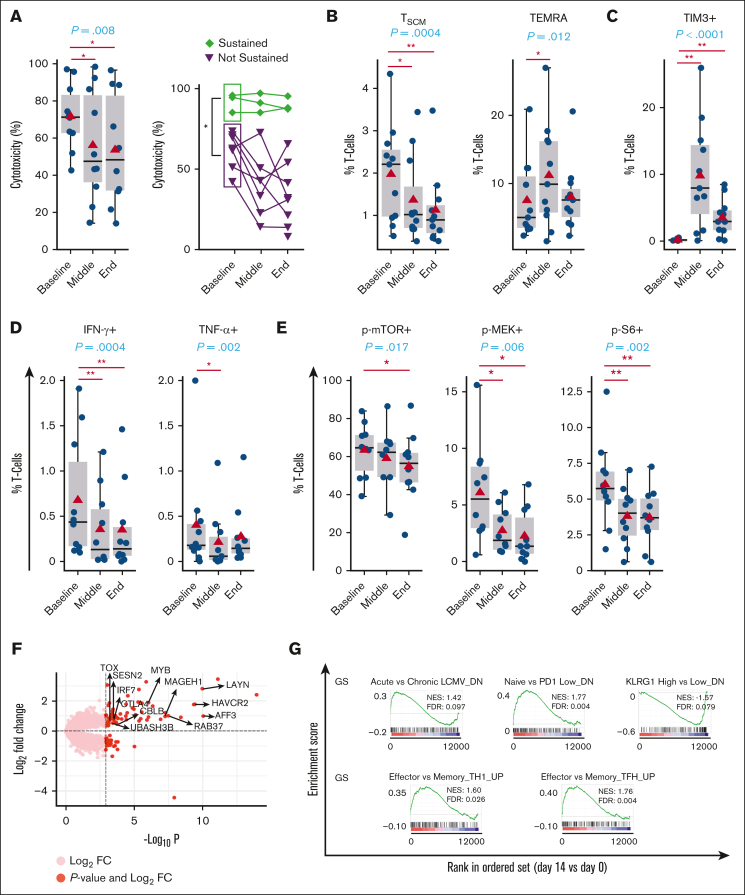
T cells show functional, phenotypic, and transcriptional evidence of dysfunction during continuous blinatumomab. T cells collected at baseline (preblinatumomab), middle (day 14), and end time points (day 28) during a 28-day continuous blinatumomab infusion were analyzed. (A) Left plot: cytotoxicity of T cells. Line graph (right): time point-matched data; each line represents a patient. Green diamonds, cytotoxicity sustained; purple triangles, cytotoxicity not sustained. Vertical bracket: Mann-Whitney test comparison of baseline data. (B-E) Frequency of TSCM, TEMRA, TIM3+, IFN-γ+, TNF-α+, p-mTOR+, p-MEK+, and p-S6+ cells among all T cells. p-S6: marker of mTOR activity. (D-E) Data from intracellular flow cytometry analysis after coculture of T cells and B-ALL cells with CD19/CD3 BiTE antibody. Values relative to control cocultures (positive cells [%]with BiTE − positive [%]without BiTE) are shown. (F) Volcano plot of fold change vs statistical significance from DESeq differential gene expression analysis (day 14 vs day 0). Differentially expressed genes (FDR adjusted P < .15) in dark red. AFF3, a cofactor highly expressed in progenitors of exhausted T cells; LAYN, MAGEH1, genes related to T-regulatory suppressive function; LYST, lysosomal trafficking gene associated with T-cell dysfunction. Dotted vertical line: −log10 P value cutoff for defining differential expression. (G) Gene set enrichment analysis for T-cell exhaustion (acute lymphocytic choriomeningitis virus [LCMV] vs chronic [exhausted T cells] LCMV), TEMRA (naive T cells vs PD1 low [enriched for TEMRA] T cells), terminally differentiated effector (KLRG1 high [terminal effector] vs KLRG low12), and effector gene sets among genes ranked by day 14 vs day 0 expression. (A-E) Box plots: 25th to 75th percentiles. Whiskers: 1.5 × the interquartile range beyond 25th and 75th percentiles. Thick black horizontal line, median; red triangle, mean; blue circles, individual data points. P value (blue): Friedman test (TSCM, TIM3+, IFN-γ+, and TNF-α+) or 1-way repeated-measures analysis of variance (all others). Horizontal line (red): paired t test or Wilcox test (Holm-Sidak correction for multiple comparisons). ∗P < .05; ∗∗P < .01. N = 10 patients for panels A, D, and E and 11 patients for panels B, C, F, and G. DN, down; FDR, false discovery rate; GS, gene set; IFN-γ, interferon gamma; KLRG, killer cell lectin-like receptor subfamily G member; mTOR, mammalian target of rapamycin; NES, normalized enrichment score; PD1, programmed cell death protein 1; Tfh, T follicular helper; Th1, type 1 helper T cell; TNF-α, tumor necrosis factor alpha.
Similar articles
-
[Efficacy of Blinatumomab in the Treatment of Pediatric B-cell Acute Lymphoblastic Leukemia].Zhongguo Shi Yan Xue Ye Xue Za Zhi. 2025 Jun;33(3):698-705. doi: 10.19746/j.cnki.issn.1009-2137.2025.03.011. Zhongguo Shi Yan Xue Ye Xue Za Zhi. 2025. PMID: 40613158 Chinese.
-
Comparison of blinatumomab and CAR T-cell therapy in relapsed/refractory acute lymphoblastic leukemia: a systematic review and meta-analysis.Expert Rev Hematol. 2024 Jan-Mar;17(1-3):67-76. doi: 10.1080/17474086.2023.2298732. Epub 2024 Jan 4. Expert Rev Hematol. 2024. PMID: 38135295
-
Blinatumomab Therapy Is Associated with Favorable Outcomes after Allogeneic Hematopoietic Cell Transplantation in Pediatric Patients with B Cell Acute Lymphoblastic Leukemia.Transplant Cell Ther. 2024 Feb;30(2):217-227. doi: 10.1016/j.jtct.2023.10.024. Epub 2023 Nov 4. Transplant Cell Ther. 2024. PMID: 37931800
-
Safety and Efficacy of Blinatumomab in Japanese Adult and Pediatric Patients with Relapsed/Refractory B-Cell Precursor Acute Lymphoblastic Leukemia: Final Results from an Expansion Cohort.Acta Haematol. 2022;145(6):592-602. doi: 10.1159/000525835. Epub 2022 Jul 5. Acta Haematol. 2022. PMID: 35790143 Clinical Trial.
-
A Systematic Review of Blinatumomab in the Treatment of Acute Lymphoblastic Leukemia: Engaging an Old Problem With New Solutions.Ann Pharmacother. 2021 Oct;55(10):1236-1253. doi: 10.1177/1060028020988411. Epub 2021 Jan 13. Ann Pharmacother. 2021. PMID: 33435716
Cited by
-
T cell exhaustion in pediatric B-ALL: current knowledge and future perspectives.Front Immunol. 2025 May 28;16:1531145. doi: 10.3389/fimmu.2025.1531145. eCollection 2025. Front Immunol. 2025. PMID: 40503229 Free PMC article. Review.
References
-
- Topp MS, Kufer P, Gökbuget N, et al. Targeted therapy with the T-cell-engaging antibody blinatumomab of chemotherapy-refractory minimal residual disease in B-lineage acute lymphoblastic leukemia patients results in high response rate and prolonged leukemia-free survival. J Clin Oncol. 2011;29(18):2493–2498. - PubMed
-
- Jabbour EJ, Short NJ, Jain N, et al. Blinatumomab is associated with favorable outcomes in patients with B-cell lineage acute lymphoblastic leukemia and positive measurable residual disease at a threshold of 10-4 and higher. Am J Hematol. 2022;97(9):1135–1141. - PubMed
-
- Brown PA, Ji L, Xu X, et al. Effect of postreinduction therapy consolidation with blinatumomab vs chemotherapy on disease-free survival in children, adolescents, and young adults with first relapse of B-cell acute lymphoblastic leukemia: a randomized clinical trial. JAMA. 2021;325(9):833–842. - PMC - PubMed
-
- Jabbour E, Düll J, Yilmaz M, et al. Outcome of patients with relapsed/refractory acute lymphoblastic leukemia after blinatumomab failure: no change in the level of CD19 expression. Am J Hematol. 2018;93(3):371–374. - PubMed
LinkOut - more resources
Full Text Sources
