. 2025 Aug 12;9(15):3676-3688.
doi: 10.1182/bloodadvances.2023012166.

Genetic deregulation of REL in germinal center B cells induces generation of a pool of lymphoma precursor cells

Affiliations

Genetic deregulation of REL in germinal center B cells induces generation of a pool of lymphoma precursor cells

Léa Prévaud et al. Blood Adv. .

Abstract

In diffuse large B-cell lymphomas (DLBCLs), gains and amplifications of the 2p15-16 region, which always encompass the REL gene, are mostly restricted to the germinal center (GC) B-cell DLBCL subtype (GCB-DLBCL) for which c-Rel is the pivotal Rel/NF-κΒ subunit. Although REL plays a key role in the GC reaction, its contribution to GCB-DLBCLs remains unclear.To understand the role of REL in the very first steps of GCB transformation, that is, when B cells with deregulated REL are competing with other B cells during chronic antigenic stimulation, we have created a dual-color mouse model that allows to induce REL in a limited pool of activation-induced cytidine deaminase (AID)-imprinted B cells after immunization and to differentially stain AID-imprinted B cells that overexpress REL or not. Dysregulation of REL in AID-imprinted B cells was associated with nuclear c-Rel overexpression in GCs 14 days after immunization. Dysregulation of REL at the GCB stage promoted GCB expansion, which was associated with both class-switch recombination and plasma cell differentiation. REL overexpression conferred a long-term competitive advantage, allowing GC persistence and continuous recirculation of REL-overexpressing B cells. IgHV dominance was increased at the messenger RNA level in REL-overexpressing B cells and clonal expansion was detected at the DNA level in some cases. Highlighting the role of the immune response, our results demonstrate the advantage conferred by REL in the GC competition and provide evidence that, as an oncogenic event of GCBs, its genetic deregulation induces the generation of a long-term pool of lymphoma precursor cells.


Conflict of interest statement

Conflict-of-interest disclosure: The authors declare no competing financial interests.

Figures

None
Graphical abstract
Figure 1.
Figure 1.
Characterization of the REL-AID mouse model. (A) Schematic representation of the REL-IRES-YFP and tdTomato inserts into the Rosa26 locus: the REL sequence was placed in frame with the IRES and the coding sequence for YFP. On the same chromosome 6 bearing tdTomato trangene, Creert2 was inserted into Aicda locus. (B) Schematic diagram of SRBC (red arrow) and tamoxifen (black arrow) administration protocol for mouse analysis (green arrow) at different time points after immunizations. Blood samples were collected on D14 and then each month, always before immunization boost (blue arrow). (C) Example of a flow cytometry biparametric YFP and tdTomato (TOM) histogram gated on live B220pos B cells. TOM+/YFP and TOM+/YFP+ B cells are colored in red and green, respectively. PB cells were collected from an AID-TOM (left) or a REL-AID (right) mouse 14 day after immunization and tamoxifen gavage. Percentages of fluorescent cells are shown in each graph. (D) Relationship between the percentage of TOM+/YFP+ among total TOM+ B cells (x-axis) and that of TOM+ B cells among total B220+ B cells (y-axis) in REL-AID mice on D14. The correlation curve is shown in red. The value of the Pearson correlation coefficient r with its P value is shown in the graph. Each experiment has been done at least 4 times.
Figure 2.
Figure 2.
Histological analysis of spleen section from REL-AID mouse model. Epifluorescence analysis of 10 μm adjacent spleen cryosections for YFP and tdTomato (TOM) fluorescence together with fluorescent immunolabeling of PNA (A), IgD (B), c-Rel (REL) (C), as well c-Rel isotypic control (Iso) and Ki67 (D) for a REL-AID mouse. All cryosections were counterstained with DAPI. DAPI, YFP, and tdTomato fluorescence were colorized in blue, green, and red, respectively. Fluorescence of PNA, IgD, c-Rel, Iso, and Ki67 markers was colorized in white. For panels A-C, the merged fluorescence for Dapi/YFP/tdTomato/antibody fluorescence is shown in the large image on the left, whereas the small images on the right show the separate fluorescence for the antibody, YFP, and tdTomato (top, middle, and bottom image, respectively). In panels B and C, the red arrow points on a GC predominantly colonized by TOM+/YFP B cells. (D) shows the fluorescence labeling of the GC pointed by the yellow arrow on panel C. The top images are for c-Rel Iso, c-Rel (REL), and Ki67. Below are images for separate fluorescence of YFP and tdTomato. The bottom image merges Dapi, antibody, YFP, and tdTomato fluorescence. Scale bars are inserted in each merged image.
Figure 3.
Figure 3.
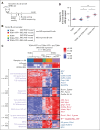
mRNA sequencing analysis of AID-TOM and REL-AID mouse spleen (SP) B cells after the second SRBC boost according to the expression of the tdTomato and YFP transgenes. (A) Schematic representation of the mouse immunization protocol. AID-TOM and REL-AID mice were submitted to a tamoxifen gavage at day D0, D2, D4 together with an SRBC immunization at d0. SRBC immunization boosts were done at M1 and M2. Animals were sacrificed 10 days after immunization. (B) Color code of the 5 CD19+ B-cell subsets sorted by fluorescence-activated cell sorter for RNA extraction and mRNAseq (see ”Materials and methods” and “Results”): TOM+ and TOM cells from AID-TOM mice, and TOM/YFP, TOM+/YFP and TOM+/YFP+ cells from REL-AID mice. In total, 30 B-cell samples from 14 mice were collected that were a priori classified as non–AID-imprinted (TOM, n = 6 and TOM/YFP, n = 8) and AID-imprinted B cells (TOM+, n = 6; TOM+/YFP, n = 3, and TOM+/YFP+, n = 7). (C) Color heatmaps for expression of tdTomato, YFP, and KOZAK-REL junction and for differential gene expression between TOM+/YFP+ and TOM+/YFP plus TOM+ B-cell samples. After unsupervised clustering of both genes and samples, 5 clusters of genes were identified, numbered C1 to C5 from the bottom to the top. On the left side, some key functions related to Gene Ontology annotations are shown for each cluster. On the right side are highlighted some key genes for each cluster. The number n of genes is given for each cluster in the heat map. Being immediately adjacent, the YFP and KOZAK-REL transgenes are in bold and underlined and are placed at their exact position in the clustering. (D) Frequency of the most abundant IgHV segment for each B-cell sample (ie, mRNA IgHV dominance). Mean and standard error of the mean are shown for each group of samples by a red and 2 black lines, respectively. ∗Mann Whitney P <.05; ∗∗∗Mann Whitney P <10–3. mRNAseq, mRNA high-throughput sequencing. SD, standard deviation.
Figure 4.
Figure 4.
Relationships between the kinetics of PB TOM+ and TOM+/YFP+ with CD80 expression. (A) Box plot of the mean percentage (± standard error of the mean) of PB TOM+ cells among live B cells (CD19+ B220+/−) in AID-TOM and REL-AID mice over time post-tamoxifen induction. The dashed red line indicates the end of immunization boost. The P value of a 2-way analysis of variance (ANOVA) for REL effect is shown. (B) Relationship between the percentage of TOM+/YFP+ among total TOM+ B cells (x-axis) and that of TOM+ B cells among total B220+ B cells (y-axis) in REL-AID mice at month 2 (top graph) and month 12 (bottom graph). The correlation curve is shown in red. The values of the Pearson correlation coefficient r and of its P values are given in each graph. (C) Distribution of the percentage of TOM+/YFP+ B cells among total TOM+ B cells over time in REL-AID mice. The red dot represents the mouse with the highest percentage and green dot the mouse with the lowest percentage. The dashed red line indicates the end of immunization boost. Mean, standard error of the mean, and number n of mice are indicated above the graph. The P value of the 1-way ANOVA for time effect is shown. (D) CD80 expression levels in TOM+/YFP B cells from either AID-TOM and REL-AID mice as well as TOM+/YFP+ B cells from REL-AID mouse model. Mean and SEM are shown for each B-cell sample by a red and 2 black lines, respectively. Mann Whitney test P values are shown. Each experiment has been done at least 4 times. MFI, mean fluorescence intensity.
Figure 5.
Figure 5.
Relationship between the levels of TOM+ and TOM+/YFP+ B cells in secondary lymphoid organs and in the BM. (A-B) Schematic representation of the induction and immunization protocol for analysis either mid-term (A) or long-term (B) cohorts. (C-D) Analysis of TOM+ and TOM+/YFP+ B cells in secondary lymphoid organs for the mid-term (C) and long-term (D) cohorts for AID-TOM control (left) and REL-AID mice (right) in the SP, LN, BM, and in the IP. Top: percentage of TOM+ B cells among total live B cells (CD19+ B220+/−). Bottom: percentage of TOM+/YFP+ B cells among TOM+ B cells. In panel C, the case with a diffuse aggressive B-cell lymphoma is indicated by an arrow. Mean and SEM are shown by a red and 2 black lines, respectively. The P value of a 2-way ANOVA for REL effect is shown on the top of the graph. Each experiment has been done at least 4 times. BM, bone marrow; LN, lymph nodes; IP, peritoneum.
Figure 6.
Figure 6.
Analysis of splenic GC, IgG1 class switched B cells, and PC differentiation after the fifth immunization boost. (A) Schematic representation of the induction and immunization protocol for the mid-term cohort. (B) Strategy for gating TOM+ B cells from TOM-AID mice (upper panel) and TOM+/YFP and TOM+/YFP+ from REL-AID mice (lower panel) as well as GCBs from total CD19+ live B cells (CD19+ B220+/−). (C) Percentage of GCBs among TOM+ B cells in AID-TOM control and REL-AID mice. Mean and SEM are shown by a red and 2 black lines, respectively. The P value of the Mann-Whitney test is shown. (D) Percentage of TOM+/YFP+ B cells in the total TOM+ (left) or in the GCB (right) fraction in REL-AID mice. Each line connects the points for 1 mouse. The P value of the paired Wilcoxon test is shown. (E) Example of gating on IgM/IgD double-negative (DN) B cells in both AID-TOM (upper) and REL-AID (lower) mice. (F) Analysis of DN B cells in both AID-TOM and REL-AID mice. Upper: ratio of DN/IgM+ cells among total TOM+ B cells in AID-TOM and REL-AID mice. Lower: percentages of YFP+ B cells among TOM+ B cells in the total TOM+ and in the DN B-cell fraction in REL-AID mice (each line connects the points for 1 mouse). The P values of the Mann-Whitney (upper) and paired Wilcoxon test (lower) are shown. (G) Example IgG1 class switched B-cells gating for AID-TOM (upper) and REL-AID (lower) mice. (H) Analysis of IgG1+ B cells in both AID-TOM and REL-AID mice. Left: percentages of IgG1+ (also IgM and IgD) B cells among TOM+ B cells in AID-TOM and REL-AID mice. Right: percentages of YFP+ B cells among total TOM+ and IgG1+ B cells (each line connects the points for 1 mouse). The P values of the Mann-Whitney (upper) and paired Wilcoxon test (lower) are shown. Each experiment has been done at least 4 times.
Figure 7.
Figure 7.
Analysis of splenic PCs shortly after immunization. (A) Example of gating on PCs in AID-TOM (upper) and REL-AID (lower) mice from the mid-term cohort (also refer to Figure 5A). Red colored cells are TOM+ B cells only and green colored cells are TOM+YFP+ B cells (same gating of the first 2 cytogram in Figure 5B). (B) Percentages of PCs among total TOM+ B cells in AID-TOM and REL-AID mice (upper) and percentages of YFP+ among TOM+ B cells in the total TOM+ and in the PC fraction in REL-AID mice (each line connects the points for 1 mouse) (lower). Mean and standard error of the mean are shown by a red and 2 black lines, respectively. The P values of the Mann-Whitney (upper) and paired Wilcoxon (lower) test are shown. ns, nonsignificant.

References

    1. Simek S, Rice NR. Detection and characterization of the protein encoded by the chicken c-rel protooncogene. Oncogene Res. 1988;2(2):103–119. - PubMed
    1. Blank V, Kourilsky P, Israël A. NF-kappa B and related proteins: Rel/dorsal homologies meet ankyrin-like repeats. Trends Biochem Sci. 1992;17(4):135–140. - PubMed
    1. Jerkeman M, Hallek M, Dreyling M, Thieblemont C, Kimby E, Staudt L. Targeting of B-cell receptor signalling in B-cell malignancies. J Intern Med. 2017;282(5):415–428. - PubMed
    1. Pasqualucci L, Klein U. NF-κB mutations in germinal center B-cell lymphomas: relation to NF-κB function in normal B cells. Biomedicines. 2022;10(10):2450. - PMC - PubMed
    1. Faumont N, Taoui O, Collares D, et al. c-Rel is the pivotal NF-κB subunit in germinal center diffuse large B-cell lymphoma: a LYSA study. Front Oncol. 2021;11 - PMC - PubMed

MeSH terms

Substances