. 2025 Jul;643(8070):230-240.
doi: 10.1038/s41586-025-09025-8. Epub 2025 Apr 23.

Geographic and age variations in mutational processes in colorectal cancer

Marcos Díaz-Gay #  1   2   3   4 Wellington Dos Santos #  5 Sarah Moody #  6 Mariya Kazachkova  1   3   7 Ammal Abbasi  1   2   3 Christopher D Steele  1   2   3 Raviteja Vangara  1   2   3 Sergey Senkin  5 Jingwei Wang  6 Stephen Fitzgerald  6 Erik N Bergstrom  1   2   3 Azhar Khandekar  1   2   3   8 Burçak Otlu  1   2   3   9 Behnoush Abedi-Ardekani  5 Ana Carolina de Carvalho  5 Thomas Cattiaux  5 Ricardo Cortez Cardoso Penha  5 Valérie Gaborieau  5 Priscilia Chopard  5 Christine Carreira  10 Saamin Cheema  6 Calli Latimer  6 Jon W Teague  6 Anush Mukeriya  11 David Zaridze  11 Riley Cox  12 Monique Albert  12   13 Larry Phouthavongsy  12 Steven Gallinger  14 Reza Malekzadeh  15 Ahmadreza Niavarani  15 Marko Miladinov  16 Katarina Erić  17 Sasa Milosavljevic  18 Suleeporn Sangrajrang  19 Maria Paula Curado  20 Samuel Aguiar  21 Rui Manuel Reis  22   23 Monise Tadin Reis  24 Luis Gustavo Romagnolo  25 Denise Peixoto Guimarães  26 Ivana Holcatova  27   28 Jaroslav Kalvach  29   30   31   32 Carlos Alberto Vaccaro  33 Tamara Alejandra Piñero  33 Beata Świątkowska  34 Jolanta Lissowska  35 Katarzyna Roszkowska-Purska  36 Antonio Huertas-Salgado  37 Tatsuhiro Shibata  38   39 Satoshi Shiba  39 Surasak Sangkhathat  40   41   42 Taned Chitapanarux  43 Gholamreza Roshandel  44 Patricia Ashton-Prolla  45   46 Daniel C Damin  47 Francine Hehn de Oliveira  48 Laura Humphreys  6 Trevor D Lawley  49 Sandra Perdomo  5 Michael R Stratton  6 Paul Brennan  5 Ludmil B Alexandrov  50   51   52   53
Affiliations

Geographic and age variations in mutational processes in colorectal cancer

Marcos Díaz-Gay et al. Nature. 2025 Jul.

Abstract

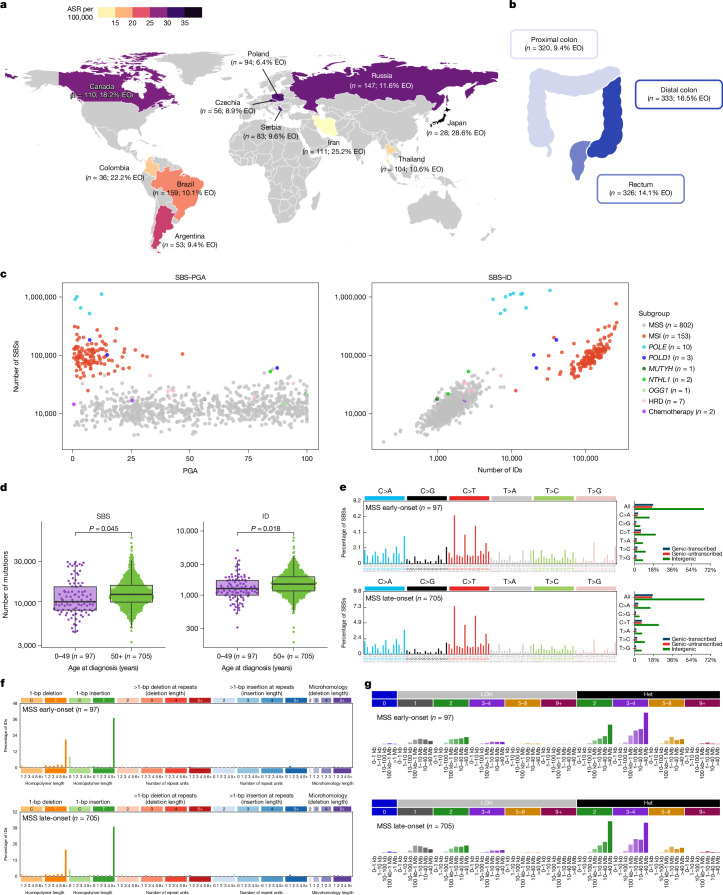
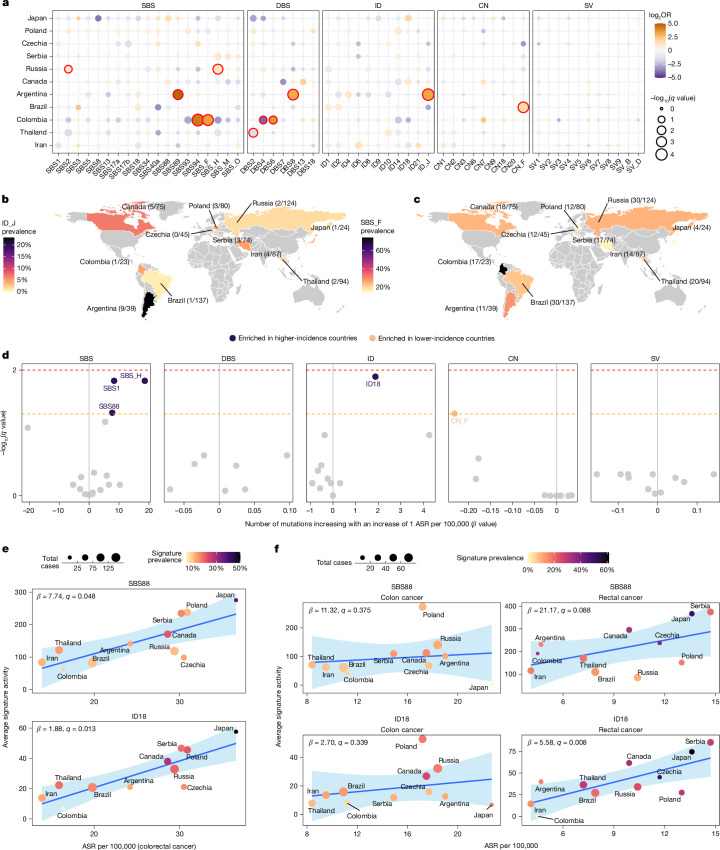
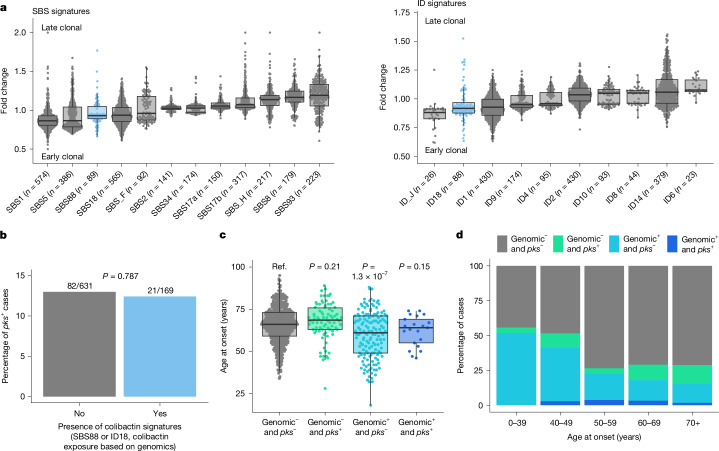
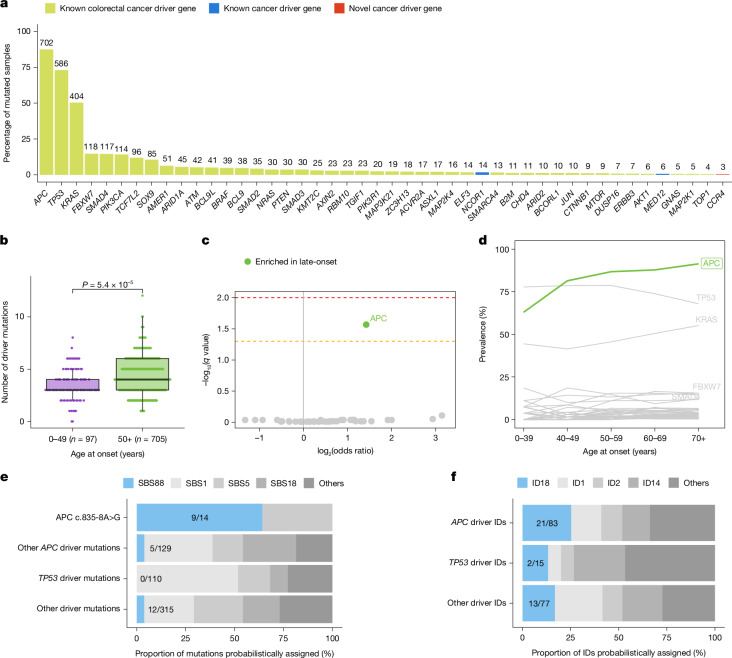
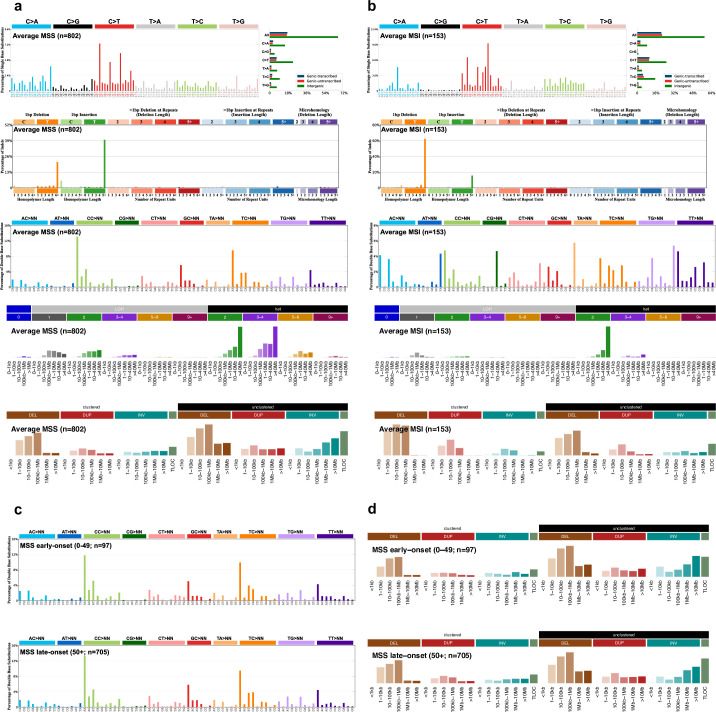
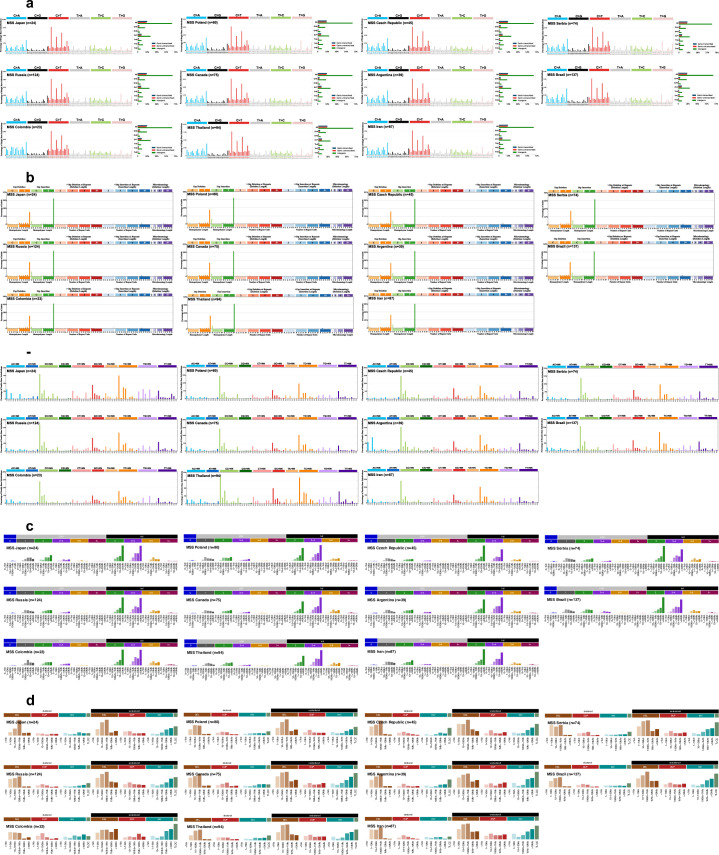
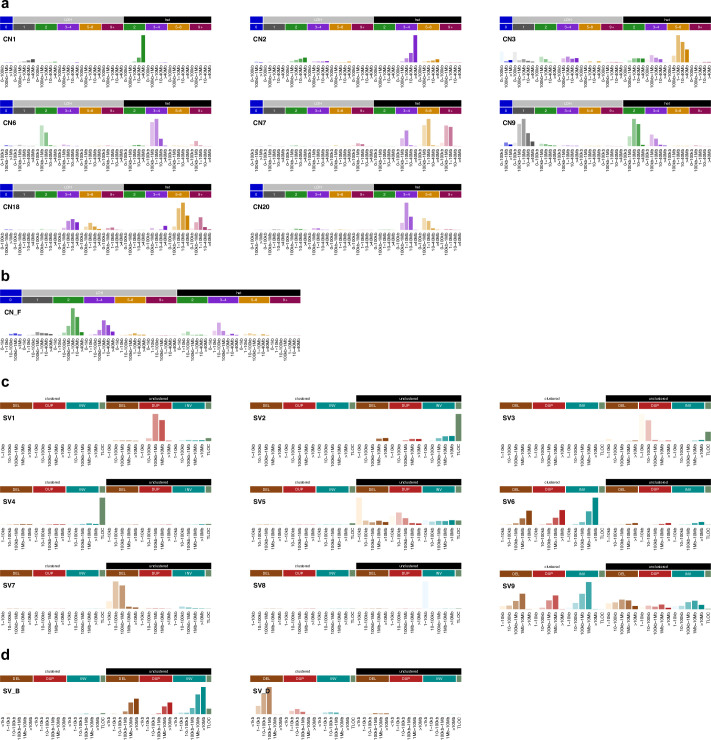
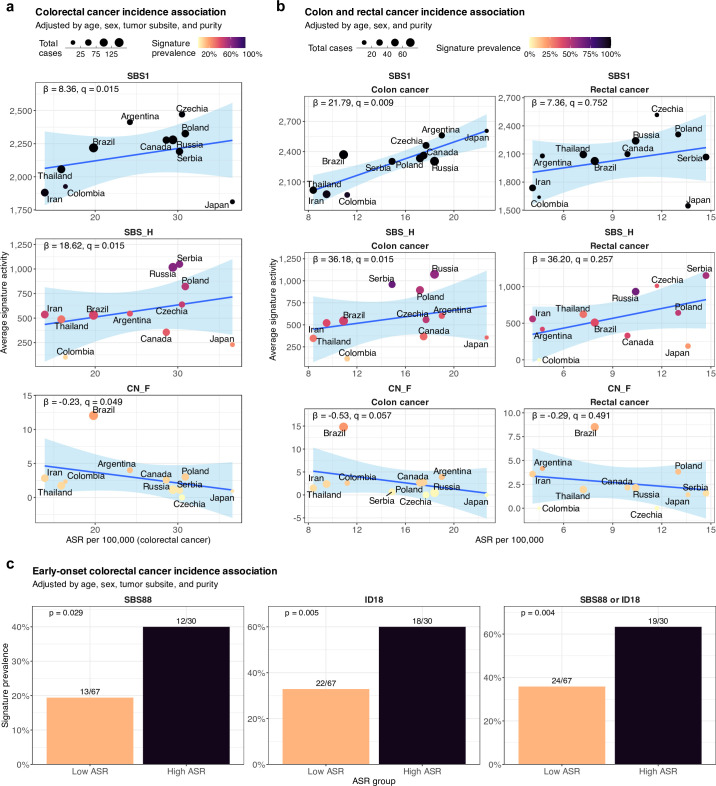
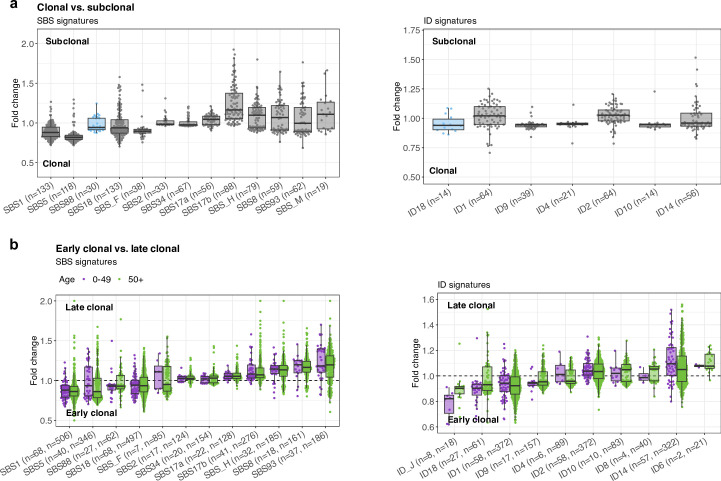
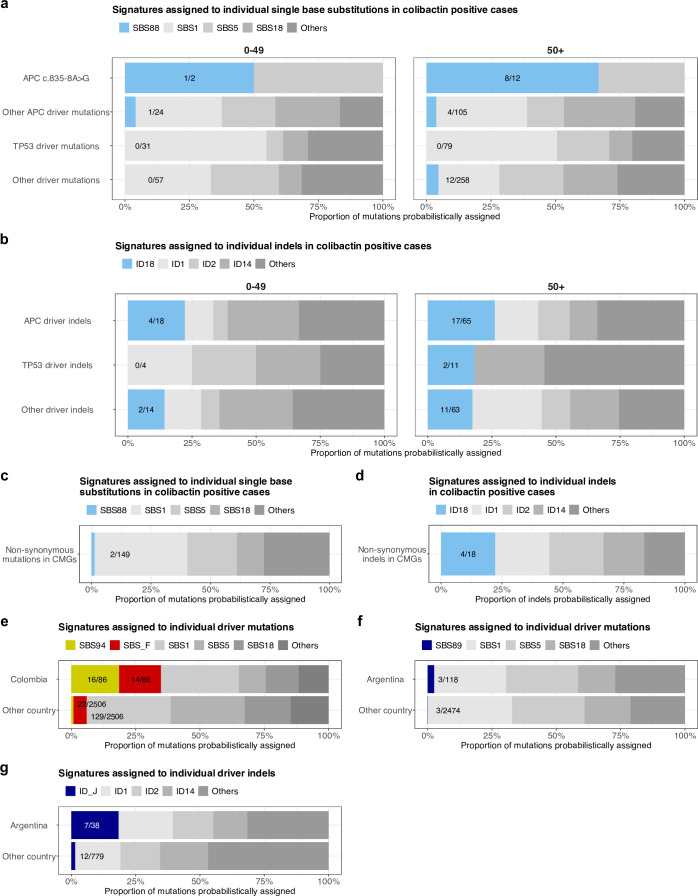
Incidence rates of colorectal cancer vary geographically and have changed over time1. Notably, in the past two decades, the incidence of early-onset colorectal cancer, which affects individuals below 50 years of age, has doubled in many countries2-5. The reasons for this increase are unknown. Here we investigate whether mutational processes contribute to geographic and age-related differences by examining 981 colorectal cancer genomes from 11 countries. No major differences were found in microsatellite-unstable cancers, but variations in mutation burden and signatures were observed in the 802 microsatellite-stable cases. Multiple signatures, most with unknown aetiologies, exhibited varying prevalence in Argentina, Brazil, Colombia, Russia and Thailand, indicating geographically diverse levels of mutagenic exposure. Signatures SBS88 and ID18, caused by the bacteria-produced mutagen colibactin6,7, had higher mutation loads in countries with higher colorectal cancer incidence rates. SBS88 and ID18 were also enriched in early-onset colorectal cancers, being 3.3 times more common in individuals who were diagnosed before 40 years of age than in those over 70 years of age, and were imprinted early during colorectal cancer development. Colibactin exposure was further linked to APC driver mutations, with ID18 being responsible for about 25% of APC driver indels in colibactin-positive cases. This study reveals geographic and age-related variations in colorectal cancer mutational processes, and suggests that mutagenic exposure to colibactin-producing bacteria in early life may contribute to the increasing incidence of early-onset colorectal cancer.


Conflict of interest statement

Competing interests: L.B.A. is a co-founder, chief scientific officer, scientific advisory member and consultant for, has equity in and receives income from io9. The terms of this arrangement have been reviewed and approved by the University of California, San Diego in accordance with its conflict of interest policies. L.B.A. is also a compensated member of the scientific advisory board of Inocras. L.B.A.’s spouse is an employee of Hologic, Inc. E.N.B. is a consultant for, has equity in, and receives income from io9. A.A. and L.B.A. declare US provisional patent application filed with UCSD with serial number 63/366,392. E.N.B. and L.B.A. declare US provisional patent application filed with UCSD with serial number 63/269,033. L.B.A. also declares US provisional applications filed with UCSD with serial numbers 63/289,601 and 63/412,835, as well as international patent application PCT/US2023/010679. L.B.A. is also an inventor on US Patent 10,776,718 for source identification by non-negative matrix factorization. M.R.S. is founder, consultant, and stockholder for Quotient Therapeutics. L.B.A., M.D.-G., P.B., S.P., M.R.S. and S. Moody declare a European patent application with application number EP25305077.7. T.D.L. is a co-founder and CSO of Microbiotica. All other authors declare no competing interests.

Figures

Fig. 1
Fig. 1. Geographic, clinical and molecular characterization of the Mutographs colorectal cancer cohort.
a, Geographic distribution of the 981 patients with primary colorectal cancer across 4 continents and 11 countries, indicating the total number of cases and the percentage of early-onset cases (EO; onset before 50 years of age). Countries were coloured according to their ASR per 100,000 individuals. b, Tumour subsite distribution of the cohort across the colorectum (two cases had unspecified subsites). Subsites were coloured according to the percentage of early-onset cases. c, Distribution of molecular subgroups according to the total number of SBSs, IDs and percentage of genome aberrated (PGA). Cases for which tumour purity was insufficient to determine an accurate copy number profile or without large CNs (65 out of 981 cases) were excluded from the SBS–PGA panel. d, Distribution of SBS and ID across early-onset (less than 50 years of age; purple) and late-onset (aged 50 years or older; green) MSS colorectal tumours. Statistically significant differences were evaluated using multivariable linear regression models adjusted by sex, country, tumour subsite and tumour purity. In box plots, the horizontal line indicates the median, the upper and lower ends of the box indicate the 25th and 75th percentiles. Whiskers show 1.5 × the interquartile range, and values outside the whiskers are shown as individual data points. eg, Average mutational profiles of early- and late-onset MSS tumours for SBSs (SBS-288 mutational context (e)), IDs (ID-83 (f)) and CNs (CN-68 (g)). Het, heterozygous; LOH, loss of heterozygosity.
Fig. 2
Fig. 2. Geographic variation of mutational signatures in MSS colorectal cancers.
a, Variation of signature prevalence in specific countries compared to all others. Statistically significant enrichments were evaluated using multivariable logistic regression models adjusted by age of diagnosis, sex, tumour subsite and tumour purity. Firth’s bias-reduced logistic regressions were used for regression presenting complete or quasi-complete separation. Data points were coloured according to the odds ratio (OR), with size representing statistical significance. P values were adjusted for multiple comparisons using the Benjamini–Hochberg method based on the total number of signatures considered per variant type and the total number of countries assessed, and reported as q values. q values <0.05 were considered statistically significant and marked in red. b,c, Geographic distribution of the ID_J (b) and SBS_F (c) mutational signatures. Countries were coloured on the basis of signature prevalence. d, Association of signature activities with ASR. Statistically significant associations were evaluated using multivariable linear regression models adjusted by age of diagnosis, sex, tumour subsite and tumour purity. P values were adjusted for multiple comparisons using the Benjamini–Hochberg method based on the total number of signatures considered per variant type and reported as q values. Dashed lines indicate q values of 0.05 (orange) and 0.01 (red). e,f, Association of the mutations attributed to the SBS88 and ID18 mutational signatures with ASR across countries for colorectal cancer (e) and, independently, for colon and rectal cancers (f). Data points were coloured on the basis of signature prevalence, with size indicating the total number of cases per country. Statistically significant associations were evaluated using the sample-level multivariable linear regression models used in d (e) and similar models adjusted by age of diagnosis, sex and tumour purity (f). Blue lines and bands indicate univariate linear regressions and 95% confidence intervals for average signature activity versus ASR.
Fig. 3
Fig. 3. Variation of mutational signatures with age of onset in MSS colorectal cancers.
a, Enrichment of signature prevalence in early-onset and late-onset cases. Statistical significance was evaluated using multivariable logistic regression models for age of onset categorized in two subgroups (less than 50 years of age and more than 50 years of age) and adjusted by sex, country, tumour subsite and tumour purity. Firth’s bias-reduced logistic regressions were used for regression presenting complete or quasi-complete separation. P values were adjusted for multiple comparisons using the Benjamini–Hochberg method based on the total number of mutational signatures considered per variant type and reported as q values. Dashed lines indicate q values of 0.05 (orange) and 0.01 (red). b, Signature prevalence trend across ages of onset. Signatures significantly enriched in early-onset or late-onset cases (from a) were coloured in purple and green, respectively. c, Signature prevalence across age groups. Statistically significant trends were evaluated using multivariable logistic regression models for age categorized in five subgroups (0–39, 40–49, 50–59, 60–69 and ≥70 years) and similar adjustments as in a, with Firth’s bias-reduced regressions for complete or quasi-complete separation cases. d,e, Age of onset variation according to the presence (n = 169) or absence (n = 633) of colibactin signatures (SBS88, ID18 or both) in all cases (d) and across tumour subsites, including proximal colon (n = 17, n = 172), distal colon (n = 61, n = 237) and rectum (n = 91, n = 224) (e). Statistically significant differences were evaluated using multivariable linear regression models adjusted by sex, country, tumour purity and tumour subsite (only for the analysis of all cases (d)). P values in e were adjusted for multiple comparisons based on the three tumour subsites considered and reported as q values. In box plots, the horizontal line indicates the median, the upper and lower ends of the box indicate the 25th and 75th percentiles. Whiskers show 1.5 × the interquartile range, and values outside the whiskers are shown as individual data points.
Fig. 4
Fig. 4. Colibactin mutagenesis as an early event in MSS colorectal cancer evolution.
a, Fold change of the relative contribution per sample of each signature between early clonal and late clonal SBSs (left) and IDs (right). SBS signatures that contribute early and late clonal SBSs in fewer than 50 samples were excluded from the analysis. Similarly, ID signatures that contribute early and late clonal IDs in fewer than 20 samples were also excluded. Signatures were sorted by median fold change. b, Lack of concordance between colibactin exposure status determined by the presence of colibactin-induced signatures SBS88 or ID18, and the microbiome pks status. Statistical significance was evaluated using a multivariable Firth’s bias-reduced logistic regression model (due to quasi-complete separation) adjusted by age of diagnosis, sex, country, tumour subsite and tumour purity. c,d, Distribution of age of onset (c) and cases across age groups (d) based on the detection of colibactin-positive samples using genomic and microbiome status. The genomic status is defined by the presence of SBS88 or ID18; the microbiome status (pks) is determined by coverage of at least half of the pks island, and suggests ongoing or active pks+ bacterial infection (genomic pks n = 549, genomic pks+ n = 82, genomic+ pks n = 148, genomic+ pks+ n = 21). Statistical significance was evaluated using a multivariable linear regression model adjusted by sex, country, tumour subsite and tumour purity. In box plots, the horizontal line indicates the median, the upper and lower ends of the box indicate the 25th and 75th percentiles. Whiskers show 1.5 × the interquartile range, and values outside the whiskers are shown as individual data points.
Fig. 5
Fig. 5. Variation of driver mutations with age of onset and association with colibactin mutagenesis in MSS colorectal cancers.
a, Prevalence of driver mutations affecting the 48 detected driver genes. Genes were coloured according to their status as known cancer driver genes for colorectal cancer, known cancer driver genes for other cancer types or newly detected cancer driver genes. b, Distribution of total driver mutations across early-onset and late-onset tumours. Statistical significance was evaluated using a multivariable linear regression model adjusted by sex, country, tumour subsite and tumour purity. In box plots, the horizontal line indicates the median, the upper and lower ends of the box indicate the 25th and 75th percentiles. Whiskers show 1.5 × the interquartile range, and values outside the whiskers are shown as individual data points. c, Enrichment of driver mutations in cancer driver genes in early-onset and late-onset cases. Statistically significant enrichments were evaluated using multivariable logistic regression models adjusted by sex, country, tumour subsite and tumour purity. Firth’s bias-reduced logistic regressions were used for regressions presenting complete or quasi-complete separation. P values were adjusted for multiple comparisons using the Benjamini–Hochberg method based on the total number of cancer driver genes and reported as q values. Dashed lines indicate q values of 0.05 (orange) and 0.01 (red). d, Prevalence of driver mutations in cancer driver genes across ages of onset. Cancer driver genes significantly enriched in late-onset cases (as shown in c) were coloured in green. e,f, Proportion of driver mutations probabilistically assigned to colibactin-induced and other SBS (e) and ID (f) signatures. Driver mutations were divided into different groups, including APC c.835-8A>G splicing-associated driver mutation, as well as driver mutations affecting APC, TP53 and other cancer driver genes.
Extended Data Fig. 1
Extended Data Fig. 1. Mutational profiles across molecular subtypes and ages of onset.
a-b, Average mutational profiles of microsatellite stable (MSS; a) and microsatellite unstable (MSI; b) colorectal tumors for single base substitutions (SBS-288 mutational context), small insertions and deletions (ID-83 mutational context), doublet base substitutions (DBS-78 mutational context), copy number alterations (CN-68 mutational context), and structural variants (SV-38 mutational context). c-d, Average mutational profiles of early-onset and late-onset MSS colorectal tumors for doublet base substitutions (c) and structural variants (d).
Extended Data Fig. 2
Extended Data Fig. 2. Geographic distribution of mutation burden.
Box plots indicating the distribution of single base substitutions (SBS), small insertions and deletions (ID), doublet base substitutions (DBS), copy number alterations (CN), and structural variants (SV) across countries for microsatellite stable (MSS) colorectal tumors. Box plots and data points representing total number of mutations for each variant type were colored according to each country’s colorectal cancer age-standardized incidence rates (ASR) per 100,000 individuals. A horizontal blue line indicates the median mutation burden for each variant type. Statistically significant differences were evaluated using multivariable linear regression models comparing each country to all others and adjusted by age of diagnosis, sex, tumor subsite, and tumor purity. P-values were adjusted for multiple comparisons using the Benjamini-Hochberg method based on the total number of countries assessed and reported as q-values. The line within the box indicates the median, while the upper and lower ends indicate the 25th and 75th percentiles. Whiskers show 1.5 × interquartile range, and values outside are shown as individual data points.
Extended Data Fig. 3
Extended Data Fig. 3. Geographic distribution of mutational profiles.
a-e, Average mutational profiles of microsatellite stable (MSS) colorectal tumors for single base substitutions (SBS-288 mutational context; a), small insertions and deletions (ID-83 mutational context; b), doublet base substitutions (DBS-78 mutational context; c), copy number alterations (CN-68 mutational context; d), and structural variants (SV-38 mutational context; e).
Extended Data Fig. 4
Extended Data Fig. 4. Mutational signatures of small mutational events identified in microsatellite stable colorectal cancers.
a-c, Mutational profiles of single base substitution (SBS) signatures, including COSMICv3.4 reference signatures (a), previously reported signatures not present in COSMIC (b), and novel signature SBS_O (c). d-e, Mutational profiles of small insertions and deletions (ID) signatures, including COSMICv3.4 signatures (d) and novel signature ID_J (e). f, Mutational profiles of doublet base substitution (DBS) signatures, all previously reported in COSMIC.
Extended Data Fig. 5
Extended Data Fig. 5. Mutational signatures of large mutational events identified in microsatellite stable colorectal cancers.
a-b, Mutational profiles of copy number (CN) signatures, including COSMICv3.4 reference signatures (a) and novel signature CN_F (b). c-d, Mutational profiles of structural variant (SV) signatures, including COSMIC signatures (c) and novel signatures SV_B and SV_D (d).
Extended Data Fig. 6
Extended Data Fig. 6. Association of mutational signatures with colorectal, colon, and rectal cancer incidence rates.
a-b, Scatter plots indicating the association of the mutations attributed to signatures SBS1, SBS_H, and CN_F with the age-standardized incidence rates across countries for colorectal cancers (a), and independently for colon and rectal cancer (b). Data points were colored based on signature prevalence, with their size indicating the total number of cases per country. Statistically significant associations were evaluated using the sample-level multivariable linear regression models used in Fig. 2d (a), and similar multivariable linear regression models adjusted by age of diagnosis, sex, and tumor purity (b). Blue lines and bands indicate univariate linear regressions and 95% confidence intervals for average signature activity vs. ASR. c, Bar plots indicating mutational signature prevalence enrichment between low and high ASR countries (defined as those below or above an ASR of 7 per 100,000 people, for early-onset colorectal cancer, diagnosed between 20 and 49 years old). Statistically significant associations were evaluated using multivariable logistic regression models for early-onset colorectal cancer ASR adjusted by age of diagnosis, sex, tumor subsite, and tumor purity.
Extended Data Fig. 7
Extended Data Fig. 7. Enrichment of colibactin mutagenesis in early-onset colorectal cancers based on motif analysis.
a, Box plots indicating the percentage of total W[T > N]W mutations with the WAWW[T > N]W motif across different age groups (0–39 n = 27, 40−49 n = 70, 50–59 n = 136, 60–69 n = 279, 70+ n = 290). Statistically significant trend was evaluated using a multivariable linear regression model adjusted by sex, country, tumor subsite, and tumor purity. The line within the box indicates the median, while the upper and lower ends indicate the 25th and 75th percentiles. Whiskers show 1.5 × interquartile range, and values outside are shown as individual data points. b, Box plots indicating the percentage of total W[T > N]W mutations with the WAWW[T > N]W motif across samples grouped by colibactin exposure status, determined by the presence (n = 169) or absence (n = 633) of signatures SBS88 or ID18. Statistical significance was evaluated using a multivariable linear regression model adjusted by age, sex, country, tumor subsite, and tumor purity. The line within the box indicates the median, while the upper and lower ends indicate the 25th and 75th percentiles. Whiskers show 1.5 × interquartile range, and values outside are shown as individual data points. c, Bar plots indicating the prevalence of colibactin exposure across age groups, with indication of the total number of cases where colibactin signatures were detected. Statistically significant trend was evaluated using a multivariable logistic regression model adjusted by sex, country, tumor subsite, and tumor purity.
Extended Data Fig. 8
Extended Data Fig. 8. Enrichment of colibactin mutagenesis as an early clonal event in early-onset and late-onset colorectal cancers.
a, Box plots indicating the fold-change of the relative contribution per sample of each signature between clonal and subclonal single base substitutions (SBS, left) and small insertions and deletions (ID, right). Signatures that generated clonal somatic mutations in fewer than 10 samples and also generated subclonal somatic mutations in fewer than 10 samples were excluded from the analysis. The line within the box indicates the median, while the upper and lower ends indicate the 25th and 75th percentiles. Whiskers show 1.5 × interquartile range, and values outside are shown as individual data points. b, Boxplots indicating the fold-change of the relative contribution per sample of each signature between early clonal and late clonal SBS (left) and ID (right) with samples separated by age of diagnosis in early-onset (under 50 years of age; purple) and late-onset (50 or over; green). As in Fig. 4a, SBS signatures that generated early clonal SBSs in fewer than 50 samples and late clonal SBSs in fewer than 50 samples, as well as ID signatures generating early clonal IDs in fewer than 20 samples and late clonal IDs in fewer than 20 samples, were excluded from the analysis.
Extended Data Fig. 9
Extended Data Fig. 9. Representative microbiome and genomic profiles of colibactin-exposed samples.
a-d, Microbiome and genomic profiles of representative samples corresponding to the four different sample types according to colibactin exposure: genomic+ and pks + (a), genomic+ and pks− (b), genomic- and pks + (c), and genomic- and pks−. The genomic status is defined by the presence of SBS88 or ID18 signatures, while the microbiome status (pks) is determined by the coverage of at least half of the pks island, and suggests ongoing and/or active pks+ bacterial infection. Circos plots display Reads Per Kilobase of transcript per Million (RPKM) values across clb genes within the pks island (left). Bar plots represent the proportion of mutations attributed to SBS88 and ID18 colibactin signatures compared to others (center), and are displayed next to mutational profiles of single base substitutions (SBS-288 mutational context) and small insertions and deletions (ID-83 mutational context) for each sample (right).
Extended Data Fig. 10
Extended Data Fig. 10. Driver mutations associated with colibactin mutagenesis in early-onset and late-onset colibactin positive cases and with country-enriched mutational signatures in microsatellite stable colorectal cancers.
a-b, Bar plots indicating the proportion and number of driver mutations probabilistically assigned to colibactin-induced and other mutational signatures, including single base substitutions (a) and small insertions and deletions (indels; b), with samples separated by age of diagnosis in early-onset (under 50 years of age; left) and late-onset (50 or over; right). Driver mutations were divided into different groups, including the APC c.835−8 A > G splicing-associated driver mutation, other APC driver mutations, TP53 driver mutations, and driver mutations affecting other cancer driver genes. c-d, Bar plots indicating the proportion and number of mutations in chromatin modifier genes probabilistically assigned to colibactin-induced and other mutational signatures, including single base substitutions (c) and indels (d), in the 169 colibactin positive cases. e-g, Bar plots indicating the proportion and number of driver single base substitutions (e and f) and indels (g) in cancer driver genes probabilistically assigned to specific mutational signatures in cases from Colombia (e) or Argentina (f and g) compared to other countries.

Update of

  • Geographic and age-related variations in mutational processes in colorectal cancer.
    Díaz-Gay M, Dos Santos W, Moody S, Kazachkova M, Abbasi A, Steele CD, Vangara R, Senkin S, Wang J, Fitzgerald S, Bergstrom EN, Khandekar A, Otlu B, Abedi-Ardekani B, de Carvalho AC, Cattiaux T, Penha RCC, Gaborieau V, Chopard P, Carreira C, Cheema S, Latimer C, Teague JW, Mukeriya A, Zaridze D, Cox R, Albert M, Phouthavongsy L, Gallinger S, Malekzadeh R, Niavarani A, Miladinov M, Erić K, Milosavljevic S, Sangrajrang S, Curado MP, Aguiar S, Reis RM, Reis MT, Romagnolo LG, Guimarães DP, Holcatova I, Kalvach J, Vaccaro CA, Piñero TA, Świątkowska B, Lissowska J, Roszkowska-Purska K, Huertas-Salgado A, Shibata T, Shiba S, Sangkhathat S, Chitapanarux T, Roshandel G, Ashton-Prolla P, Damin DC, de Oliveira FH, Humphreys L, Lawley TD, Perdomo S, Stratton MR, Brennan P, Alexandrov LB. Díaz-Gay M, et al. medRxiv [Preprint]. 2025 Feb 21:2025.02.13.25322219. doi: 10.1101/2025.02.13.25322219. medRxiv. 2025. Update in: Nature. 2025 Jul;643(8070):230-240. doi: 10.1038/s41586-025-09025-8. PMID: 40034755 Free PMC article. Updated. Preprint.

References

    1. Bray, F. et al. Global cancer statistics 2022: GLOBOCAN estimates of incidence and mortality worldwide for 36 cancers in 185 countries. CA Cancer J. Clin.74, 229–263 (2024). - PubMed
    1. Siegel, R. L., Jemal, A. & Ward, E. M. Increase in incidence of colorectal cancer among young men and women in the United States. Cancer Epidemiol. Biomarkers Prev.18, 1695–1698 (2009). - PubMed
    1. Vuik, F. E. et al. Increasing incidence of colorectal cancer in young adults in Europe over the last 25 years. Gut68, 1820–1826 (2019). - PMC - PubMed
    1. Siegel, R. L. et al. Global patterns and trends in colorectal cancer incidence in young adults. Gut68, 2179–2185 (2019). - PubMed
    1. Patel, S. G., Karlitz, J. J., Yen, T., Lieu, C. H. & Boland, C. R. The rising tide of early-onset colorectal cancer: a comprehensive review of epidemiology, clinical features, biology, risk factors, prevention, and early detection. Lancet Gastroenterol. Hepatol.7, 262–274 (2022). - PubMed

MeSH terms