. 2025 Jun:96:102155.
doi: 10.1016/j.molmet.2025.102155. Epub 2025 Apr 21.

CPT1C deficiency in SF1 neurons impairs early metabolic adaptation to dietary fats, leading to obesity

Affiliations

CPT1C deficiency in SF1 neurons impairs early metabolic adaptation to dietary fats, leading to obesity

A Fosch et al. Mol Metab. 2025 Jun.

Abstract

Objectives: SF1 neurons of the ventromedial hypothalamus (VMH) play a pivotal role in regulating body weight and adiposity, particularly in response to a high-fat diet (HFD), as well as in the recovery from insulin-induced hypoglycemia. While the brain-specific CPT1C isoform is well known for its role in controlling food intake and energy homeostasis, its function within specific hypothalamic neuronal populations remains largely unexplored. Here, we explore the role of CPT1C in SF1 neurons.

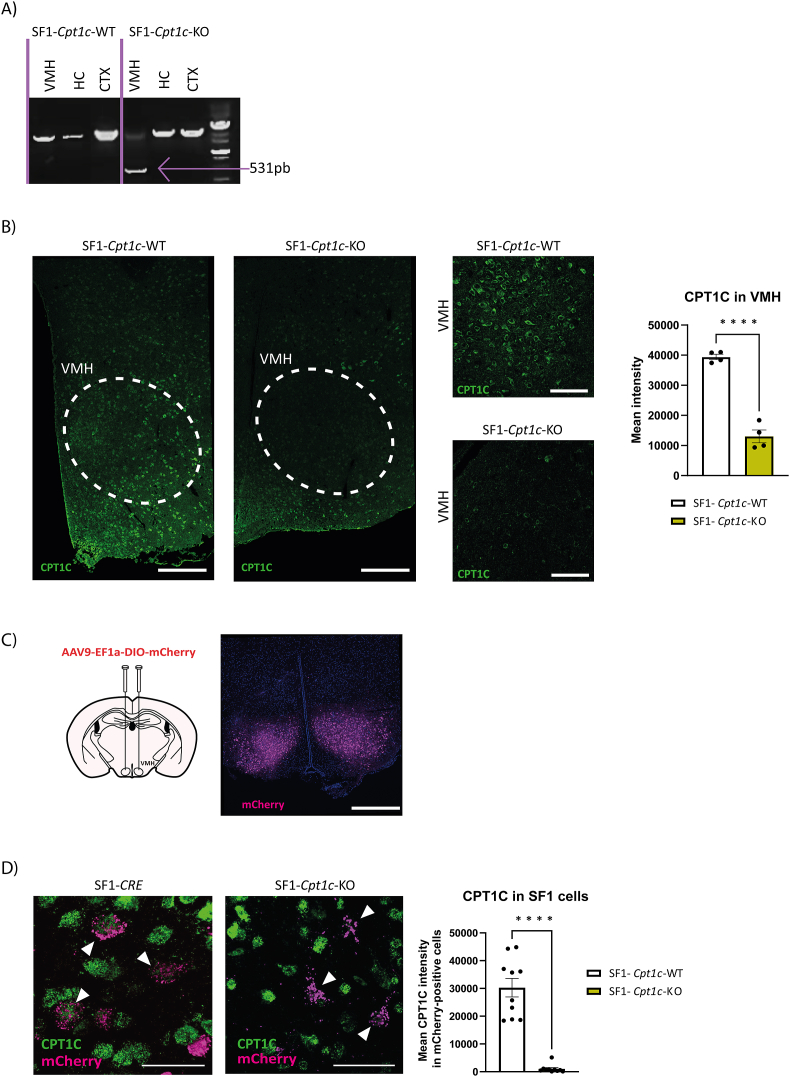
Methods: Mice deficient in CPT1C within SF1 neurons were generated, and their response to a HFD was investigated.

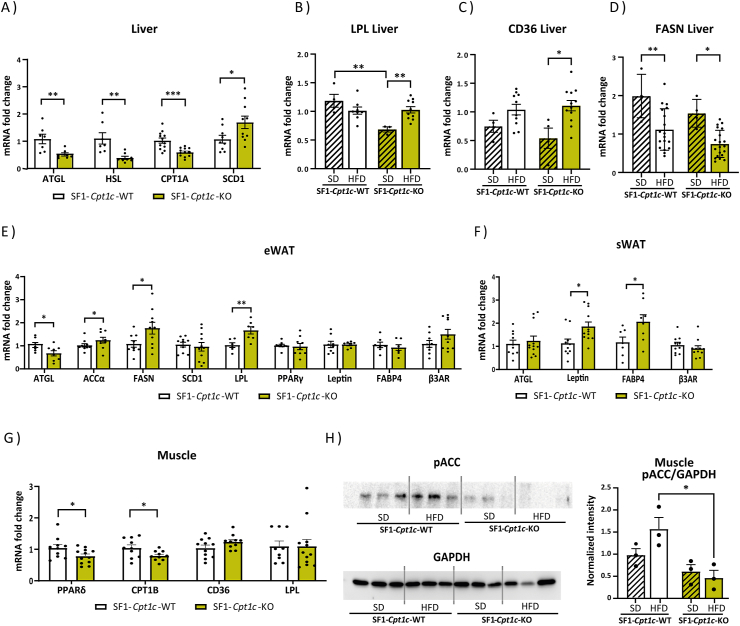
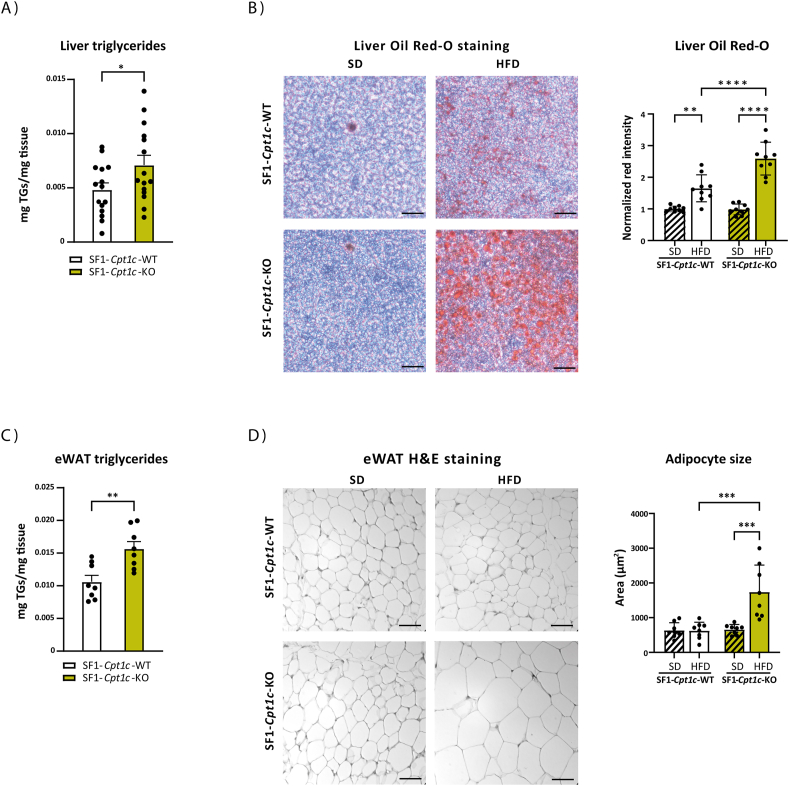
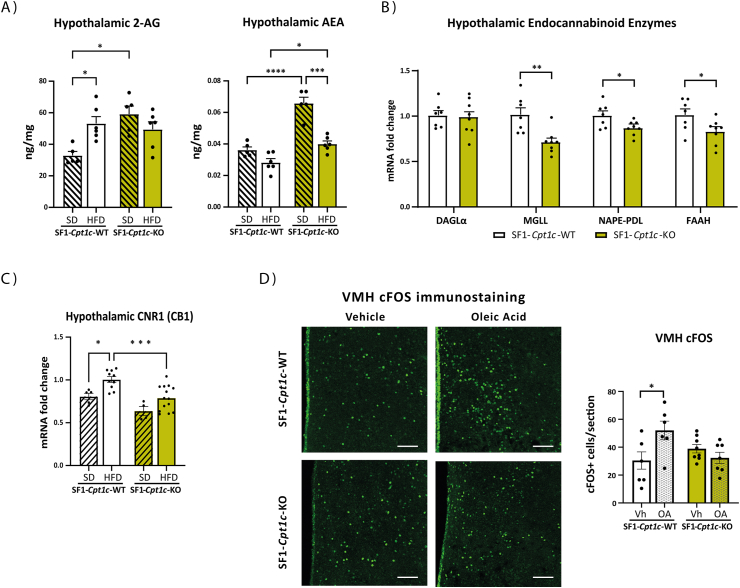
Results: SF1-Cpt1c-KO mice fail to adjust their caloric intake during initial HFD exposure, which is associated with impaired activation of the melanocortin system. Furthermore, these mice exhibit disrupted metabolic gene expression in the liver, muscle, and adipose tissue, leading to increased adiposity independently of food intake. In contrast, their response to glucose or insulin challenges remains intact. After long-term HFD exposure, SF1-Cpt1c-KO mice are more prone to developing obesity and glucose intolerance than control littermates, with males exhibiting a more severe phenotype. Interestingly, CPT1C deficiency in SF1 neurons also results in elevated hypothalamic endocannabinoid (eCB) levels under both chow and HFD conditions. We propose that this sustained eCB elevation reduces VMH activation by fatty acids and impairs the SF1-POMC drive upon fat intake.

Conclusion: Our findings establish CPT1C in SF1 neurons as essential for VMH-driven dietary fat sensing, satiety, and lipid metabolic adaptation.

Keywords: Adiposity; CPT1C; Endocannabinoids; Food intake; High-fat diet; SF1 neurons.


Conflict of interest statement

Declaration of competing interest The authors declare that they have no known competing financial interests or personal relationships that could have appeared to influence the work reported in this paper.

Figures

Image 1
Graphical abstract
Figure 1
Figure 1
Validation of SF1-Cpt1c-KO mice. A) PCR amplification demonstrating the excision of exons 4 to 6 of the Cpt1c gene in SF1-Cpt1c-KO mice. Image of an agarose gel showing PCR products after electrophoresis. Samples were collected from three different brain regions: CTX (cortex), HC (hippocampus), and VMH (ventromedial hypothalamus). A lower-sized band, corresponding to the excision of exons 4–6, is present only in the VMH of SF1-Cpt1c-KO mice. B) Expression of CPT1C in the VMH of SF1-Cpt1c-WT and SF1-Cpt1c-KO mice. Representative images are shown on the left, and the quantitative analysis is presented on the right. Scale bar: 300 μm. Data are represented as mean ± SEM, male mice, 8–12-week-old, n = 4 per group. ∗∗∗∗p < 0.0001 vs SF1-CPT1c-WT mice. Statistical significance was determined by the t-student test. C) Left: Schematic representation of the stereotaxic injection of AAV9-EF1a-DIO-mCherry into the VMH. Right: Representative image of VMH region in a brain section from SF1-CRE mice, 3 weeks after AAVs injection. Scale bar: 500 μm. D) Colocalization of CPT1C with mCherry-positive cells 3 weeks after AAV9-EF1a-DIO-mCherry injection in the VMH of SF1-CRE and SF1-Cpt1c-KO mice. Representative images of the VMH region in brain sections from both groups are shown on the left, and the quantitative analysis is presented on the right. Both genotypes show CRE activity in SF1 cells of the VMH (mCherry-positive cells); however, in SF1-Cpt1c-KO mice, all mCherry-positive cells are CPT1C-negative. Scale bar: 40 μm. Data are represented as mean ± SEM, male mice, 8–12-week-old, n = 10 per group. ∗∗∗∗p < 0.0001 vs SF1-CPT1c-WT mice. Statistical significance was determined by the t-student test.
Figure 2
Figure 2
Metabolic phenotype of male SF1-Cpt1c-KO and -WT mice upon 5 days of HFD. A) Cumulative daily food intake was recorded during both the dark and light phases of each day, starting one day prior to diet change and continuing for 5 days while on the high-fat diet (HFD). B) Cumulative food intake. C) Body weight and body weight gain D) Total calorie intake over the 5 days of HFD. E) Respiratory exchange ratio, starting 2 days prior to diet change and continuing for 5 days while on the HFD. F) Magnetic Resonance Imaging (MRI) analysis of fat mass of mice in SD and 5 days of HFD. G) Magnetic Resonance Imaging (MRI) analysis of lean mass of mice in SD and 5 days of HFD. Data are represented as mean ± SEM, male mice, 8–12-week-old, n = 7–10/group. ∗p < 0.05, ∗∗p < 0.01, ∗∗∗p < 0.001 vs SF1-CPT1c-WT mice. Statistical significance was determined by ANOVA test with post-hoc Bonferroni.
Figure 3
Figure 3
Metabolic phenotype of male SF1-Cpt1c-KO and -WT mice upon 5 days of pair feeding with a HFD. A) Cumulative food intake. B) Body weight gain. C) Subcutaneous White Adipose Tissue (sWAT) weight. D) Epididymal White Adipose Tissue (eWAT) weight. E) Brown Adipose Tissue (BAT) weight. F) Oil Red-O staining of liver sections from SF1-Cpt1c-KO and -WT mice fed a SD or a HFD for 5 days, and quantification. Scale bar: 100 μm. Data are represented as mean ± SEM, male mice, 8–12-week-old, n = 7–10/group. ∗p < 0.05, ∗∗p < 0.01, ∗∗∗p < 0.001 vs SF1-Cpt1c-WT mice. Statistical significance was determined by ANOVA test with post-hoc Bonferroni. (For interpretation of the references to color in this figure legend, the reader is referred to the Web version of this article).
Figure 4
Figure 4
Expression of proteins and hormones involved in lipid metabolism in different tissues of male SF1-Cpt1c-KO and -WT mice after 5 days of HFD. A) Expression of adipose triglyceride lipase (ATGL), hormone-sensitive lipase (HSL), CPT1A, stearoyl-CoA desaturase (SCD1) measured by qPCR in liver samples of mice fed a HFD for 5 days. B) Lipoprotein lipase (LPL) expression in liver samples. C) CD36 expression in liver samples. D) Fatty acid synthase (FAS) expression in liver samples. E) Expression of ATGL, acetyl-CoA carboxylase-alpha (ACCα), FAS, SCD1, LPL, peroxisome proliferator-activated receptor gamma (PPARγ), leptin, fatty acid-binding protein 4 (FABP4) and beta-3 adrenergic receptor (β3AR) in epididymal WAT (eWAT). F) ATGL, leptin, fatty acid-binding protein 4 (FABP4) and β3AR expression in subcutaneous WAT (sWAT). G) PPARδ, CPT1B, CDC36 and LPL expression in gastrocnemius muscle. H) Western blot (a representative image) of pACC and GAPDH from muscle samples and the quantification of pACC normalized by GAPDH. Data are represented as mean ± SEM, male mice, 8–12-week-old, n = 3–12/group, ∗p < 0.05, ∗∗p < 0.01, ∗∗∗p < 0.001. Statistical significance was determined by ANOVA test with post-hoc Bonferroni.
Figure 5
Figure 5
Liver and eWAT adiposity of male SF1-Cpt1c-KO and -WT mice after 5 days of HFD. A) Liver triglycerides (TG) after 5 days of HFD B) Oil Red-O staining of liver sections from SF1-Cpt1c-KO and -WT mice fed a SD or a HFD for 5 days, and quantification. Scale bar: 100 μm. C) eWAT triglycerides. D) Hematoxylin and eosin staining of eWAT sections and quantification of adipocyte size. Scale bar: 50 μm. Data are represented as mean ± SEM, male mice, 8–12-week-old, n = 8–9/group, ∗p < 0.05, ∗∗p < 0.01, ∗∗∗p < 0.001. Statistical significance was determined by ANOVA test with post-hoc Bonferroni. (For interpretation of the references to color in this figure legend, the reader is referred to the Web version of this article).
Figure 6
Figure 6
Metabolic phenotype of male SF1-Cpt1c-KO and -WT mice after 8 weeks of HFD. A) Body weight and body weight gain. B) Cumulative food intake measured once per week. C) MRI analysis of lean and fat mass. D) BAT weight. E) eWAT weight. F) sWAT weight. G) Hematoxylin and eosin staining of eWAT sections (representative images) and the quantification of adipocyte size. Scale bar: 50 μm. H) Expression of SCD1 and ATGL in liver samples, and FABP4 and leptin in sWAT samples of SF1-Cpt1c-KO and -WT mice after 8 weeks of HFD. Data are represented as mean ± SEM, male mice, 16-week-old, n = 8–10/group (for H&E staining 2 slices/mouse). ∗p < 0.05 ∗∗p < 0.01, ∗∗∗p < 0.001, ∗∗∗∗p < 0.0001. Statistical significance was determined by ANOVA test with post-hoc Bonferroni.
Figure 7
Figure 7
Plasma leptin levels and glucose homeostasis parameters of male SF1-Cpt1c-KO and -WT mice after 8 weeks of HFD. A) Plasma leptin levels. B) Glucose tolerance test (GTT) and quantification of the area under the curve (AUC). C) Insulin tolerance test (ITT) and quantification of the AUC and the KITT calculated on the first 30 min of ITT. Data were represented as mean ± SEM, n = 8–10/group. ∗p < 0.05, ∗∗p < 0.01, ∗∗∗∗p < 0.0001. Statistical significance was determined by ANOVA test with post-hoc Bonferroni (GTT and ITT curves) and by t-student test (AUC and KITT).
Figure 8
Figure 8
Hypothalamic neuropeptides and alpha-melanocyte stimulating hormone αMSH). A) Hypothalamic expression of POMC, NPY and AgRP neuropeptides in male SF1-Cpt1c-KO and -WT mice after 5 days on a HFD. B) Left: Representative image of the arcuate nucleus (ARC) indicating the selected area for measuring αMSH levels. Middle: Representative image of αMSH staining in the ARC. Right: Data quantification. C) Left: Representative image of the paraventricular nucleus (PVN) indicating the selected area for measuring αMSH levels. Middle: Representative image of αMSH staining in the PVN. Right: Data quantification. Data are represented as mean ± SEM, male mice, 8–12-week-old, n = 4–7/group (2–5 slices/mouse). ∗p < 0.05, ∗∗∗p < 0.001, ∗∗∗∗p < 0.0001 vs SF1-CPT1c-WT. Statistical significance was determined by two-way ANOVA test with post-hoc Bonferroni. Scale bar: 85 μm.
Figure 9
Figure 9
Endocannabinoid (eCB) system and oleic acid sensing in the hypothalamus of male SF1-Cpt1c-KO and -WT mice. A) Hypothalamic levels of 2-arachidonoylglycerol (2-AG) and anandamide (AEA). B) Hypothalamic expression of enzymes involved in the eCB system: diacylglycerol lipase alpha (DAGLα), monocylglycerol lipase (MGLL), N-acylphosphatidylethanolamine phospholipase D (NAPE-PLD) and fatty acid amide hydrolase 1 (FAAH). C) Hypothalamic expression of the eCB receptor CB1. D) Effects of intracerebroventricular oleic acid (OA) administration on neuronal activation, assessed by cFOS expression in the VMH. Representative images and quantification of c-Fos positive cells per section. n = 3/group (2–3 slices/mouse). bar: 100 μm. Data from A–C panels are represented as mean ± SEM, 8–12-week-old, n = 8–10/group. ∗p < 0.05 ∗∗p < 0.01, ∗∗∗p < 0.001, ∗∗∗∗p < 0.0001, compared to SF1-Cpt1c-WT or to the same genotype on SD. Statistical significance was determined by ANOVA test with post-hoc Bonferroni.

Similar articles

Cited by

References

    1. Fosch A., Zagmutt S., Casals N., Rodríguez-Rodríguez R. New insights of sf1 neurons in hypothalamic regulation of obesity and diabetes. Int J Mol Sci. 2021;22(12) doi: 10.3390/ijms22126186. - DOI - PMC - PubMed
    1. Ruffin M.P., Nicolaidis S. Electrical stimulation of the ventromedial hypothalamus enhances both fat utilization and metabolic rate that precede and parallel the inhibition of feeding behavior. Brain Res. 1999;846(1) doi: 10.1016/S0006-8993(99)01922-8. - DOI - PubMed
    1. Ikeda Y., Luo X., Abbud R., Nilson J.H., Parker K.L. The nuclear receptor steroidogenic factor 1 is essential for the formation of the ventromedial hypothalamic nucleus. Mol Endocrinol. 1995;9(4) doi: 10.1210/mend.9.4.7659091. - DOI - PubMed
    1. Kim K.W., Zhao L., Parker K.L. Central nervous system-specific knockout of steroidogenic factor 1. Mol Cell Endocrinol. 2009 doi: 10.1016/j.mce.2008.09.026. - DOI - PubMed
    1. Kim K.W., Zhao L., Donato J., Kohno D., Xu Y., Eliasa C.F., et al. Steroidogenic factor 1 directs programs regulating diet-induced thermogenesis and leptin action in the ventral medial hypothalamic nucleus. Proc Natl Acad Sci U S A. 2011;108(26) doi: 10.1073/pnas.1102364108. - DOI - PMC - PubMed

MeSH terms

Substances