. 2025 Aug;103(7):600-614.
doi: 10.1111/imcb.70018. Epub 2025 Apr 23.

A new method to measure cell metabolism of rare cells in vivo reveals a high oxidative phosphorylation dependence of lung T cells

Affiliations

A new method to measure cell metabolism of rare cells in vivo reveals a high oxidative phosphorylation dependence of lung T cells

Aristeidis Roubanis et al. Immunol Cell Biol. 2025 Aug.

Abstract

Regulation of cellular metabolism is a central element governing the fate and function of T cells. However, the in vivo metabolic characteristics of rare cells, such as nonlymphoid tissue T cells, are poorly understood because of experimental limitations. Most techniques measuring cell metabolism require large cell numbers. The recent SCENITH method allows for studying the metabolism of rare cells by flow cytometry. However, this technique requires cells to be isolated and cultured ex vivo, which may alter their metabolism. Here, we propose a new experimental approach, called in vivo SCENITH, to investigate the cellular metabolism of T cells in vivo at a steady state in the spleen and lungs. For this purpose, we administered the metabolic modulators directly in mice, instead of applying these reagents ex vivo, as in the classical SCENITH method. Whereas ex vivo manipulation impacted the viability and phenotype of T cells, this toxic effect was not observed in the in vivo SCENITH. We observed that conventional and regulatory T cells shared similar metabolic profiles. Importantly, whereas spleen T cells used both oxidative phosphorylation and glycolysis, the metabolism of T cells in the lungs was mainly based on oxidative phosphorylation. Finally, metabolic inhibitors that interfere with protein translation and energy availability downregulated Foxp3 expression in regulatory T cells. These results describe an expansion of SCENITH that allows to measure the metabolic profile of rare cells in vivo, revealing a high dependence on oxidative phosphorylation of lung T cells.

Keywords: Cell metabolism; Foxp3; Treg; in vivo SCENITH; lung T cells.


Conflict of interest statement

The authors do not have any conflict of interest.

Figures
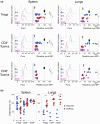
Figure 1
Figure 1
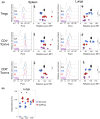
Splenic and lung T cells have distinct metabolic profiles ex vivo. The SCENITH assay was performed on spleen and lung cells cultured without puromycin (C–; puro), with puro alone (C+) or with puro and 2‐deoxyglucose (DG), puro and oligomycin (O) or puro and both DG and oligomycin (DGO). Puro incorporation in regulatory T cells (Tregs), CD4+ conventional T cells (Tconvs) and CD8+ Tconvs were analyzed by flow cytometry. (a) Representative puro staining (left panels) and puro mean fluorescent intensity (MFI) relative to the puro MFI of C+ control (right panels). (b) Glycolysis and oxidative phosphorylation (OxPhos) dependencies were calculated using puro MFI following the formula: 100 × ((((C+) − (DG))/(C+)) − (DGO)) for glycolysis dependency and 100 × ((((C+) − (O))/(C+)) − (DGO)) for OxPhos dependency. Each symbol represents individual mice and bars represent medians. Data are from at least three independent experiments. Number of mice per group: 16 for splenic CD4+ T cells, 7 or 8 mice for lung CD4+ T cells and splenic CD8+ Tconvs and 4 mice for lung CD8+ T cells. Statistical analysis was calculated using a Wilcoxon rank‐sum test. *P ≤ 0.05, **P ≤ 0.01, ***P ≤ 0.001 and ****P ≤ 0.0001.
Figure 2
Figure 2
The regulatory T cell (Treg) pool is impacted by puromycin and metabolic inhibitors ex vivo but not in vivo. (a, b) Proportions of splenic and lung viable CD45+ cells (a) and Tregs (b) from untreated mice (C–), mice treated in vivo with metabolic inhibitors as in Figure 3 or cells treated ex vivo with metabolic inhibitors as in Figure 1. Data were compared with the C– control cells. (c) Spleen and lung Tregs subsets from untreated mice (C−), mice treated with puromycin in vivo (C+, in vivo) or cells treated with puromycin ex vivo (C+, ex vivo). Cells were labeled with a mix of 26 monoclonal antibodies (mAbs) to identify subsets of resting (rTregs), memory (memTregs), recently activated (raTregs) and precursors of nonlymphoid tissue (tisTregs) Tregs in the spleen and subsets of rTregs, memTregs, raTregs and very recently activated Tregs (vraTregs) in the lungs. Uniform manifold approximation and projection (UMAP) showing Treg subsets from a pool of 3 (C–) or 4 mice (C+ in vivo and C+ ex vivo; left panels) and proportions of the four Treg subsets (right panels). Each symbol represents individual mice and bars represent medians. Number of mice per group: 7–12 mice per condition were used in most conditions (except 4 mice for ex vivo lung, in vivo in c and in vivo DGO in b conditions). Data are from at least three independent experiments. Statistical analysis was calculated using a Wilcoxon rank‐sum test. *P < 0.05.
Figure 3
Figure 3
Lung T cells have an oxidative phosphorylation (OxPhos)–based metabolism at a steady state. SCENITH was performed on spleen and lung cells in mice that were injected intraperitoneally with DG, O or both inhibitors 17 and 2 h before euthanasia. Puromycin (puro) was injected intraperitoneally 1 before euthanasia and its incorporation in regulatory T cells (Tregs), CD4+ conventional T cells (Tconvs) and CD8+ Tconvs was analyzed by flow cytometry. Mice were injected with diluents (C−), puro alone (C+), puro and DG, puro and oligomycin (O) or puro, DG and oligomycin (DGO). (a) Representative puro staining (left panels) and puro mean fluorescent intensity (MFI) relative to the puro MFI of C+ control (right panels). (b) Glycolysis and OxPhos dependencies were calculated as in Figure 1. Each symbol represents individual mice and bars represent medians. Data are from at least three independent experiments, with 5–7 mice per group in all conditions (except 3 for DGO) (a) and 2–4 mice per group (b). Statistical analysis was calculated using a Wilcoxon rank‐sum test. *P ≤ 0.05 and **P ≤ 0.01.
Figure 4
Figure 4
Glycolysis and oxidative phosphorylation (OxPhos) inhibitors reduce Foxp3 expression of regulatory T cells (Tregs) ex vivo. Foxp3 expression in spleen and lung Tregs from mice treated in vivo with metabolic inhibitors as in Figure 3 or cells treated ex vivo with metabolic inhibitors as in Figure 1. (a) Mean fluorescent intensity (MFI) of Foxp3 expression relative to the puromycin (puro) MFI of C+ control on gated Foxp3+ cells. (b) Representative Foxp3 expression on gated CD4+ cells. (c) Correlation plots displaying the relative Foxp3 MFI versus the relative puro MFI on gated Foxp3+ cells. Each symbol represents individual mice and horizontal bars represent medians. Data are from at least two independent experiments (4–7 mice per group). Statistical analysis was calculated using (a) a Wilcoxon rank‐sum test and (c) a Pearson correlation coefficient test.*P ≤ 0.05. memTreg, memory Treg; rTreg, resting Treg; raTreg, recently activated Treg; tisTreg, tissue Treg; UMAP, uniform manifold approximation and projection.

Similar articles

References

    1. Buck MD, O'Sullivan D, Pearce EL. T cell metabolism drives immunity. J Exp Med 2015; 212: 1345–1360. - PMC - PubMed
    1. Chapman NM, Chi H. Metabolic adaptation of lymphocytes in immunity and disease. Immunity 2022; 55: 14–30. - PMC - PubMed
    1. Voss K, Hong HS, Bader JE, Sugiura A, Lyssiotis CA, Rathmell JC. A guide to interrogating immunometabolism. Nat Rev Immunol 2021; 21: 637–652. - PMC - PubMed
    1. DeBerardinis RJ, Keshari KR. Metabolic analysis as a driver for discovery, diagnosis and therapy. Cell 2022; 185: 2678–2689. - PMC - PubMed
    1. Artyomov MN, Van den Bossche J. Immunometabolism in the single‐cell era. Cell Metab 2020; 32: 710–725. - PMC - PubMed

Substances

LinkOut - more resources