

doi: 10.1002/ctm2.70317.
Exploring glomeruli and renal tubules transcriptomic data: Crucial role of the AASS gene in membranous nephropathy
Affiliations
- PMID: 40268511
- PMCID: PMC12017891
- DOI: 10.1002/ctm2.70317
Item in Clipboard
Exploring glomeruli and renal tubules transcriptomic data: Crucial role of the AASS gene in membranous nephropathy
Clin Transl Med.
2025 Apr.
No abstract available
Conflict of interest statement
The authors declare no conflicts of interest.
Figures
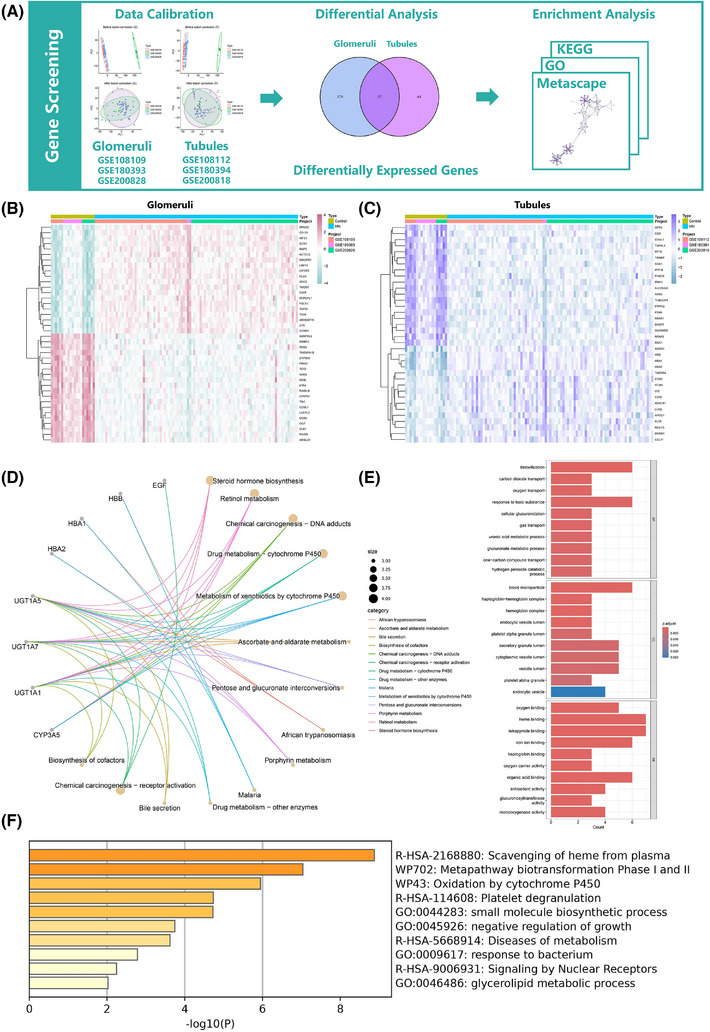
Difference analysis and enrichment analysis results for intersecting DEGs. (A) The flowchart of this part. (B) Heatmap of differential analysis for glomeruli data. (C) Heatmap of differential analysis for renal tubule data. (D) Circled line graph of KEGG. (E) Bar chart of GO enrichment results. (F) Bar chart of Metascape enrichment results. DEG, differentially expressed genes.

Diagnostic biomarkers screening results for SVM and RF algorithms. (A) The flowchart of this part. (B) Importance ranking plot of variables in glomeruli. (C) Importance ranking plot of variables in renal tubules. (D) Venn diagram of a machine learning algorithm for intersecting genes in glomeruli. (E) Venn diagram of intersecting genes in renal tubules. (F) Difference analysis of diagnostic biomarkers in glomeruli. (G) Boxplot of difference analysis in renal tubules. (H–M) ROC curves of diagnostic biomarkers in glomeruli and renal tubules. RF, random forest; SVM, support vector machine.
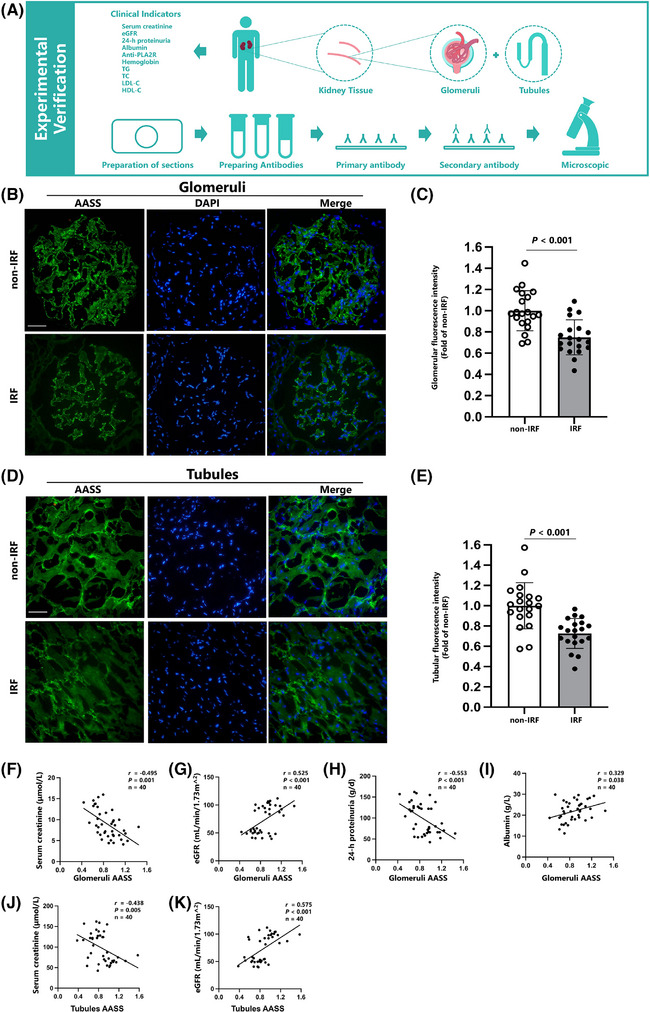
Immunofluorescence of AASS. (A) The flowchart of this part. (B) Immunofluorescence of AASS in glomeruli (magnification × 400, bar = 20 µm). (C) The semi‐quantification of AASS expression in glomeruli between different groups of MN patients. (D,E) Correlation between AASS and serum creatinine and eGFR. (F) Immunofluorescence of AASS in renal tubules (magnification × 400, bar = 20 µm). (G) The semi‐quantification of AASS expression in tubules between different groups of MN patients. (H,I) Correlation between AASS and serum creatinine and eGFR in renal tubules. eGFR, estimated glomerular filtration rate; MN, Membranous nephropathy.
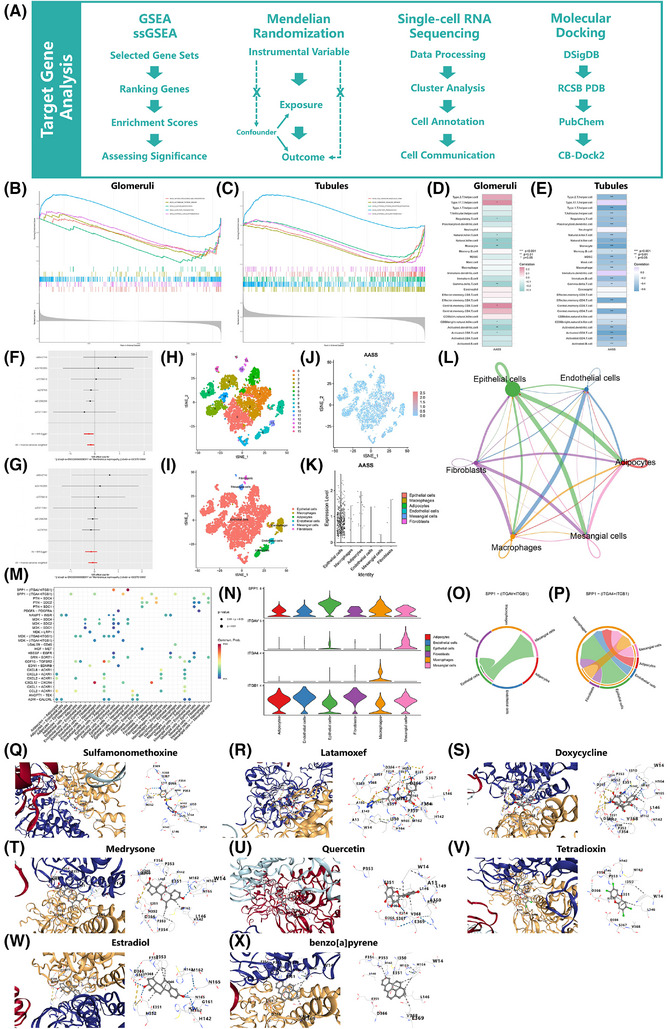
The exploratory study of AASS gene in MN. (A) The flowchart of this part. (B,C) Results of GSEA analysis of AASS genes in glomeruli and renal tubules. (D,E) Heatmap of the correlation between immune cell types and AASS in glomeruli and renal tubules. (F,G) Forest plots of MR analysis [MR Egger and Inverse variance weighted (IVW)] in ebi‐a‐GCST010004 and ebi‐a‐GCST010005. (H) Clustering results of the t‐SNE analysis. (I) Cellular annotation results. (J,K) Expression of AASS in different cells. (L) Cell communication interaction strength maps. (M) Bubble plot of receptor‐ligand pairs. (N) Violin plot of gene expression related to the SPP1 signalling pathway. (O) Chord diagram of SPP1‐(ITGAV+ITGB1). (P) Chord diagram of SPP1‐(ITGA4+ITGB1). (Q–X) Docking patterns of AASS and compounds. MN, Membranous nephropathy; GSEA, gene set enrichment analysis; MR, Mendelian randomisation.
Similar articles
-
Urinary excretion of thermostable kidney antigen (BE antigen) in patients with various renal diseases. A case of membranous nephropathy with kidney BE antigen in the urine.Nephron. 1983;33(3):216-9. doi: 10.1159/000182945. Nephron. 1983. PMID: 6405294
-
Membranes nephropathy associated with renal cell carcinoma. Evidence against a role of renal tubular or tumor antibodies in pathogenesis.Am J Med. 1978 May;64(5):863-7. doi: 10.1016/0002-9343(78)90529-6. Am J Med. 1978. PMID: 645750
-
Enhanced expression of the M-type phospholipase A2 receptor in glomeruli correlates with serum receptor antibodies in primary membranous nephropathy.Kidney Int. 2012 Oct;82(7):797-804. doi: 10.1038/ki.2012.209. Epub 2012 Jun 6. Kidney Int. 2012. PMID: 22673885
-
Atubular glomeruli and the structural basis for chronic renal failure.Lab Invest. 1992 Mar;66(3):265-84. Lab Invest. 1992. PMID: 1538583 Review.
-
[A case of superimposed renal lesions of IgA and membranous nephropathy with diabetic nephropathy].Nihon Jinzo Gakkai Shi. 1992 Aug;34(8):931-8. Nihon Jinzo Gakkai Shi. 1992. PMID: 1484412 Review. Japanese.
References
-
- Ronco P, Beck L, Debiec H, Jha V, et al. Membranous nephropathy. Nat Rev Dis Primers. 2021;7(1):69. - PubMed
-
- Krishna DR, Klotz U. Extrahepatic metabolism of drugs in humans. Clin Pharmacokinet. 1994;26(2):144‐160. - PubMed
-
- Yan Q, Du Y, Huang F, et al. Identification of mitochondria‐related genes as diagnostic biomarkers for diabetic nephropathy and their correlation with immune infiltration: new insights from bioinformatics analysis. Int Immunopharmacol. 2024;142(Pt A):113114. - PubMed
Grants and funding
LinkOut - more resources
Full Text Sources