. 2025 Apr 24;16(1):3843.
doi: 10.1038/s41467-025-59170-x.

Symmetric adenine methylation is an essential DNA modification in the early-diverging fungus Rhizopus microsporus

Affiliations

Symmetric adenine methylation is an essential DNA modification in the early-diverging fungus Rhizopus microsporus

Carlos Lax et al. Nat Commun. .

Abstract

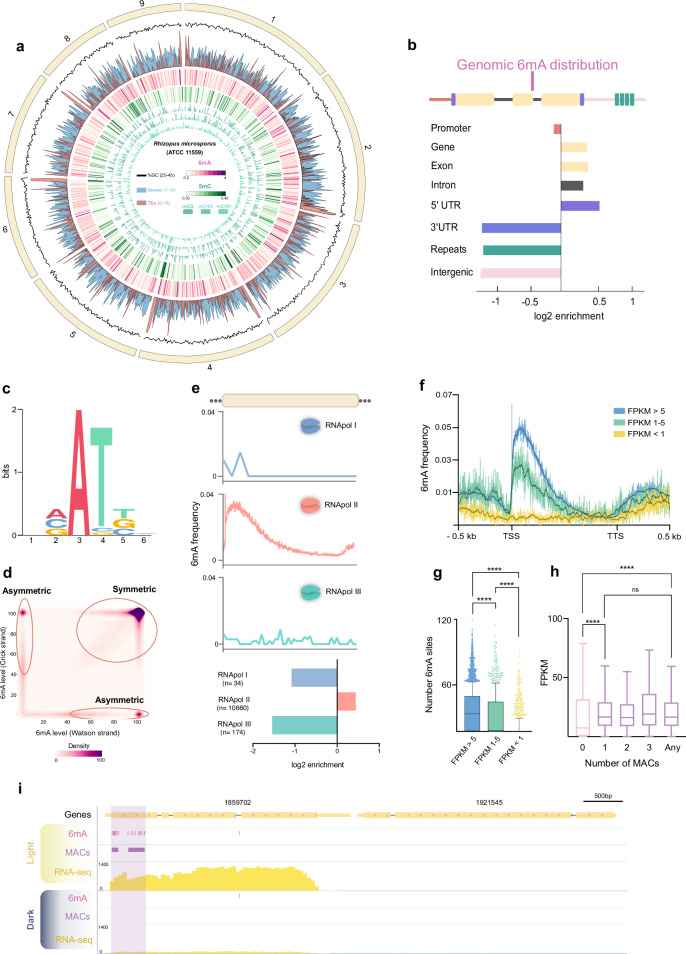
The discovery of N6-methyladenine (6mA) in eukaryotic genomes, typically found in prokaryotic DNA, has revolutionized epigenetics. Here, we show that symmetric 6mA is essential in the early diverging fungus Rhizopus microsporus, as the absence of the MT-A70 complex (MTA1c) responsible for this modification results in a lethal phenotype. 6mA is present in 70% of the genes, correlating with the presence of H3K4me3 and H2A.Z in open euchromatic regions. This modification is found predominantly in nucleosome linker regions, influencing the nucleosome positioning around the transcription start sites of highly expressed genes. Controlled downregulation of MTA1c reduces symmetric 6mA sites affecting nucleosome positioning and histone modifications, leading to altered gene expression, which is likely the cause of the severe phenotypic changes observed. Our study highlights the indispensable role of the DNA 6mA in a multicellular organism and delineates the mechanisms through which this epigenetic mark regulates gene expression in a eukaryotic genome.


Conflict of interest statement

Competing interests: The authors declare no competing interests.

Figures

Fig. 1
Fig. 1. Genome-wide implications and distribution of DNA epigenetic modifications in R microsporus.
a Gene (blue), TEs (red), 6mA (pink), and 5mC (green) density distribution across scaffolds 1–9 (20 kb bins). b 6mA enrichment by genomic features. c Logo of 6mA sites (bits indicate a measure of sequence conservation) d Density plot of 6mA methylation ratios on Watson (x-axis) and Crick strands (y-axis). e 6mA frequency over RNApol I (top), RNApol II (mid), and RNApol III (bottom) transcribed genes (bin size = 2.5% of scaled body length). The bottom part shows 6mA enrichment on RNApol I (blue), RNApol II (pink), and RNApol III (green). f 6mA frequency around TSS (bin size = 1) over highly (FPKM > 5, blue), intermediate (FPKM 1–5, green) and low (FPKM < 1, yellow) expressed genes. Wilcoxon rank was computed for each position and profile (P < 0.0001 for FPKM 1-5/FPKM < 1 and P > 0.0001 for FPKM 1-5/FPKM > 5). g Number of 6mA sites surrounding the TSS (−100nt + 400 nt) of highly (blue, n = 8279) intermediate (green, n = 924) and low (yellow, n = 1497) expressed genes. Boxplots indicate the median, first, and third quartile. Whiskers are drawn down to the 10th percentile and up to the 90th. Points above and below whiskers are drawn individually. A two-tailed student’s t-test showed significant differences (P < 0.0001 for all comparisons). h Expression levels (FPKM) of genes with different number of MACs surrounding the TSS (−100nt + 400 nt). Boxplots as in g. Whiskers were plotted according to Tukey method (75th and 25th percentile ±1.5 times interquartile distance). A student’s t-test (two-tailed) was performed to determine significant differences (P < 0.0001, ns = not significative). Non-significant correlation was found between any number of MACs (1, 2, 3, or any) and FPKM values (r = −0.01136, P = 0.3795) (n = 4718, 4331, 1447, 186, and 6982 genes for 0, 1, 2, 3, and any MACs). i Genome browser snapshot (scaffold_13: 373620-380092) indicating 6mA, MACs, and RNA-seq data under light and dark growth conditions. Purple shadow indicates MACs lost in dark versus light conditions. Two MACs upstream of gene ID:1859702 were lost in the dark, reducing expression. Source data are provided as a Source Data file.
Fig. 2
Fig. 2. Association between 6mA and chromatin organization.
a 6mA is mostly found in linker regions. 6mA, and hence, MACs are frequent in nucleosome-free regions, as exemplified in this genome snapshot (scaffold 3:1062358-1068209). b 6mA frequency over linker and nucleosome regions. Both regions were scaled and divided into ten equal-sized bins. c 6mA and nucleosome dyads profiles with respect to TSS, including 0.5 kb upstream and downstream regions. d Methylated genes display a more consistent fixed distribution (left) than unmethylated genes (right). Normalized occupancy of nucleosome dyads was plotted in reference to TSS, including 1.5 kb flanking regions. A heatmap with the average normalized occupancy signal is also displayed below. Kolmogorov-Smirnov test (KS) was performed to evaluate differences between frequency distributions (P < 0.001) (n = 1732 genes and 1149 genes for methylated and unmethylated genes, respectively). Source data are provided as a Source Data file.
Fig. 3
Fig. 3. 6mA is condensed in H3K4me3 euchromatin regions and linked to H2A.Z occupancy.
a Genes (blue), repeats (red), expression (FPKM, yellow), MACs (pink), H3K4me3 and H3K9me enrichment (IP/Input ratio) and peaks (green and dark blue, respectively), and Input track (gray) across scaffold 11. b 6mA frequency over H3K4me3 (left, n = 4401) and H3K9me3 (right, n = 118) peaks. c H3K4me3 enrichment (IP/Input ratio) over MACs. Each MAC was extended to 2000 bp and fragmented into 200 bins (n = 7441). d Genome covered by H3K4me3 peaks, H3K9me3 peaks, and MACs (inside circles). Overlapping features are detailed outside the circles, with overlap percentages indicated. Overlapping percentages of random peaks generated by using average count and length of both H3K4me and H3K9me3 peaks are indicated in gray. A Chi-square test showed significant MAC enrichment in H4K3me3 peaks and H4K3me9 peaks compared to random regions (P < 0.0001) e Profile and heatmap of H3K4me3 enrichment (IP/Input ratio) per gene cluster, alongside 6mA (%), expression (log2 FPKM), H3K9me3 (IP/Input ratio), and H2A.Z occupancy (IP/Input ratio). f Scatter plot of gene expression (log2 FPKM, y-axis) vs H3K4me3 enrichment (x-axis). Genes were color-coded according to whether they harbor a MAC (dark pink) or not (light pink). MACs were filtered to a minimum of 20 bp in length and a 0.005 methylation rate. Differences in groups were tested using Mann-Whitney test (two-tailed) (P < 0.0001). g Correlation between H3K4me3, H3K9me3, and H2A.Z (IP/Input ratio) with 6mA levels (%). The genome was divided into 30 kb bins, and the enrichment for each ChIP-seq experiment and 6mA percentage was computed for each bin. Pearson’s correlation coefficient was computed for each comparison (top right corner of each plot). Source data are provided as a Source Data file.
Fig. 4
Fig. 4. The Mta1 complex in R microsporus.
a Phylogenetic tree of representative eukaryotic species coupled with a matrix indicating the presence (filled box) or absence (empty box) of each MTA-70 protein. Species are classified into color-coded groups. Fungal phyla clades are ordered in the same descending order they appear in the tree. b Schematic representation of the MTA1c present in R. microsporus (top) and the domain composition of each protein (bottom). Charge distribution is displayed under the schematic representations. c The interaction between Mta1, Mta9, and P1 was analyzed in a yeast two-hybrid assay. Mta1 shows both weak (-WLH) and strong (-WLA) interactions with Mta9 and P1. d Genome browser view (scaffold_4:1865593-1878823) showing 6mA presence and P1 enrichment (computed as IP/Input ratio). e The methylation complex binds preferentially to 6mA-rich regions. P1 enrichment from ChIP-seq experiments (top) and DAP-seq (bottom) was computer over MACs (divided into 50 bins). f Methylated genes (6mA) show a greater enrichment of P1 downstream of the TSS than unmethylated genes (No 6mA). Source data are provided as a Source Data file.
Fig. 5
Fig. 5. Genetic engineering of R. microsporus reveals the essential role of the MTA1c.
a Schematic representation of the knockout strains generation. The double-strand break provoked by the Cas9+gRNA complex is repaired by microhomology regions flanking the auxotrophy marker. b Disruption of mta1 (UM22), mta9 (UM26), and p1 (UM24) genes results in the isolation of heterokaryotic mutants. The result of the PCR amplification of the targeted locus (hybridization sequences of the primers are indicated as red arrows in a reveals the presence of both WT nuclei (amplicon sizes: 1.5 kb mta1, 3.8 kb mta9, 3.1 kb p1) and mutant nuclei (amplicon sizes: 5.2 kb mta1, 7.3 kb mta9, 6.6 kb p1). This experiment was independently repeated three times with similar results. c Scheme describing the strategy to obtain the strain in which the mta1 gene is regulated by the Pzrt1 promoter. The double-strand break generated in the leuA locus was repaired by the construct carrying the pyrF marker, the Pzrt1 promoter, and the mta1 gene (see Fig S19). The endogenous copy of the mta1 gene was then disrupted using the leuA marker as a repair DNA template. d PCR amplification of the mta1 endogenous locus reveals that all the mutants (UM64, UM65, UM67, and UM68) analyzed are homokaryons, as only mutant nuclei are observed (band size: 5.2 kb, WT: 1.5 kb). Primers used for the amplification are indicated as red arrows in c. This experiment was independently repeated three times with similar results. e Growth of the UM64 and UM67 strains (two independent mutants carrying the regulated copy of mta1 with the endogenous mta1 copy disrupted) in the presence of zinc. 1000, 100, and 10 spores were plated in YNB and YNB supplemented with 20 mg/L ZnSO4. Source data are provided as a Source Data file.
Fig. 6
Fig. 6. Genome-wide effect of mta1 downregulation.
a Schematic diagram of the dynamic mta1 regulation experiment. From a starting point with 0 mg/L ZnSO4 and active Mta1 expression, it was downregulated by increasing ZnSO4 to 10 mg/L and 20 mg/L. Colonies growing in 20 mg/L ZnSO4-supplemented media were transferred again to media without ZnSO4. b Genomic 6mA levels measured by SMRT sequencing and HPLC-MS/MS. Data are represented as mean ± SD. Different letters indicate statistically significant differences, while the identical letters denote no significant differences, calculated using one-way ANOVA ( P < 0.001). (HPLC/MS n = 3 biological replicates for each growth condition analyzed) c 6mA frequency profile over protein-coding genes for the UM67 strain growing with 0 mg/L (blue), 10 mg/L (green), and 20 mg/L (yellow) ZnSO4. d Proportion of symmetric 6mA sites and motif logo for UM67 growing with 0 mg/L ZnSO4 (left) and 20 mg/L ZnSO4 (right). e Upregulated genes (red) and downregulated genes (blue) that have lost a MAC when growing in media supplemented with 20 mg/L (top panel) and with 10 mg/L (bottom panel). Two-tailed P values were obtained from DESeq2 Wald’s test. Multiple comparison adjustments were performed with the Benjamini-Hochberg false discovery rate (FDR) correction procedure. f 6mA frequency profiles over upregulated and downregulated genes (20 mg/L vs 0 mg/L). The blue line indicates the 6mA frequency for UM67—0 mg/L, and the yellow line indicates the 6mA frequency for UM67—20 mg/L. g H3K4me3 enrichment (IP/Input ratio) over MAC lost when UM67 is grown with 20 mg/L ZnSO4 (right panel) compared to 0 mg/L (left panel). Each MAC was extended to 2000 bp and fragmented into 200 equally sized bins. h Profile and heatmap of 6mA and H3K4me3 enrichment (IP/Input ratio) for each cluster of genes (upregulated, upregulated with MAC lost; downregulated, downregulated with MAC lost). Red and blue lines in the profiles indicated upregulated and downregulated genes in the 20 mg/L vs 0 mg/L, respectively. For both 6mA and H3K4me3 panels, the panel on the left is for UM67—0 mg/L, and the panel on the right is for UM67—20 mg/L. i Normalized occupancy of nucleosome dyads in DEGs (20 mg/L vs 0 mg/L) was plotted in reference to TSS, including 1.5 kb flanking regions. A heatmap with the average normalized occupancy signal is also displayed below. Kolmogorov-Smirnov test (KS) was performed to evaluate differences between frequency distributions (P < 0.001). j Nucleosome classification according to their fuzziness score for upregulated (top panel) and downregulated (bottom panel) genes. Nucleosomes bound to genes with MAC lost (20 mg/L vs 0 mg/L) are indicated in light pink. Kolmogorov-Smirnov test (KS) was performed to evaluate differences between frequency distributions (P = 0.0053 for upregulated and P < 0.0001 for downregulated genes). Source data are provided as a Source Data file.
Fig. 7
Fig. 7. Model of epigenetic modifications distribution and epigenomic compartmentalization of the R microsporus genome.
A schematic representation of chromatin configurations in a nucleus showing the epigenetic landscape described in this study. The distribution of nucleosomes, 6mA, H3K4me3, H3K9me3, and H2A.Z on euchromatin and constitutive heterochromatin regions is displayed.

References

    1. Fusco, G. & Minelli, A. Phenotypic plasticity in development and evolution: facts and concepts. Philos. Trans. R. Soc. B Biol. Sci.365, 547–556 (2010). - PMC - PubMed
    1. Duncan, E. J., Gluckman, P. D. & Dearden, P. K. Epigenetics, plasticity, and evolution: how do we link epigenetic change to phenotype? J. Exp. Zoöl. Part B Mol. Dev. Evol.322, 208–220 (2014). - PubMed
    1. Adhikari, S. & Curtis, P. D. DNA methyltransferases and epigenetic regulation in bacteria. FEMS Microbiol. Rev.40, 575–591 (2016). - PubMed
    1. Casadesús, J. & Low, D. Epigenetic gene regulation in the bacterial world. Microbiol. Mol. Biol. Rev.70, 830–856 (2006). - PMC - PubMed
    1. Zhao, J. et al. Roles of adenine methylation in the physiology of Lacticaseibacillus paracasei. Nat. Commun.14, 2635 (2023). - PMC - PubMed