. 2025 Apr 24;16(1):3840.
doi: 10.1038/s41467-025-59248-6.

Neural representation of cytokines by vagal sensory neurons

Affiliations

Neural representation of cytokines by vagal sensory neurons

Tomás S Huerta et al. Nat Commun. .

Abstract

The nervous system coordinates with the immune system to detect and respond to harmful stimuli. Inflammation is a universal response to injury and infection that involves the release of cytokines. While it is known that information about cytokines is transmitted from the body to the brain, how the nervous system encodes specific cytokines in the form of neural activity is not well understood. Using in vivo calcium imaging, we show that vagal sensory neurons within the nodose ganglia exhibit distinct real-time neuronal responses to inflammatory cytokines. Some neurons respond selectively to individual cytokines, while others encode multiple cytokines with distinct activity patterns. In male mice with induced colitis, inflammation increased the baseline activity of these neurons but decreased responsiveness to specific cytokines, reflecting altered neural excitability. Transcriptomic analysis of vagal ganglia from colitis mice revealed downregulation of cytokine signaling pathways, while neuronal activity pathways were upregulated. Thus, nodose ganglia neurons perform real-time encoding of cytokines at the first neural station in a body-brain axis, providing a new framework for studying the dynamic nature of neuroimmune communication.


Conflict of interest statement

Competing interests: The authors declare no competing interests.

Figures
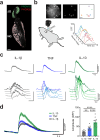
Fig. 1
Fig. 1. Individual nodose ganglia sensory neurons respond in a cytokine‐specific manner.
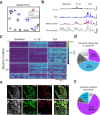
a PHOX2B and PRDM12 labeling reveals distinct subsets of placode‐derived and neural crest‐derived vagal sensory neurons in the jugular‐nodose ganglionic complex. Scale bar, 100 µm. IHC was repeated independently 5 times. b Schematic of Miniscope in vivo calcium imaging of the mouse vagal ganglia. Top images show (left to right): raw fluorescence signal, DFF map, and a region-of-interest map showing active neurons; scale bar, 50 µm. Plot shows example individual calcium transient traces from six active neurons. c Distinct neuronal responses to specific cytokines (IL‐1β, 200 ng/mL; TNF, 50 ng/mL, and IL‐10, 50 ng/mL) administered to the vagus nerve. d Sensory neuron responses to cytokines are different from one another in their DFF amplitude (mean ± SEM, per mouse, n = 9, 10, 11, left to right, IL-1β vs TNF, *** P = 0.0023, IL-1β vs IL-10 and TNF vs IL-10, **** P < 0.0001, two-sided, one-way ANOVA, Tukey test corrected for multiple comparisons).
Fig. 2
Fig. 2. Nodose ganglia population responses reveal subsets of cytokine‐specific neurons while others respond to multiple cytokines.
a Representative field of view showing neurons that respond to specific cytokines. b Representative traces from individual sensory neurons responding to specific cytokines. c Heatmap demonstrating selective cytokine‐specific responses in normalized neural activity index. White dotted lines indicate the time of cytokine application on the vagus nerve. d Pie chart depicting the proportion of total responsive neurons to specific cytokines, multiple cytokines or nonspecific activity. e Representative confocal microscopy images showing antibody labeling of IL‐1R1 (red) and TNFR1 (green) cytokine receptors on nodose ganglia cell bodies. Scale bar, 50 µm; Zoomed inset scale bar, 25 µm. IHC was repeated independently in 5 mice, quantified over 2 sections each. f Quantification of nodose ganglion cell bodies labeled for IL‐1R1 and TNFR1.
Fig. 3
Fig. 3. DSS‐colitis model damages gut tissue and increases serum and colon cytokines levels.
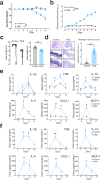
a DSS‐induced colitis produces significant reduction in percent change of body weight (per mouse, n = 6, *, P = 0.0297, Mixed-effects analysis). b DSS‐induced colitis produces an increase in disease activity score (n = 8 mice,***, P < 0.0001, Mixed-effects analysis). c Representative images of shortened colon length in DSS‐colitis group, with associated quantification (Control, n = 12 mice, DSS-colitis, n = 14 mice, **, P = 0.0028, two-tailed Mann–Whitney test). d Histological assessment of colon tissue by hematoxylin and eosin (H&E) staining reveals severe histological changes in DSS‐colitis colons (n = 20, 26, left to right, ***, P < 0.0001, two-tailed Mann–Whitney test). Scale bars for H&E images: top 1 mm, middle 100 µm, bottom 50 µm. e Colitis increases several serum cytokine levels at day 7 (peak disease, per mouse, n = 9, TNF day 7 *, P = 0.027, day *, P = 0.037; IL-10 *, P = 0.0246; IL-6 day 7, *, P = 0.016, day 14 *, P = 0.027; CXCL1 day 7, **, P = 0.0031, day 14 *, P = 0.04; MCP-1 day 7, *, P < 0.031, Mixed-effects analysis with Šidák correction). f DSS‐colitis increases several cytokine levels in the colon at day 7 (peak disease, per mouse, n = 9, IL-1β day 7, *, P = 0.0257; day 14, *, P = 0.048; TNF day 7, **, P = 0.009; IL-10 day 7, *, P = 0.043; IL-6 day 7, *, P = 0.039; CXCL1 day 7, **, P = 0.0049; MCP-1 day 7, *, P = 0.026, Mixed-effects analysis with Šidák correction). All error bars represent ± SEM.
Fig. 4
Fig. 4. Inflammatory state increases the number of active nodose ganglia neurons but decreases their response levels.
a Example ROI maps from a Control and DSS-colitis experiment, with sample traces from individual neurons during 50 s recording period. ROI map scale bar, 50 µm. b There were a higher number of spontaneously active nodose ganglia neurons in DSS-colitis mice at baseline (per mouse n = 11, whiskers indicate min/max value, bounds of box indicate 25% and 75% quartile, and line within box indicates median, ** P = 0.0033, two-tailed Mann–Whitney test). c Example spontaneous activity traces from individual neurons from Control and DSS‐colitis mouse groups. d Comparison of baseline activity reveals a significant reduction in the amplitude of calcium transients during DSS‐colitis (Control, n = 14 mice; DSS-colitis, n = 10 mice, * P = 0.026, two-tailed Mann–Whitney test). e Daily measurements of disease activity index reveal increased disease severity in DSS mice (Control = 7 mice, DSS-colitis n = 9 mice, *** P < 0.0001, Mixed-effects analysis with Šidák correction). f Measurement of post‐mortem colon length displays significant shortening on days 7 and 14 in the DSS group compared to controls (per mouse, n = 12, day 7 ** P = 0.0078, day 14 * P = 0.0274, Mixed-effects analysis with Šidák correction). g Analysis of baseline activity at several time points during disease progression reveals a significant reduction in the amplitude of spontaneous calcium transients in the DSS-colitis group at days 7 and 14 (per mouse, n = 9, day 7 * P = 0.0162, day 14 * P = 0.0354, Mixed-effects analysis with Šidák correction). All error bars represent ± SEM.
Fig. 5
Fig. 5. Specific gene pathways related to neuronal and inflammatory signaling are altered in DSS-colitis vagal ganglia.
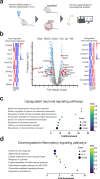
a Schematic showing the process for transcriptomic analyses of vagal ganglia from DSS-colitis mice. Created in BioRender. Chang, E. (2025) https://BioRender.com/poklo2e (b) Volcano plot showing individual transcriptomic changes in vagal ganglia from mice with DSS‐colitis. Upregulated neuronal signaling associated genes (Scn10a, Syt7, Cacna1h, Cacna2d2, Grin3b, Grik4, Kcnk18, Kcnj12, Tpcn1, Dbh), downregulated inflammation associated genes (S100a8, Ramp1, Ramp2, Tnfrsf12a, Tank, Tlr3, Il12a, Cxcl2, Ccl3, Ccl11). P-adjusted value was calculated using Benjamini-Hochberg correction, significance threshold was FDR < 0.05. c Weighted dot plot of a selection of significantly enriched biological pathways reveals upregulated neuronal pathways at peak colitis. d Weighted dot plot shows selected sets of downregulated genes associated with inflammatory signaling.
Fig. 6
Fig. 6. Inflammation reduces sensory neuron responses in a cytokine‐specific manner.
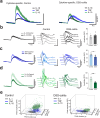
a Comparison of mean traces of sensory neuron responses demonstrates that DSS‐induced colitis alters the responses to specific cytokines (TNF and IL‐10) but not others (IL‐1β). b Mean traces, representative traces and quantifications reveal that IL‐1β responses do not change significantly during colitis (per mouse, n = 8, 7). c Mean traces, representative traces and quantifications reveal that TNF response amplitudes are significantly reduced during colitis (per mouse, n = 11, 10, **, P = 0.0062, Mann–Whitney test). d Mean traces, representative traces and quantifications reveal that IL‐10 response amplitudes are significantly reduced during colitis (per mouse, n = 7, 8, ***, P = 0.0003, Mann–Whitney test). e Differentiating neural responses to the three cytokines in a multi‐dimensional space. Response clusters from nodose ganglia neurons in DSS‐colitis mice have significantly reduced separability (per response, IL-1β, TNF, IL-10, Control, n = 153, 264, 223, DSS: n = 78, 83, 80, respectively). All error bars represent ± SEM.

References

    1. Andersson, U. & Tracey, K. J. Neural reflexes in inflammation and immunity. J. Exp. Med.209, 1057–1068 (2012). - PMC - PubMed
    1. Borovikova, L. V. et al. Vagus nerve stimulation attenuates the systemic inflammatory response to endotoxin. Nature405, 458–462 (2000). - PubMed
    1. Chavan, S. S., Pavlov, V. A. & Tracey, K. J. Mechanisms and therapeutic relevance of neuro-immune communication. Immunity46, 927–942 (2017). - PMC - PubMed
    1. Kressel, A. M. et al. Identification of a brainstem locus that inhibits tumor necrosis factor. Proc. Natl. Acad. Sci. USA117, 29803–29810 (2020). - PMC - PubMed
    1. Tracey, K. J. The inflammatory reflex. Nature420, 853–859 (2002). - PubMed

LinkOut - more resources