. 2025 Jul;643(8071):427-436.
doi: 10.1038/s41586-025-08922-2. Epub 2025 Apr 23.

Human de novo mutation rates from a four-generation pedigree reference

Affiliations

Human de novo mutation rates from a four-generation pedigree reference

David Porubsky et al. Nature. 2025 Jul.

Abstract

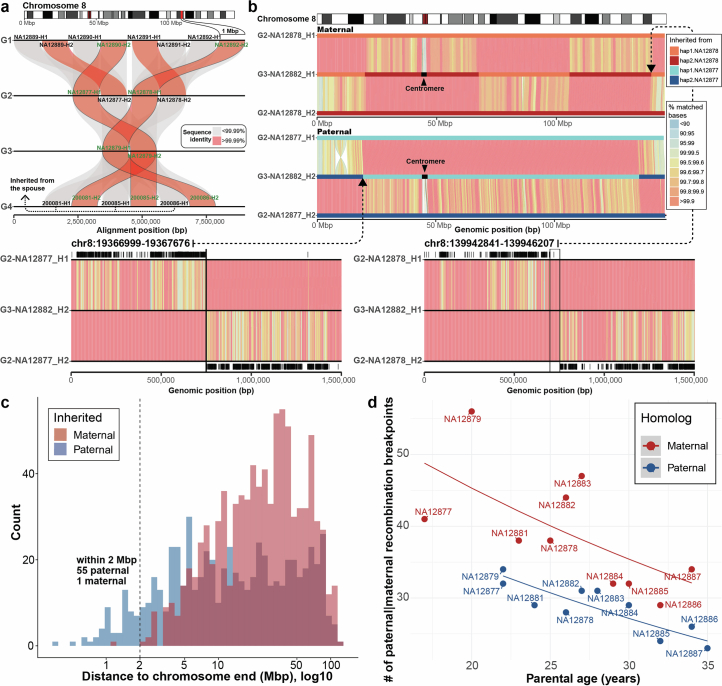
Understanding the human de novo mutation (DNM) rate requires complete sequence information1. Here using five complementary short-read and long-read sequencing technologies, we phased and assembled more than 95% of each diploid human genome in a four-generation, twenty-eight-member family (CEPH 1463). We estimate 98-206 DNMs per transmission, including 74.5 de novo single-nucleotide variants, 7.4 non-tandem repeat indels, 65.3 de novo indels or structural variants originating from tandem repeats, and 4.4 centromeric DNMs. Among male individuals, we find 12.4 de novo Y chromosome events per generation. Short tandem repeats and variable-number tandem repeats are the most mutable, with 32 loci exhibiting recurrent mutation through the generations. We accurately assemble 288 centromeres and six Y chromosomes across the generations and demonstrate that the DNM rate varies by an order of magnitude depending on repeat content, length and sequence identity. We show a strong paternal bias (75-81%) for all forms of germline DNM, yet we estimate that 16% of de novo single-nucleotide variants are postzygotic in origin with no paternal bias, including early germline mosaic mutations. We place all this variation in the context of a high-resolution recombination map (~3.4 kb breakpoint resolution) and find no correlation between meiotic crossover and de novo structural variants. These near-telomere-to-telomere familial genomes provide a truth set to understand the most fundamental processes underlying human genetic variation.


Conflict of interest statement

Competing interests: E.E.E. is a scientific advisory board member of Variant Bio. C. Lee is a scientific advisory board member of Nabsys and Genome Insight. D.P. has previously disclosed a patent application (no. EP19169090) relevant to Strand-seq. Z.N.K., C.N., E.D., C.F., C. Lambert, T.M., W.J.R. and M.A.E. are employees and shareholders of PacBio. Z.N.K. is a private shareholder in Phase Genomics. The other authors declare no competing interests.

Figures

Fig. 1
Fig. 1. Sequencing the CEPH 1463 pedigree with five technologies.
Twenty-eight members of the four-generation pedigree CEPH 1463 were sequenced using five orthogonal next-generation and LRS platforms: HiFi sequencing, Illumina and Element sequencing were performed on peripheral blood for G2–G4, and UL-ONT and Strand-seq data were generated on available lymphoblastoid cell lines for G1–G3. The pedigree dataset has been expanded to include the fourth generation and G3 spouses (200080 and 200100).
Fig. 2
Fig. 2. Summary of DNM rates.
a, The number of de novo germline mutations, PZMs and indels (<50 bp) for the parents (G2) and eight children in CEPH 1463. TR DNMs (<50 bp) are shown for G3 only because they have greater parental sequencing depth and we can assess transmission (Methods). The hatched bars show the number of SNVs confirmed as transmitting to the next generation. b, Germline SNVs (n = 626) have a mean allele balance of near 0.50 across the sequencing platforms, while the mean postzygotic SNV (n = 119) allele balance is less than 0.25. The box plots show the median (centre line), the interquartile range (IQR) (box limits) and the whiskers extend to 25% − 1.5 × IQR and 75% + 1.5 × IQR; outliers are shown as dots. c, A strong paternal age effect is observed for germline de novo SNVs (+1.55 DNMs per year; two-sided t-test, P = 0.013) but not for PZMs (P = 0.72). We observe no significant maternal age effect for DNMs (+0.20 DNMs per year, P = 0.54) or PZMs (P = 0.74). The solid lines are regression lines that were fitted using a linear model function; the surrounding shaded areas represent their 95% confidence intervals. d, The estimated SNV DNM rate by region of the genome shows a significant excess of DNM for large repeat regions, including centromeres and SDs. Assembly-based DNM calls on the centromeres and Y chromosome (chr.) show an excess of DNM in the satellite DNA. A significant difference from the autosomal DNM or PZM rate was determined using two-sided t-tests; *P < 0.05, **P < 0.001. P values for each comparison are as follows: 0.0066 (alignment-based DNMs in SDs), 0.049 (alignment-based PZMs in SDs), 0.017 (alignment-based DNMs in centromeres), 0.34 (alignment-based PZMs in centromeres), 0.13 (assembly-based DNMs in centromeric flanking regions), 0.14 (assembly-based DNMs in centromeric HORs), 0.59 (assembly-based DNMs in chromosome Y euchromatic regions) and 0.00025 (assembly-based DNMs in Yq12).
Fig. 3
Fig. 3. TR DNMs show motif-size-dependent mutation rates, paternal bias and are highly recurrent at specific loci.
a, TR DNM rates (mutations per haplotype per locus per generation) are displayed for each TR class (STR, VNTR or complex) as a function of the minimum motif size observed at each TR locus (n = 522) in the T2T-CHM13 reference genome (blue; left y axis).The average number of loci of each motif size that passed filtering criteria in each individual are displayed in grey (right y axis). The error bars denote the 95% Poisson CIs (computed using a χ2 distribution) around the mean mutation rate estimate. The mutation rates include all non-recurrent calls that pass TRGT-denovo filtering criteria and Element consistency analysis. b, The inferred parent-of-origin for confidently phased TR DNMs in G3. The hatching indicates transmission to at least one G4 child, where available. c, Pedigree overview of a recurrent VNTR locus at chromosome 8: 2376919–2377075 (T2T-CHM13) with motif composition GAGGCGCCAGGAGAGAGCGCT(n)ACGGG(n). Allele colouring indicates inheritance patterns as determined by inheritance vectors, with grey representing unavailable data. The symbols denote inheritance type relative to the inherited parental allele: plus (+) for de novo expansion and minus (−) for de novo contraction, shown only for the mutating alleles; the numbers indicate allele lengths in bp. De novo TR alleles are present in seven out of eight G3 individuals and transmit to four G4 individuals, with two expanding further after transmission. The spouse of a G3 individual (200080) carries a distinct TR allele that undergoes a de novo contraction in subsequent transmissions. d, Read-level evidence for the recurrent DNM in c, represented as vertical lines, obtained from individual sequencing reads, shown per sample. Where available, both HiFi (top) and ONT (bottom) sequencing reads are displayed. Colouring is consistent with the inheritance patterns in c; the outlined boxes with plus or minus markers highlight DNMs.
Fig. 4
Fig. 4. De novo SVs among centromeres transmitted across generations.
a, Summary of the number of correctly assembled centromeres (dark grey) as well as those transmitted to the next generation (light grey). Transmitted centromeres that carry a de novo deletion, insertion or both are coloured. b, The lengths of the de novo SVs within α-satellite HOR arrays and flanking regions. c, An example of a de novo deletion in the chromosome 6 α-satellite HOR array in G2-NA12878 that was inherited in G3-NA12887. The red arrows over each haplotype show the α-satellite HOR structure, and the grey blocks between haplotypes show syntenic regions. The deleted region is highlighted by a red outline. Mat., maternal; pat., paternal. d, An example of a de novo insertion and deletion in the chromosome 19 α-satellite HOR array of G3-NA12885. e,f, Magnification of the α-satellite HOR structure of the inserted (blue outline; e) and deleted (red outline; f) α-satellite HORs from d. The coloured arrows at the top of each haplotype show the α-satellite HOR structure. g, Example of two de novo deletions in the chromosome 21 centromere of G2-NA12877. The deletions reside within a hypomethylated region of the centromeric α-satellite HOR array, known as the CDR, which is thought to be the site of kinetochore assembly. The deletion of three α-satellite HORs within the CDR results in a shift of the CDR by around 260 kb in G2-NA12877.
Fig. 5
Fig. 5. Chromosome Y and an example of a de novo mobile element.
a, Pedigree of the nine male individuals carrying the R1b1a-Z302 Y chromosomes (left) and pairwise comparison of Y assemblies: closely related Y from HG00731 (R1b1a-Z225) and the most contiguous R1b1a-Z302 Y assemblies from three generations. Y-chromosomal sequence classes are shown with the pairwise sequence identity between samples in 100 kb bins, with quality-control-passed SVs identified in the pedigree male individuals shown as blue and red outlines. b, Summary of chromosome Y DNMs. Top, the structure of chromosome Y of G1-NA12889. Below the Y structure, all of the identified DNMs across G1–G3 Y assemblies are shown. Bottom, breakout by mutation class and by sample. DNMs that show evidence of transmission from G2 to G3–G4, and from G3-NA12886 to his male descendants in G4 are shown in grey. c, De novo SVA insertion in G3-NA12887. d, HiFi read support for the de novo SVA insertion in G3-NA12887.
Extended Data Fig. 1
Extended Data Fig. 1. Long-read sequencing and assembly contiguity.
a) Scatterplot of sequence read depth and read length N50 for ONT (blue) and PacBio (PB; magenta) with median coverage (dashed line) and different generations indicated (point shape). b) Scatterplot of the assembly contiguity measured in AuN values for Verkko (brown), hifiasm (UL) (light blue), and hifiasm (light grey) assemblies of G1-G4. Note: G4 samples were assembled using PacBio HiFi data (hifiasm) only; hifiasm (UL) refers to hifiasm assemblies integrating both PacBio HiFi and ONT data. c) Top: Total number of Verkko contigs whose maximum aligned bases are within +/−5% of the total T2T-CHM13 chromosome length. *Due to substantial size differences between the T2T-CHM13 Y (haplogroup J1a-L816) and the Y chromosome of this pedigree (haplogroup R1b1a-Z302), three contigs are shown that span the entire male-specific Y region without breaks (i.e., excluding the pseudoautosomal regions). Bottom: Each dot represents a single Verkko contig with the highest number of aligned bases in a given chromosome. d) Chromosomes containing complete telomeres and being spanned by a single contig are annotated as solid squares. In instances where the p- and q-arms are not continuously assembled and for acrocentric chromosomes, we plot diagonally divided and colour-coded triangles. e) Evaluation of centromere completeness across G1-G3 assemblies and across all chromosomes. We mark centromeres assembled by Verkko (brown), hifiasm (UL) (light blue), or both (green).
Extended Data Fig. 2
Extended Data Fig. 2. Recombination breakpoint map of CEPH 1463.
a) Depiction of intergenerational (G1- > G4) inheritance of a 1 Mbp assembled contig. Alignments transmitted between generations that are >99.99% identical (red) are contrasted with non-transmitted with lower sequence identity (grey). b) T2T recombination between child and parental haplotypes for Chromosome 8. Alignments between the parental and child haplotypes are binned into 500 kbp long bins and coloured based on the percentage of matched bases. Inherited maternal (shades of red) and paternal (shades of blue) segments are marked on top. Dashed arrows show zoom-in of the two recombination breakpoints that differ in size of the region of homology at the recombination breakpoint. Black tick marks show positions of mismatches between parental and child haplotypes. c) Distribution of distances of maternal (red) and paternal (blue) recombination breakpoints (G2-G4) to chromosome ends with respect to T2T-CHM13 (histogram bin size: 50). d) Significant association between the number of recombination breaks (y-axis) and parental age (x-axis) shown separately for maternal (red) and paternal (blue) recombination breakpoints (G2-G3) detected with respect to T2T-CHM13. Regression lines were fitted using Poisson GLM with a log link (p = 2.02 × 10−3, 7.88 × 10−4 for parental age and sex effects, respectively).
Extended Data Fig. 3
Extended Data Fig. 3. Number of germline and postzygotic SNVs transmitted to children.
a) The fraction of a parent’s germline SNVs (green, DNMs) and postzygotic SNVs (purple, PZMs) transferred to each child. b) The mean allele balance (AB) of DNMs (n = 249) and PZMs (n = 55) across HiFi, Illumina, and ONT data plotted against the fraction of children who inherited a variant are significantly correlated for DNMs (two-sided t-test, p = 0.0084) and PZMs (p = 0.00021). Half of PZMs with AB < 0.25 are transmitted to at least one child (n = 18/36). c) On average, DNMs are transmitted to 50% of children, while PZMs are transmitted to less than 25% of children. Boxes represent IQR including median line; whiskers extend to 25%  −  1.5 × IQR and 75%  +  1.5 × IQR, outliers are shown as dots. d) Number of DNMs and PZMs transmitted to each child in the pedigree.
Extended Data Fig. 4
Extended Data Fig. 4. Changes in centromere sequence, structure, and DNA methylation patterns across generations.
a) Schematic of the generalized organization of human centromeres and their flanking sequence. Major components and their structures are shown. HOR, higher-order repeat. Not drawn to scale. b) Deletion of an 18-monomer α-satellite HOR within the Chromosome 6 centromere of G2-NA12878 is inherited in G3-NA12887, shortening the length of the α-satellite HOR array by ~3 kbp. c) Sequence identity heatmap of the Chromosome 6 centromere in G1-NA128991 shows the high (~100%) sequence identity of α-satellite HORs along the entire centromeric array and at the site of the de novo deletion. d,e) Deletions of α-satellite HORs in regions outside of the centromere dip region (CDR) in the d) Chromosome 4 and e) Chromosome 11 centromeres does not affect the position of the CDR. f,g) Deletions and insertions of α-satellite HORs within the CDR in the f) Chromosome 19 and g) Chromosome 21 centromeres alter the distribution of the CDR.

References

    1. Nurk, S. et al. The complete sequence of a human genome. Science376, 44–53 (2022). - PMC - PubMed
    1. Altemose, N. et al. Complete genomic and epigenetic maps of human centromeres. Science376, eabl4178 (2022). - PMC - PubMed
    1. Vollger, M. R. et al. Segmental duplications and their variation in a complete human genome. Science376, eabj6965 (2022). - PMC - PubMed
    1. Guarracino, A. et al. Recombination between heterologous human acrocentric chromosomes. Nature617, 335–343 (2023). - PMC - PubMed
    1. Miga, K. H. & Eichler, E. E. Envisioning a new era: complete genetic information from routine, telomere-to-telomere genomes. Am. J. Hum. Genet.110, 1832–1840 (2023). - PMC - PubMed

LinkOut - more resources