. 2025 Jun;642(8068):776-784.
doi: 10.1038/s41586-025-08917-z. Epub 2025 Apr 23.

Targeting PIKfyve-driven lipid metabolism in pancreatic cancer

Affiliations

Targeting PIKfyve-driven lipid metabolism in pancreatic cancer

Caleb Cheng et al. Nature. 2025 Jun.

Abstract

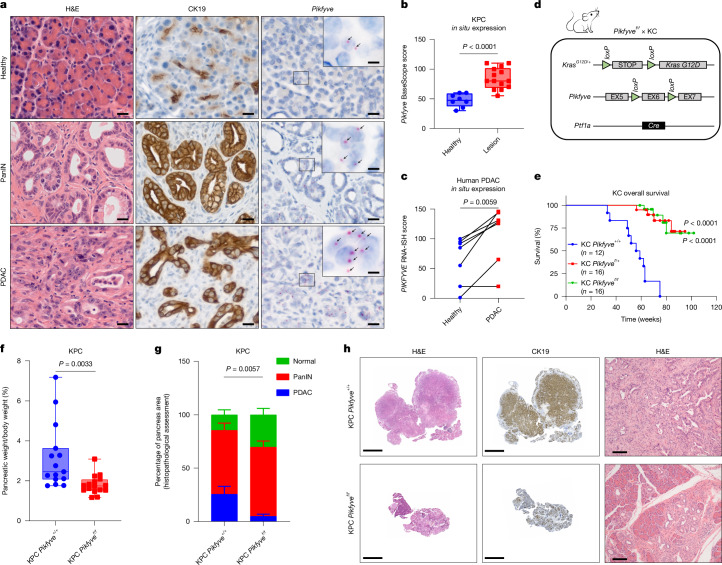
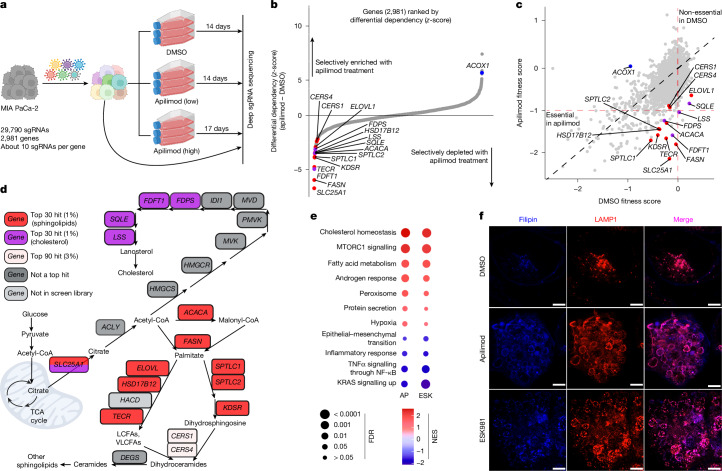
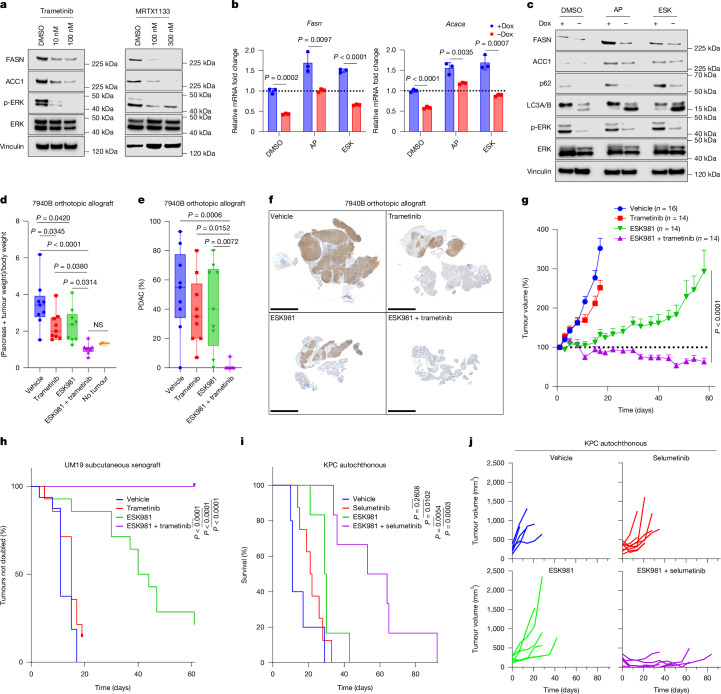
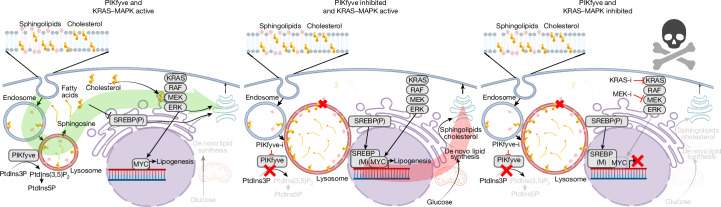
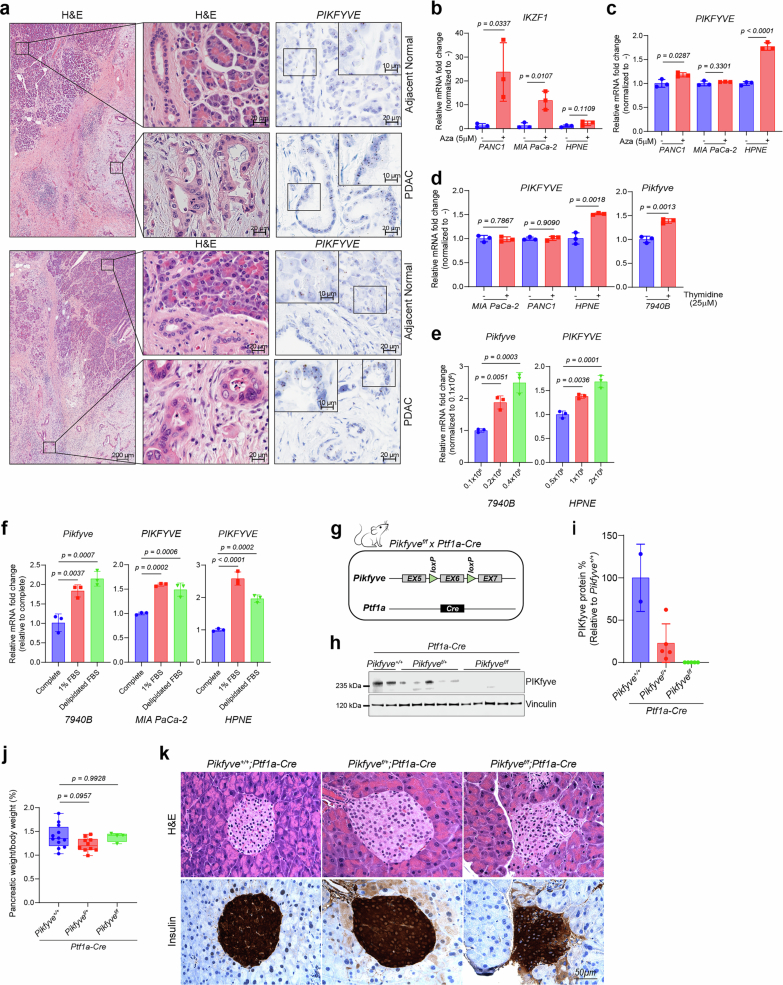
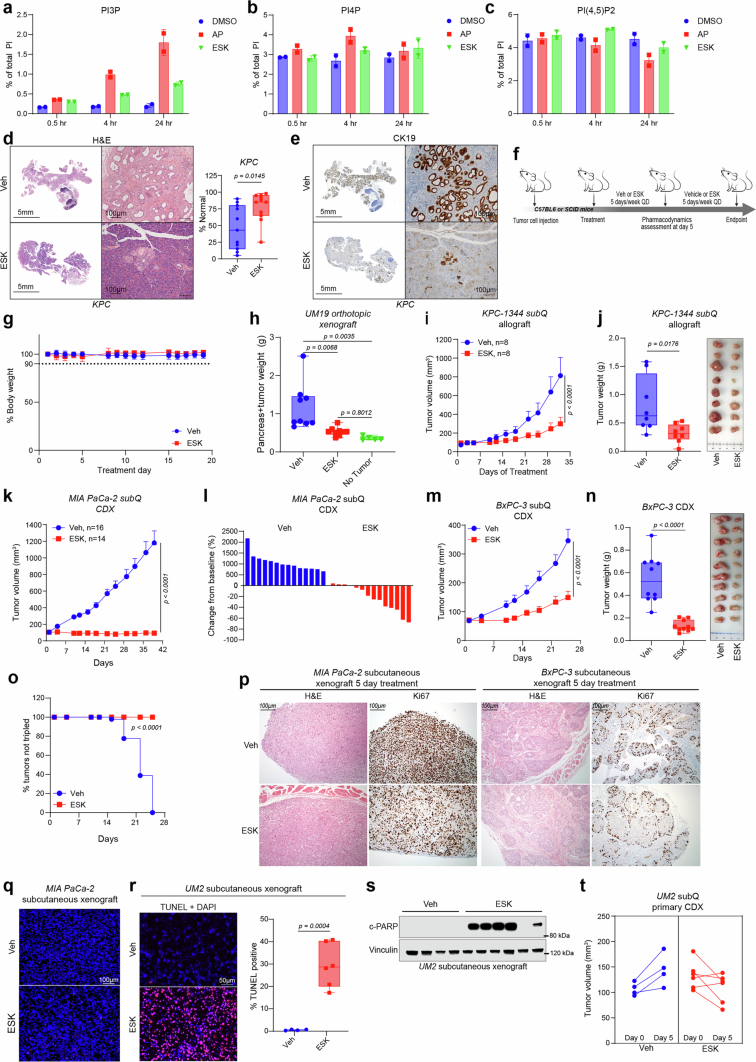
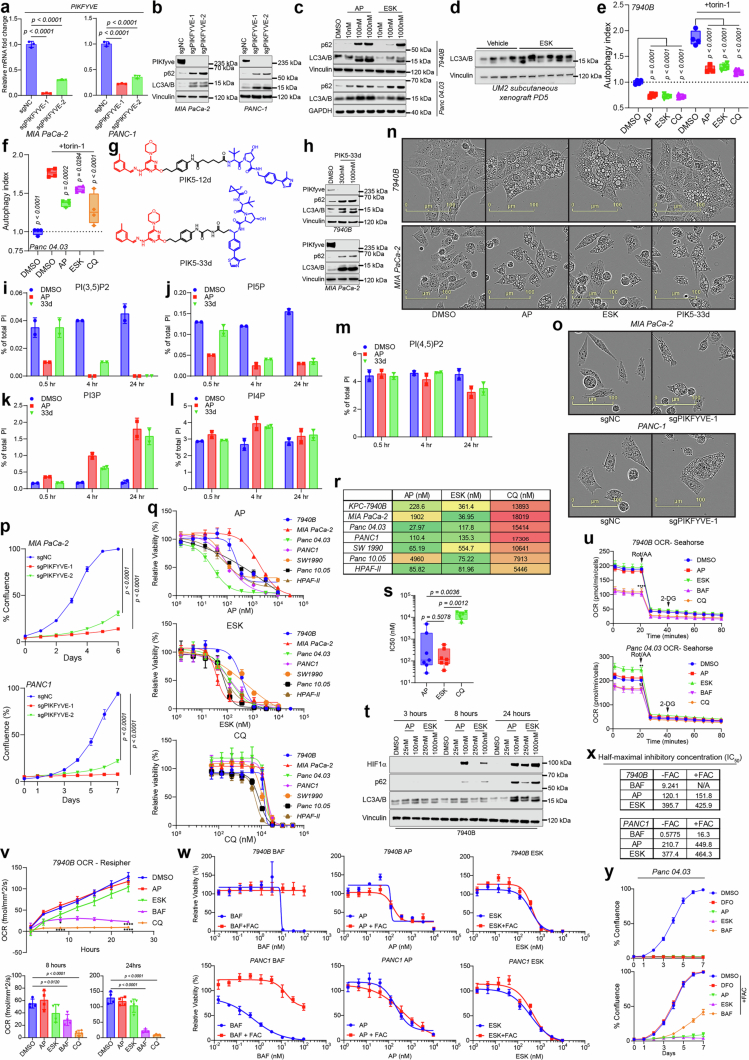
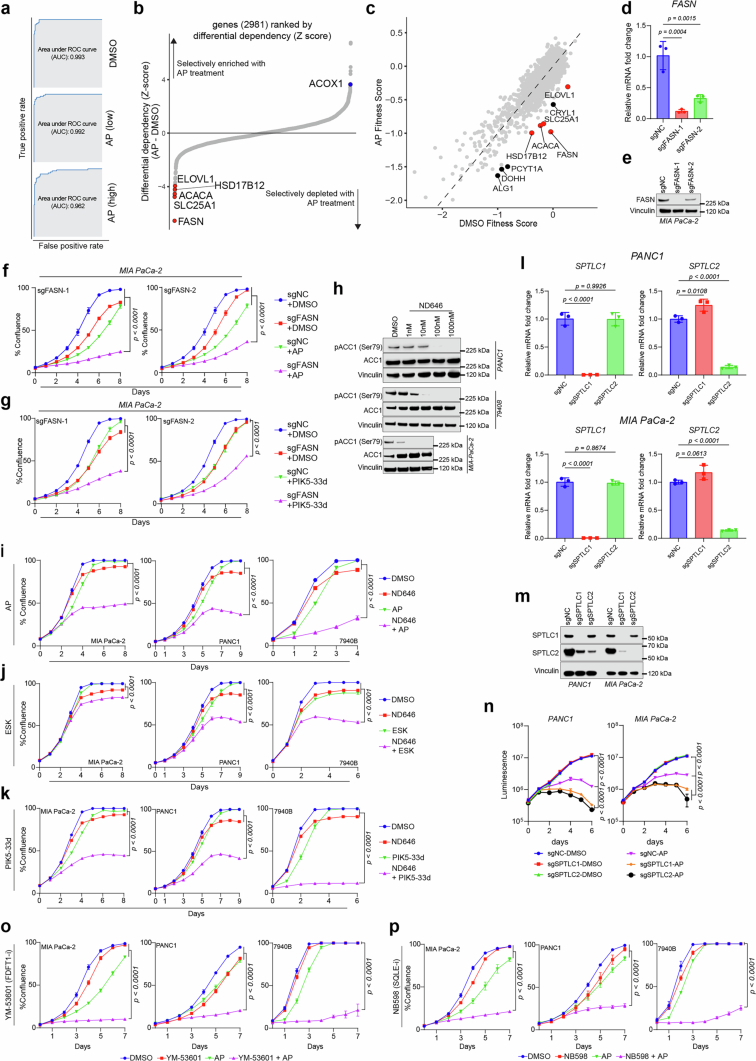
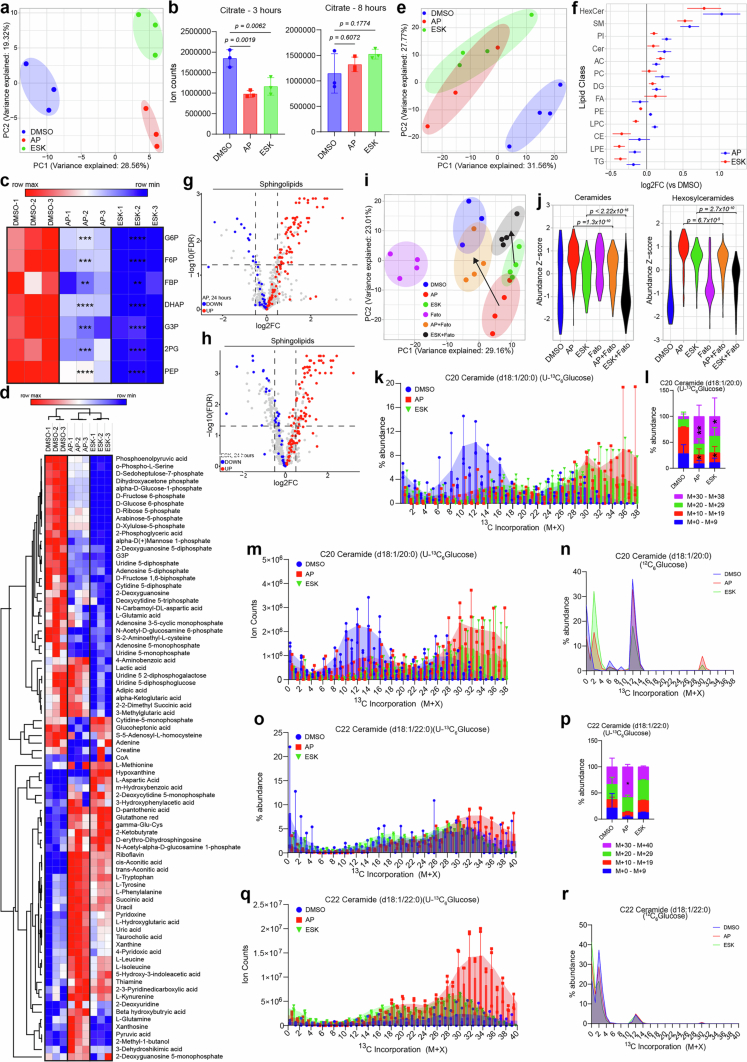
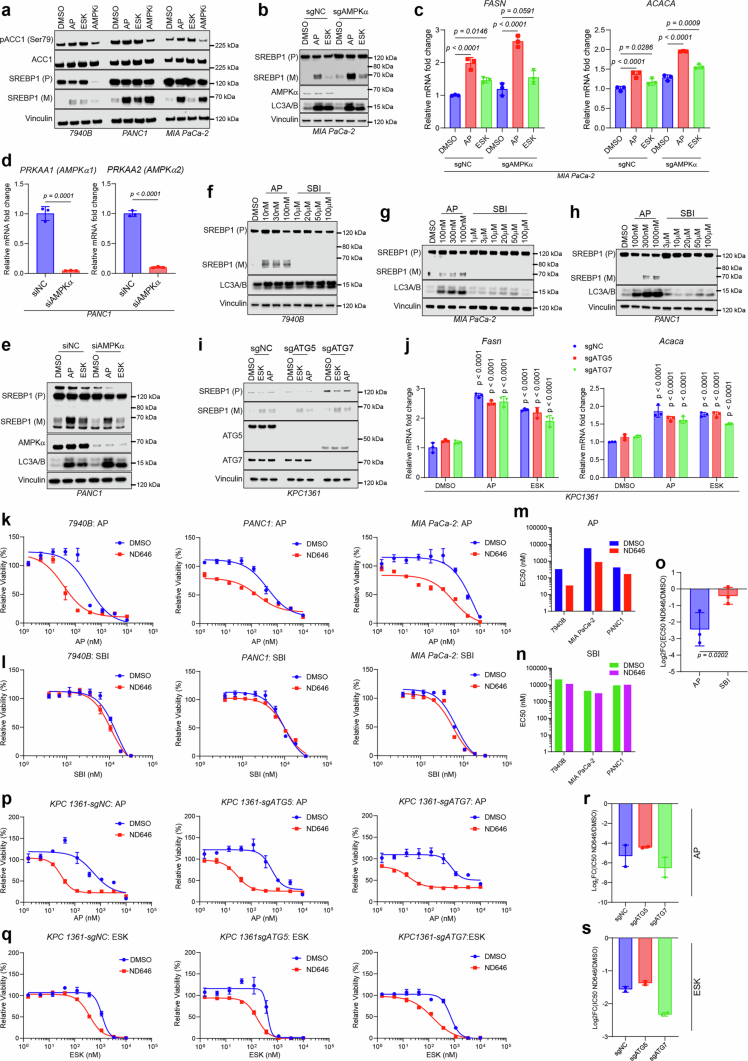
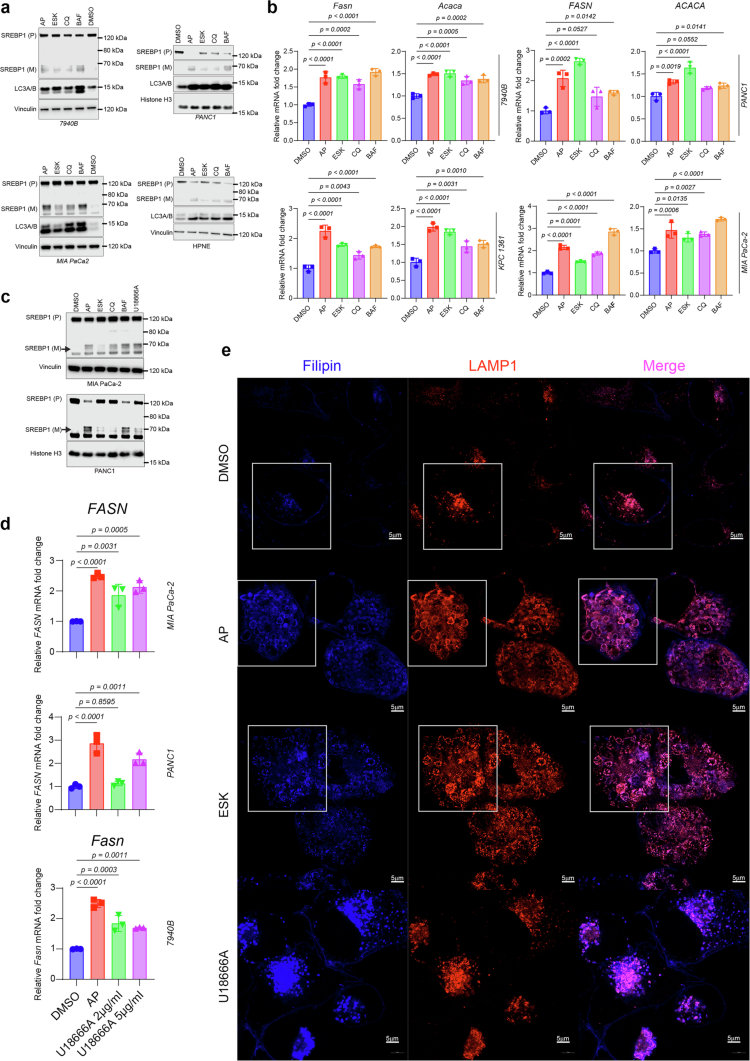
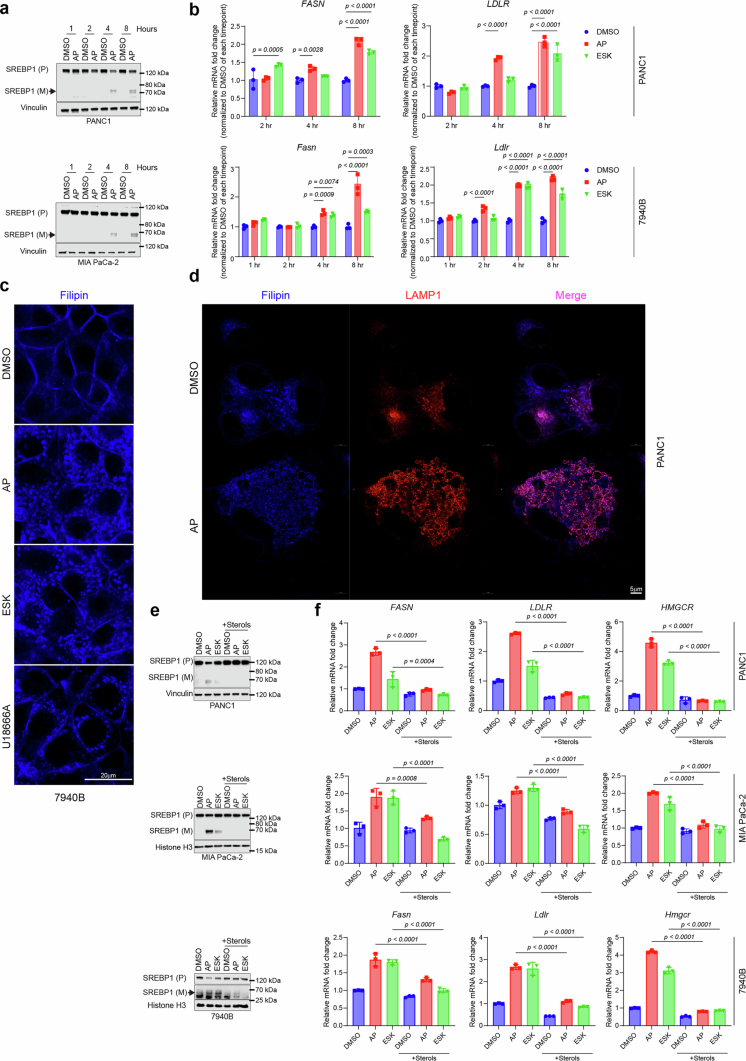
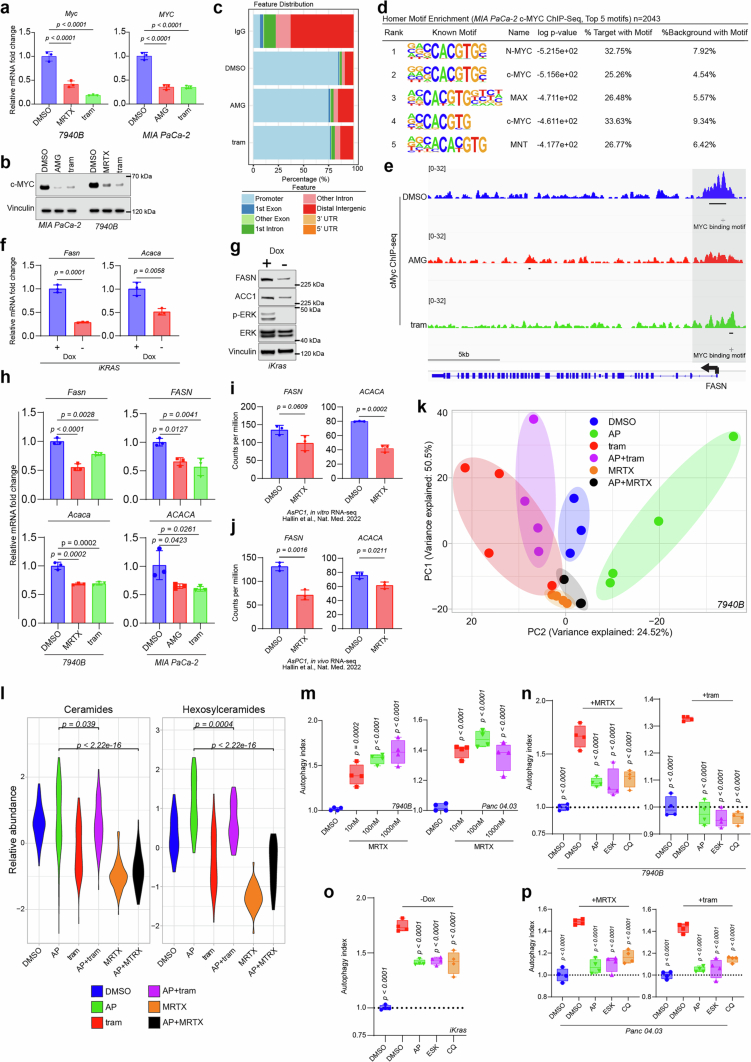
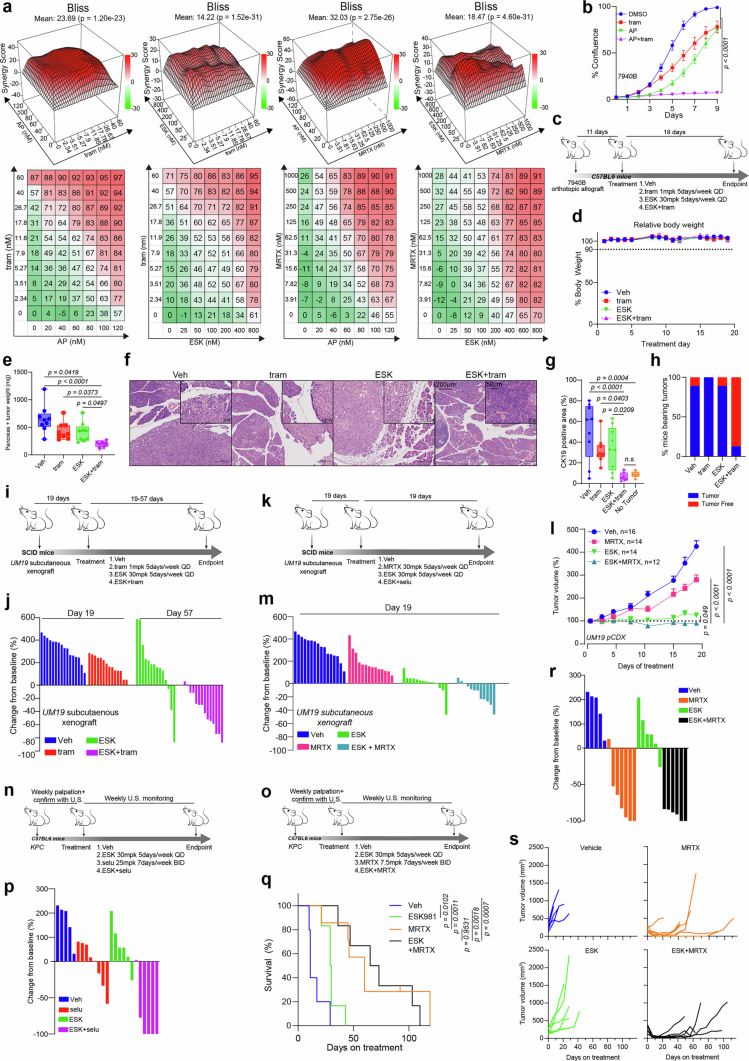
Pancreatic ductal adenocarcinoma (PDAC) subsists in a nutrient-deregulated microenvironment, making it particularly susceptible to treatments that interfere with cancer metabolism1,2. For example, PDAC uses, and is dependent on, high levels of autophagy and other lysosomal processes3-5. Although targeting these pathways has shown potential in preclinical studies, progress has been hampered by the difficulty in identifying and characterizing favourable targets for drug development6. Here, we characterize PIKfyve, a lipid kinase that is integral to lysosomal functioning7, as a targetable vulnerability in PDAC. Using a genetically engineered mouse model, we established that PIKfyve is essential to PDAC progression. Furthermore, through comprehensive metabolic analyses, we found that PIKfyve inhibition forces PDAC to upregulate a distinct transcriptional and metabolic program favouring de novo lipid synthesis. In PDAC, the KRAS-MAPK signalling pathway is a primary driver of de novo lipid synthesis. Accordingly, simultaneously targeting PIKfyve and KRAS-MAPK resulted in the elimination of the tumour burden in numerous preclinical human and mouse models. Taken together, these studies indicate that disrupting lipid metabolism through PIKfyve inhibition induces synthetic lethality in conjunction with KRAS-MAPK-directed therapies for PDAC.


Conflict of interest statement

Competing interests: A.M.C. is a co-founder and serves on the scientific advisory board of Esanik Therapeutics, which owns proprietary rights to the clinical development of ESK981. Esanik Therapeutics did not fund or approve the conducting of this study. A.M.C. is a co-founder and serves on the scientific advisory board of Medsyn Bio, Lynx Dx and Flamingo Therapeutics. A.M.C. serves as an advisor to Tempus, Proteovant, Aurigene Oncology, RAPTTA Therapeutics and Ascentage Pharmaceuticals. A.M.C., Y.Q., C.A.L., C.C., Y.B., K.D., Z.W. and C.L. are listed as inventors on the following patents pertaining to the development of methodologies and compounds targeting PIKfyve in diseases: PCT: PCT/US2021/057022 (A.M.C. and Y.Q.); PCT: PCT/US2024/017088 (A.M.C. and Y.Q.); PCT: PCT/CN2024/087809 (A.M.C., Y.Q., Z.W., K.D. and C.L.), US patent no: 63/537,996 (A.M.C., Y.Q. and Y.B.), US patent no: PCT/CN2024/078381 (C.A.L., A.M.C., K.D., Y.Q., Z.W. C.L., and C.C.). In the past three years, C.A.L. has consulted for Astellas Pharmaceuticals, Odyssey Therapeutics, Third Rock Ventures and T-Knife Therapeutics, and he is an inventor on patents pertaining to KRAS-regulated metabolic pathways, redox control pathways in pancreatic cancer and targeting the GOT1-ME1 pathway as a therapeutic approach (US patent no. 2015126580-A1, 2015; US patent no. 20190136238, 2019; and international patent no. WO2013177426-A2, 2015). The remaining authors declare no competing interests.

Figures

Fig. 1
Fig. 1. Pikfyve is essential for progression of precursor PanIN lesions to PDAC.
a, Representative images of PanIN and PDAC lesions and healthy tissue from a KPC mouse pancreas, showing H&E IHC staining for CK19 and BaseScope for Pikfyve. Arrows (insets) indicate areas of BaseScope positivity. b, In situ Pikfyve levels in KPC mouse pancreas lesion (PanIN or PDAC) versus normal (healthy) tissue, determined by BaseScope RNA-ISH probes targeting Pikfyve exon 6. Boxes represent the 25th and 75th percentiles; whiskers represent the range (unpaired two-tailed t-tests). c, In situ PIKFYVE levels in histologically normal or PDAC cells in seven human PDAC patient samples using RNA-ISH (RNAScope) (paired two-tailed t-tests). d, Breeding design for the generation of KC Pikfyve+/+, KC Pikfyvef/+ and KC Pikfyvef/f mice. Mouse cartoon adapted from Adobe Stock Image (asset no. 304271210). e, Overall survival of KC Pikfyve+/+, KC Pikfyvef/+ and KC Pikfyvef/f mice (two-sided log-rank test comparing KC Pikfyve+/+ with the other two curves separately). f, Pancreas tissue weight normalized to total body weight from KPC Pikfyve+/+ or KPC Pikfyvef/f mice at death. Boxes represent 25th and 75th percentiles; whiskers represent the range (unpaired two-tailed t-tests). g, Percentage of pancreas occupied by normal, PanIN or PDAC tissue at death. Bars are ±s.d. (two-way analysis of variance (ANOVA)). h, Representative histology showing CK19 IHC and H&E staining of whole pancreatic tissue from KPC Pikfyve+/+ and KPC Pikfyvef/f mice at 25 weeks. Scale bars: a, 20 μm (main images), 5 μm (insets); h, 5 mm (left and middle), 100 μm (magnified images, right). Source Data
Fig. 2
Fig. 2. Pharmacological inhibition of PIKfyve blocks pancreatic cancer progression in vivo.
a, Immunoblot analysis demonstrating stabilization of PIKfyve by apilimod (1,000 nM) or ESK981 (1,000 nM) in a cellular thermal shift assay in 7940B cells. b,c, Relative abundance of PtdIns(3,5)P2 (b) and PtdIns5P (c) in PANC1 cells following treatment with apilimod (1,000 nM) or ESK981 (1,000 nM) for the time indicated. Bars show ±s.d. d, Schematic of a prophylactic efficacy study of ESK981 on KPC mice. Mouse cartoon adapted from Adobe Stock Image (asset no. 304271210). e, Pancreatic tissue weight in vehicle or ESK981-treated KPC mice in comparison with age-matched wild-type (WT) mice. Boxes represent the 25th and 75th percentiles; whiskers represent the range (one-way ANOVA with Dunnett’s test). f, Quantification of lesions (PanIN or PDAC) in samples from e. Boxes represent the 25th and 75th percentiles; whiskers represent the range (unpaired two-tailed t-test). g, End-point pancreas + tumour weight normalized to total body weight of mice with 7940B orthotopic tumours. Pancreata of six age-matched non-tumour-bearing C57BL/6 mice were used as references. Boxes represent 25th and 75th percentiles; whiskers represent the range (one-way ANOVA with Tukey’s test). h, Representative H&E (top) and CK19 (bottom) images of pancreatic and pancreatic tumour tissues from g. i. Quantification of lesions from the 7940B orthotopic samples in g. Boxes represent 25th and 75th percentiles; whiskers represent the range (unpaired two-tailed t-tests). j, End-point pancreas + tumour weight normalized to total body weight of CB17 SCID mice with UM19 orthotopic tumours. Pancreata of five age-matched non-tumour-bearing CB17 SCID mice were used as references. Boxes represent 25th and 75th percentiles; whiskers represent the range (one-way ANOVA with Tukey’s test). k, Representative histology images showing CK19 IHC and H&E staining of the samples from j. Scale bars: h, 200 μm (top, main images), 5 μm (top insets), 5 mm (bottom); k, 5 mm (left), 200 μm (middle and right, main images), 50 μm (insets). Source Data
Fig. 3
Fig. 3. PIKfyve inhibition obligates PDAC cells to stimulate a lipogenic transcriptional and metabolic program.
a, Schematic of the metabolism-focused CRISPR screen in MIA PaCa-2 cells. Created in BioRender. Cheng, C. (2025) https://BioRender.com/d149928. b,c, Gene enrichment rank plot-based differential sgRNA representation (b) and scatter plot of gene fitness scores (c) of high dose (2,000 nM) and low dose (100 nM) apilimod-treated versus DMSO-treated end-point populations of the CRISPR screen experiment. Graphs show the top 30 synthetically lethal genes involved in fatty acid and sphingolipid synthesis (red), the top 30 synthetically lethal genes involved in cholesterol synthesis (purple) and genes that confer sensitivity to apilimod (blue). d, Metabolic map of sphingolipid and cholesterol synthesis. The figure shows the top 90 synthetically lethal genes involved in fatty acid and sphingolipid synthesis (red), the top 90 synthetically lethal genes involved in cholesterol synthesis (purple), genes ranked as essential in both DMSO and apilimod conditions (dark grey) and genes not included in the CRISPR screen library (light grey). Created in BioRender. Cheng, C. (2025) https://BioRender.com/yzgsylke, Pathway enrichment analysis of RNA-seq performed on 7940B cells treated with either apilimod (AP, 25 nM) or ESK981 (ESK, 250 nM) for 8 h. Dot sizes are inversely proportional to the false discovery rate (FDR). The colour scheme reflects the normalized enrichment score (NES). f, Immunofluorescence images of PANC1 cells treated with DMSO, apilimod (1,000 nM) or ESK981 (1,000 nM) for 24 h stained with filipin or LAMP1. Scale bars, 5 μm. These are cropped images shown for the sake of focus; the full images are shown in Extended Data Fig. 9.
Fig. 4
Fig. 4. Dual KRAS–MAPK and PIKfyve inhibition results in metabolic crises and synergistic growth suppression in PDAC.
a, Immunoblot analysis of 7940B cells treated with trametinib or MRTX1133 for 48 h. Vinculin served as a loading control. MRTX1133 and DMSO were refreshed every 12 h. b, Quantitative PCR (qPCR) of iKRAS 9805 cells after 48 h incubation with or without doxycycline (Dox) and subsequent 8-hour treatment with apilimod (AP, 50 nM), ESK981 (ESK, 300 nM) or DMSO for the genes Fasn and Acaca. Bars are ±s.d. (multiple unpaired two-tailed t-tests). c, Immunoblot analysis of iKRAS 9805 cells after 48 h incubation with or without doxycycline and subsequent 24 h treatment with apilimod (50 nM), ESK981 (300 nM) or DMSO. Vinculin served as a loading control. d, End-point pancreas + tumour weight normalized to total body weight. Pancreata of six age-matched non-tumour-bearing C57BL/6 mice were used as references. Boxes represent 25th and 75th percentiles; whiskers represent the range (one-way ANOVA with Tukey’s test); NS, not significant. e, Quantification of the proportion of PDAC in H&E sections from each tumour in d. Boxes represent 25th and 75th percentiles; whiskers represent the range (one-way ANOVA with Tukey’s test). f, Representative images of CK19 IHC staining of one tumour from each treatment arm in d. Scale bar, 5 mm. g, Tumour volumes (as a percentage of the initial volume) over the treatment course of the UM19 tumour model treated with trametinib ± ESK981. Bars show s.e.m. (two-way ANOVA with Šidák’s correction). The mice in the vehicle-treated and ESK981-treated groups are the same mice shown in Extended Data Fig. 12k–m. h, Kaplan–Meier estimates of time to tumour doubling for the mice in g (two-sided log-rank tests). i, Kaplan–Meier survival curves of KPC mice undergoing the treatments indicated (two-sided log-rank tests). The mice in the vehicle-treated and ESK981-treated groups are the same mice shown in Extended Data Fig. 12o–s. j, Tumour volumes of the KPC mice in i, measured by ultrasound. Source Data
Fig. 5
Fig. 5. Schematic depicting the effects of PIKfyve inhibition and KRAS–MAPK inhibition.
Left, with functional PIKfyve and KRAS–MAPK signalling, PDAC is at metabolic homeostasis, able to generate lipids through both de novo synthesis and lysosomal acquisition and recycling processes. Middle, with PIKfyve inhibition, lysosomal functions are disrupted, leading to lysosomal swelling or vacuolization and sequestering of lipids on lysosomal membranes. This leads to a relative decrease in cellular lipid availability, forcing PDAC cells to activate de novo lipid synthesis, activating SREBP and pro-lipogenic transcriptional and metabolic programs. Right, concurrent PIKfyve and KRAS–MAPK inhibition blocks both the lysosomal recycling and acquisition and the de novo synthesis pathways of obtaining lipids, leading to synthetic lethality. Created in BioRender. Cheng, C. (2025) https://BioRender.com/d149928.
Extended Data Fig. 1
Extended Data Fig. 1. PIKfyve is overexpressed in PDAC, regulated by nutrient availability, and dispensable for normal pancreatic development and function.
a. Representative image of two human PDAC patient samples showing H&E (left and middle) or PIKFYVE RNA-ISH (right). Scalebars are 200 μm (left), 20 μm (middle), 20 μm (right, low magnification), and 10 μm (right inset, high magnification). b-c. Quantitative PCR (qPCR) showing changes of IKZF1 (b) and PIKFYVE (c) in PANC1 (PDAC), MIA PaCa-2 (PDAC), and HPNE (hTERT-immortalized pancreatic epithelial) cells, treated with 5-aza-2-cytidine (5 μM) for 5 days, refreshed on day 3. CT levels were normalized first to β-actin and then to the “-” conditions for each cell line which were not treated with 5-aza-2-cytidine. Bars are +/-SD. (Unpaired two-tailed t-tests.). d. qPCR showing changes in PIKFYVE in MIA PaCa-2, PANC1, HPNE, or 7940B (murine KPC cell line) upon treatment with thymidine (25μM) for approximately 1 cell doubling time (48 hours for MIA PaCa-2, PANC1, and HPNE, and 24 hours for 7940B). CT values were normalized first to β-actin and then to the “-” conditions for each cell line which were not treated with thymidine. Bars are +/-SD. (Unpaired two-tailed t-tests.). e. qPCR showing changes in PIKFYVE in 7940B or HPNE cells upon overnight incubation after being seeded at different cell densities. CT values were normalized first to β-actin and then to the condition with the lowest cell density. Bars are +/-SD. (One way ANOVA with Dunnett’s.). f. qPCR showing changes in PIKFYVE in 7940B, MIA PaCa-2, or HPNE cells upon 24-hour incubation with the indicated media conditions. Complete= DMEM + 10% fetal bovine serum (FBS) + 1% penicillin/streptomycin (P/S), 1% FBS = DMEM + 1% FBS + 1% P/S, Delipidated FBS = DMEM + 10% lipid-depleted FBS + 1% P/S. Bars are +/-SD. (One way ANOVA with Dunnett’s.). g. Breeding design for the generation of Pikfyve specific deletion in Ptf1a-Cre mice. Mouse cartoon was adapted from Adobe Stock Image (Asset #304271210). h. Immunoblot analysis of pancreatic tissue from 12-week-old Ptf1a-Cre; Pikfyve+/+, Ptf1a-Cre; Pikfyvef/+, and Ptf1a-Cre; Pikfyvef/f mice showing changes in PIKfyve protein levels. Vinculin was used as a loading control. i. Densitometry analyses of immunoblot displayed in (h.) PIKfyve protein % was calculated by dividing the densitometry values for each PIKfyve band by the average value from the Pikfyve+/+ group. Bars are +/-SD. (One-way ANOVA with Dunnett’s.). j. Pancreas tissue weight normalized to total body weight for Ptf1a-Cre;Pikfyve+/+, Ptf1a-Cre;Pikfyvef/+, and Ptf1a-Cre;Pikfyvef/f mice. Box represents 25th and 75th percentiles; whiskers represent the range. (One-way ANOVA with Dunnett’s.). k. Representative images of H&E and insulin IHC staining from the pancreas tissue of Ptf1a-Cre;Pikfyve+/+, Ptf1a-Cre;Pikfyvef/+, and Ptf1a-Cre;Pikfyvef/f mice. Scalebar = 50 μm. Statistics and reproducibility: b. n = 3 technical replicates each condition per cell line. c. n = 3 technical replicates each condition per cell line. d. n = 3 technical replicates each condition per cell line. e. n = 3 technical replicates each condition per cell line. f. n = 3 technical replicates each condition per cell line. P-value: complete vs Delipidated FBS for HPNE:1.4e-5. i. Pikfyve + /+ n = 2, Pikfyvef/+ n = 5, Pikfyvef/f n = 5 individual animals). j. Ptf1a-Cre;Pikfyve+/+ n = 12, Ptf1a-Cre;Pikfyvef/+ n = 10, Ptf1a-Cre;Pikfyvef/f n = 4 individual animals. Source Data
Extended Data Fig. 2
Extended Data Fig. 2. PIKfyve is critical for progression of precursor PanIN lesions to PDAC.
a. Representative images of PIKfyve BaseScope staining from pancreas tissue of 27-week-old KC Pikfyve+/+, KC Pikfyvef/+, and KC Pikfyvef/f mice. Scalebar = 60 μm for zoomed-out images; 30 μm for zoomed-in images. b. Pikfyve levels as determined by BaseScope of KC Pikfyve+/+, KC Pikfyvef/+, and KC Pikfyvef/f murine pancreas tissue separated by normal and lesional areas. Box represents 25th and 75th percentiles; whiskers represent the range. (One way ANOVA with Dunnett’s.). c. Pancreas tissue weight from 27-week-old KC Pikfyve+/+, KC Pikfyvef/+, KC Pikfyvef/f, and age-matched wild-type (WT) mice. Box represents 25th and 75th percentiles; whiskers represent the range. (One-way ANOVA with Dunnett’s.). d. Pancreas tissue weight normalized to total body weight from KC Pikfyve+/+, KC Pikfyvef/+, KC Pikfyvef/f or age-matched wild-type (WT) mice at 27 weeks of age. Box represents 25th and 75th percentiles; whiskers represent the range. (One-way ANOVA with Dunnett’s.). e. Percentage of pancreas occupied by normal tissue as determined by histological analyses in KC Pikfyve+/+, KC Pikfyvef/+, and KC Pikfyvef/f mice at 27 weeks of age. Bars are +/- SEM. (One-way ANOVA with Dunnett’s.). f. Representative histological images showing H&E and CK19 staining on pancreatic tissue of KC Pikfyve+/+, KC Pikfyvef/+, and KC Pikfyvef/f mice at 27 weeks of age. Scalebar = 5 mm for the whole-pancreas images, 300 μm for the zoomed-in images. g. Raw pancreas tissue weight (top) and pancreatic weight normalized to total body weight (bottom) from 40-week-old KC Pikfyve+/+, KC Pikfyvef/+, and KC Pikfyvef/f, and age-matched wild-type (WT) mice. Box represents 25th and 75th percentiles; whiskers represent the range. (One-way ANOVA with Dunnett’s.). h. Percentage of pancreas occupied by normal tissue as determined by histological analyses of KC Pikfyve+/+, KC Pikfyvef/+, and KC Pikfyvef/f mice at 40 weeks of age. Box represents 25th and 75th percentiles; whiskers represent the range. (One-way ANOVA with Dunnett’s.). i. Breeding design for the generation of KPC Pikfyve+/+ and KPC Pikfyvef/f mice. Mouse cartoon was adapted from Adobe Stock Image (Asset #304271210). j. Representative images of PIKfyve BaseScope staining from pancreas tissue of 25-week-old KPC PIKfyve+/+ and KPC PIKfyvef/f mice. Scalebar = 20 μm. k. In situ Pikfyve levels in KPC Pikfyve+/+ and KPC Pikfyvef/f murine pancreas lesion vs normal tissue as determined by BaseScope. The KPC Pikfyve+/+ scores used as a reference are the same as those used in Fig. 1b. The two cohorts were stained and analyzed in the same batch. Box represents 25th and 75th percentiles; whiskers represent the range. (Multiple unpaired two-tailed t-test.). l. The age at death of mice in KPC PIKfyve+/+ and KPC PIKfyvef/f cohorts that were analyzed in Fig. 1f,g. Box represents 25th and 75th percentiles; whiskers represent the range. (Unpaired two-tailed t-test.). Statistics and reproducibility: b. n = 4 sections taken from individual KC Pikfyve+/+ animals analyzed for both normal and lesional areas; n = 5 sections taken from individual KC Pikfyvef/+ animals analyzed for both normal and lesional areas; n = 3 KC Pikfyvef/f sections taken from individual animals analyzed for normal and lesional areas. P-values: KC Pikfyve+/+ normal vs KC Pikfyvef/f normal:1.1e-5; KC Pikfyve+/+ lesion vs KC Pikfyvef/f lesion:3.1e-6. c. KC Pikfyve+/+ n = 4, KC Pikfyvef/+ n = 6, KC Pikfyvef/f n = 3, WT n = 3 individual animals. P-values: KC Pikfyve+/+ vs KC Pikfyvef/+:1.4e-8; KC Pikfyve+/+ vs KC Pikfyveff+:1.5e-8; KC Pikfyve+/+ vs WT:1.0e-8. d. KC Pikfyve+/+ n = 4, KC Pikfyvef/+ n = 6, KC Pikfyvef/f n = 3, WT n = 3 individual animals. P-values: KC Pikfyve+/+ vs KC Pikfyvef/+:2.1e-8; KC Pikfyve+/+ vs KC Pikfyvef/f:1.6e-8; KC Pikfyve+/+ vs WT:4.2e-9. e. KC Pikfyve+/+ n = 4, KC Pikfyvef/+ n = 6, KC Pikfyvef/f n = 3, WT n = 3 individual animals). f. These images are representative of n = 4 KC Pikfyve+/+; n = 6 KC Pikfyvef/+, n = 3 KC Pikfyvef/f; n = 3 WT. g. KC Pikfyve+/+ n = 7, KC Pikfyvef/+ n = 4, KC Pikfyvef/f n = 5, WT = 3 individual animals. h. KC Pikfyve+/+ n = 7, KC Pikfyvef/+ n = 4, KC Pikfyvef/f n = 5, WT = 3 individual animals. k. The KPC normal had n = 8 individual animals; the KPC lesion n = 14 individual animals; 8 animals were shared between these two groups. The KPC Pikfyvef/f normal group had n = 11 individual animals, and the KPC Pikfyvef/f lesion n = 16 individual animals; 11 animals were shared between these two groups. P-values: KPC Pikfyve+/+ normal vs KPC Pikfyve+/+ lesion:3.6e-5; KPC Pikfyve+/+ normal vs KPC Pikfyvef/f normal:1.9e-8; KPC Pikfyve+/+ lesion vs KPC Pikfyvef/f lesion: 1.6e-14. l. KPC PIKfyve+/+ n = 15, KPC PIKfyvef/f n = 16 individual animals. Source Data
Extended Data Fig. 3
Extended Data Fig. 3. Pharmacological inhibition of PIKfyve blocks pancreatic cancer progression and tumor growth.
a-c. Relative abundance of PI3P (a.), PI4P (b.), and PI(4,5)P2 (c.) in PANC1 cells upon treatment with apilimod (1000 nM) or ESK981 (1000 nM) for the indicated times. Bars are +/-SD. d. Representative H&E staining of whole pancreatic tissue from vehicle and ESK981 treated mice (left). Scalebar = 5 mm for the whole-pancreas images, 100 μm for the zoomed-in images. Quantification of histologically normal pancreatic tissue in vehicle or ESK981 treated mice (right). Box represents 25th and 75th percentiles; whiskers represent the range. (Unpaired two-tailed t-test.). e. Representative CK19 IHC staining of whole pancreatic tissue from vehicle or ESK981 treated mice (left). Scalebar = 5 mm for the whole-pancreas images, 100 μm for the zoomed-in images. f. Schematic of in vivo efficacy studies utilizing cell-derived xenograft (CDX) or allograft models. ESK981 was dosed at 30 mg/kg per day for 5 days/week (PO) in all studies. Mouse cartoons were adapted from Adobe Stock Image (Asset #304271210). g. Relative body weight of C57BL/6 mice used in Fig. 2g–i measured on the indicated treatment day. Bars are +/-SEM. h. Endpoint raw pancreas + tumor weight of CB17 SCID mice bearing UM19 orthotopic tumors. Pancreata of 5 age-matched non-tumor bearing CB17 SCID mice were used as references. Box represents 25th and 75th percentiles; whiskers represent the range. (One-way ANOVA with Tukey’s.). i. Tumor volumes of subcutaneous allograft model using KPC-derived KPC-1344 cells in response to vehicle or ESK981 in C57BL/6 mice. Bars are +SEM. (Two-way ANOVA.). j. Tumor weights (left) and images (right) of KPC-1344 model tumors at study endpoint. Box represents 25th and 75th percentiles; whiskers represent the range. (Unpaired two-tailed t-test.). k. Tumor volumes of subcutaneous CDX model using MIA PaCa-2 cells in response to vehicle or ESK981 in SCID mice. Bars are +SEM. (Two-way ANOVA.). l. Waterfall plot displaying changes in tumor volume comparing endpoint to baseline in response to vehicle or ESK981 treatment in MIA PaCa-2 CDX model. m. Tumor volumes of subcutaneous CDX model derived from BxPC-3 cells in response to vehicle or ESK981 in SCID mice. Data plotted are mean tumor volumes +SEM. (Two-way ANOVA.). n. Individual weights (left) and images (right) of tumors from CDX model derived from BxPC-3 cells at endpoint. Box represents 25th and 75th percentiles; whiskers represent the range. (Unpaired two-tailed t-test.). o. Kaplan–Meier estimates of time to tumor tripling of BxPC-3 CDX tumors after vehicle or ESK981 treatment. (Two-sided log-rank test.). p. Representative images of H&E and Ki67 IHC staining in MIA-PaCa-2 (left) and BxPC-3 (right) CDX models post vehicle or ESK981 treatment. q. Representative image of TUNEL staining from MDA-PaCa-2 CDX tumors after 5 days of treatment of vehicle or ESK981. r. Left panel, representative images of TUNEL staining from primary UM-2 CDX tumors after 5 days of treatment of vehicle or ESK981. Scalebar = 50 μm. Right panel, quantification of TUNEL positivity in indicated groups. Box represents 25th and 75th percentiles; whiskers represent the range. (Unpaired two-tailed t-test). s. Immunoblot analysis of primary UM2 CDX tumors after 5 days treatment of vehicle or ESK981 showing changes in apoptosis marker cleaved PARP (c-PARP). Vinculin was used as a loading control. t. Individual tumor volumes of a PDAC primary CDX UM-2 model before and after 5 days treatment of vehicle or ESK981. Statistics and reproducibility: a-c. One biological replicate of each condition was analyzed together, in two independent experiments for a total of n = 2 for each group. d. n = 11 individual animals for both groups. e. This image is representative of n = 11 individual animals for both groups. g. n = 8 individual animals for each group. h. vehicle n = 9, ESK981 n = 9, No Tumor n = 5 individual animals. i. n = 8 from 4 mice for each cohort, P-value: 4.4e-6. j. n = 8 tumors from 4 mice for each group. k. n = 16 from 8 mice for vehicle, n = 14 from 7 mice for ESK981. P-value: 5.8e-157. n = 14 from 7 mice for each group as 1 mouse in the vehicle reached humane endpoint prior to endpoint analysis. m. n = 12 tumors from 6 individual animals for vehicle, n = 10 tumors from 5 individual animals for ESK981. P-value: 5.7e-32. n. n = 10 tumors from 5 animals for each cohort as 1 mouse in the vehicle cohort reached humane endpoint prior to endpoint analysis. o. n = 12 tumors from 6 individual animals for vehicle, n = 10 tumors from 5 individual animals for ESK981. P-value = 1.7e-28. p. These images are representative of images from n = 4 tumors from individual animals for MIA PaCa-2 vehicle and ESK981 groups, n = 4 for BxPC-3 vehicle group, and n = 6 BxPC-3 ESK981 group. q. These images are representative of three. r. n = 4 (vehicle) or n = 6 (ESK981) individual tumors (from n = 2 or n = 3 animals, respectively) and each represent the mean of 5 representative images per tumor. s. This experiment was performed once. t. Vehicle n = 4 tumors from 2 animals; ESK981 n = 6 tumors from 3 animals. Source Data
Extended Data Fig. 4
Extended Data Fig. 4. Perturbation of PIKfyve disrupts autophagy, induces lysosomal vacuolization, and decreases PDAC cell growth through an iron-independent mechanism.
a. qPCR of MIA PaCa-2 (left) or PANC-1 (right) cells upon CRISPRi-mediated knockdown of PIKFYVE with two independent sgRNAs (sgPIKFYVE-1 and sgPIKFYVE-2) validating target knockdown compared to control (sgNC). Bars are +/-SD. (One way ANOVA with Dunnett’s.). b. Immunoblot analysis of MIA PaCa-2 (left) and PANC-1 (right) cells upon CRISPRi-mediated knockdown of PIKFYVE showing changes in PIKfyve, p62 (SQSTM1), and LC3A/B. Vinculin was used as a loading control for all blots. c. Immunoblot analysis of p62 and LC3A/B upon treatment with PIKfyve inhibitors apilimod or ESK981 in 7940B and Panc 04.03 cell lines. Vinculin or GAPDH were used as loading controls. d. Immunoblot of UM-2 primary cell-derived xenograft tumors described in Extended Data Fig. 3r,s. showing changes in LC3A/B. Vinculin was used as a loading control. e. Tandem fluorescent autophagic flux reporter assay in 7940B cells after 24-hour treatment with apilimod (100 nM), ESK981 (1000 nM), and chloroquine (CQ, 50 μM) with or without mTORC1/mTORC2 inhibitor torin-1 (100 nM). Box represents 25th and 75th percentiles; whiskers represent the range. (One-way ANOVA with Šidák’s.). f. Tandem fluorescent reporter assay in Panc 04.03 cells showing changes in autophagic flux upon 4-hour pre-treatment with DMSO, apilimod (300 nM), ESK981 (1000 nM), or chloroquine (30 mM) and subsequent treatment of torin-1 (100 nM) or DMSO for 24 hours. Box represents 25th and 75th percentiles; whiskers represent the range. (One-way ANOVA with Dunnett’s.). g. Chemical structures of PIK5-12d and PIK5-33d. Red indicates protein of interest ligand; black indicates chemical linker; blue indicates VHL E3 ligase ligand. h. Immunoblot of 7940B (top) and MIA PaCa-2 (bottom) cells treated with PIK5-33d at the indicated doses for 24 hours showing changes in p62 and LC3A/B. Vinculin was used as a loading control. i-m. Relative abundance of PI(3,5)P2 (i), PI5P (j), PI3P (k), PI4P (l), and PI(4,5)P2 (m) in PANC1 cells upon treatment with apilimod (1000 nM) or PIK-5-33d (33 d) (1000 nM) for the indicated times. The DMSO and apilimod conditions are from the same data used in Fig. 2b,c and Extended Data Fig. 3a–c and are used as comparisons for the effectiveness of PIK-5-33d. n. 20x bright-field images of 7940B (top) MIA-PaCa-2 (bottom) cells upon treatment with PIKfyve inhibitors apilimod or ESK981 or PIK5-33d for 8 h. o. 20x bright-field images of MIA-PaCa-2 (top) and PANC-1 (bottom) cells upon CRISPRi-mediated knockdown of PIKFYVE (sgPIKFYVE-1) or control (sgNC). p. Confluence assay of MIA PaCa-2 (top) and PANC1 (bottom) cells upon CRISPRi-mediated knockdown of PIKFYVE (sgPIKFYVE) or control (sgNC). Bars are +/-SEM (Two-way ANOVA with Dunnett’s.). q. Dose-response curve series of indicated PDAC cell lines treated with apilimod (top), ESK981 (middle), or chloroquine (bottom) for seven days using CellTiter-Glo assays. Bars are +/-SD. r. IC50 values of each drug in each cell line tested. s. Box-and-whisker plot displaying IC50 values of apilimod, ESK981, and chloroquine (CQ) in 7 human and mouse PDAC cell lines from (q-r). Box represents 25th and 75th percentiles; whiskers represent the range. Statistics were performed using a Repeated Measures one-way ANOVA with Reisser-Greenhouse correction and with Tukey’s multiple comparisons test with individual variances computed for each comparison. t. Immunoblot of 7940B cells treated as indicated assessing changes in HIF1α, p62, and LC3A/B. Vinculin was used as a loading control. u. Oxygen consumption rate (OCR) in 7940B (top) and Panc 04.03 (bottom) cells upon treatment with apilimod (100 nM), ESK981 (1000 nM), bafilomycin (BAF, 100 nM), or CQ (100 μM) for 8 hours. Automated addition of Rot/AA and 2-DG were performed at the indicated time points. Bars are +/-SEM. (One-way ANOVA with Dunnett’s.). v. (top) Real-time oxygen consumption rate monitoring by Resipher on 7940B cells upon treatment with apilimod (100 nM), ESK981 (1000 nM) bafilomycin (100 nM), or chloroquine (100 μM). (bottom) OCR at 8 hours and 24 hours by Resipher measurements from the same experiment. (One-way ANOVA with Dunnett’s.). w. Dose-response curve series of 7940B (top) and PANC-1 (bottom) cells treated with bafilomycin, apilimod, or ESK981 with or without ferric ammonium citrate (FAC). All conditions containing FAC were also treated with ferrostatin-1 (1 μM) to block incidental ferroptosis. Bars are +/-SD. x. IC50 values of each treatment in cell lines with or without FAC co-treatment. y. Confluence assay of Panc 04.03 cells undergoing treatment with deferoxamine (DFO) (100 μM), apilimod (300 nM), ESK981 (1000 nM), or bafilomycin (100 nM), without (top) or with (bottom) FAC (100 μg/mL) and ferrostatin-1 (1 μM). DFO, an iron chelator, was used as a positive control. Bars are +/-SEM. Statistics and reproducibility: a. Data shown are technical replicates from one of three independent experiments. P-values: sgNC vs sgPIKFYVE-1:8.7e-8: sgNC vs sgPIKFYVE-2:5.8e-7. b. This experiment was performed twice independently. c. This experiment was run twice in 7940B cells and once in Panc 04.03 cells. d. This experiment was performed once. e. n = 4 biological replicates for each condition. This represents one of three independent experiments. P-values: DMSO vs apilimod 4.4e-6; DMSO vs ESK981:1.7e-5; DMSO vs chloroquine:1.4e-5; DMSO+torin-1 vs apilimod+torin-1:1.2e-11; DMSO+torin-1 vs ESK981+torin-1:5.4e-11; DMSO+torin-1 vs chloroquine+torin-1:2.3-12. f. P-values: torin-1 vs DMSO: 5.6e-8; torin-1 vs torin-1+chloroquine: 2.1e-5. This experiment was performed independently thrice. h. These experiments were performed twice independently. i-m. One replicate of each condition was analyzed together, in two independent experiments (total n = 2 for each group). Bars are +/-SD. n-o. These images are representative of n = 3 each. p. n = 4 biological replicates. P-values: MIA PaCa-2: sgPIKFYVE-1 vs sgNC:1.7e-13; sgPIKFYVE-2 vs sgNC:1.7e-13; PANC1: sgPIKFYVE-1 vs sgNC:4.9e-14; sgPIKFYVE-2 vs sgNC:4.9e-14. These experiments were performed thrice each. q. n = 6 biological replicates. t. This experiment was performed twice. u. n = 5 biological replicates. Bars are +/-SEM. This experiment was performed twice independently. P-values: 7940B: DMSO vs chloroquine:1.9e-9; DMSO vs bafilomycin:9.1e-7. Panc 04.03: DMSO vs chloroquine:1.0e-3; DMSO vs bafilomycin:8.2e-3; DMSO vs ESK981:4.9e-3. v. Data shown are mean +/-SEM from 4 biological replicates. P-value: 8 hours DMSO vs chloroquine:6.6e-5; 24 hours DMSO vs bafilomycin:1.0e-7; 24 hours DMSO vs chloroquine:2.0e-8. w. n = 6 independent biological samples for each condition. y. n = 6 biological replicates. Source Data
Extended Data Fig. 5
Extended Data Fig. 5. De novo lipid synthesis is synthetically critical upon PIKfyve inhibition.
a. Receiver operator characteristic (ROC) curves for the prediction of core essential genes using datasets from MIA PaCa-2 CRISPR screens. b. Gene enrichment rank plot based differential sgRNA representation in (low dose, 100 nM) apilimod- treated versus DMSO-treated endpoint populations of the CRISPR screen experiment. Lipid synthesis-related genes ranked at either extreme are highlighted. c. Scatter plot of gene fitness scores in (low dose, 100 nM) apilimod-treated versus DMSO-treated endpoint conditions in metabolic CRISPR screen. Top 10 hits are labeled, and 5 lipid synthesis-related genes are highlighted. d. qPCR showing changes in mRNA levels of FASN upon CRISPRi-mediated knockdown of FASN in MIA PaCa-2 cells. (One-way ANOVA with Dunnett’s.). e. Immunoblot of MIA PaCa-2 upon CRISPRi-mediated knockdown of FASN in MIA PaCa-2 cells. Vinculin was used as a loading control for the immunoblot. f. MIA PaCa-2 cell confluence assays upon FASN knockdown (sgFASN) or control (sgNC) treated with apilimod (100 nM) or DMSO. The sgNC DMSO and sgNC AP conditions are shared between the two graphs. Bars are +/-SEM. (Two-way ANOVA with Dunnett’s.). g. Confluence assays of MIA PaCa-2 cells upon FASN knockdown or control upon treatment with PIKfyve degrader PIK5-33d (100 nM) or DMSO. The sgNC DMSO and sgNC PIK5-33d conditions are shared between the two graphs. Bars are +/-SEM. (Two-way ANOVA with Dunnett’s.). h. Immunoblots of PANC-1, 7940B, and MIA PaCa-2 cells upon treatment with ND646 at indicated doses for 24 hours showing changes in labeled targets. i. Confluence assays of MIA PaCa-2 (left), PANC1 (middle), and 7940B (right) cells upon treatment with ND646 (100 nM for MIA-PaCa2, 1000 nM for PANC-1 and 7940B), apilimod (100 nM for MIA PaCa-2, 50 nM for PANC1 and 7940B), or both. Bars are +/-SEM. (Two-way ANOVA with Dunnett’s.) The data for DMSO and ND646 are also utilized in Extended Data Fig. 5j (MIA PaCa-2) or 5j-k (PANC1 and 7940B), as they were generated in the same experiment. j. Confluence assays of MIA PaCa-2, PANC-1, and 7940B cells upon treatment with ND646 (100 nM for MIA-PaCa2, 1000 nM for PANC-1 and 7940B), ESK981 (30 nM for MIA PaCa-2, 100 nM for PANC-1 and 7940B), or both. Bars are +/-SEM. (Two-way ANOVA with Dunnett’s.) The data for DMSO and ND646 are also utilized in Extended Data Fig. 5i (MIA PaCa-2) or 5i,k (PANC1 and 7940B), as they were generated in the same experiment. k. Confluence assays of MIA PaCa-2, PANC-1, and 7940B cells upon treatment with ND646 (100 nM for MIA-PaCa2, 1000 nM for PANC-1 and 7940B), PIK5-33d (100 nM for MIA PaCa-2 and PANC-1, 1000 nM for 7940B), or both. Bars are +/-SEM. (Two-way ANOVA with Dunnett’s.) The data for DMSO and ND646 are also utilized in Extended Data Fig. 5i–k (PANC1 and 7940B), as they were generated in the same experiment. l. qPCR of PANC1 (top) and MIA PaCa-2 (bottom) upon CRISPRi-mediated knockdown of SPTLC1, SPTLC2, or control showing changes in SPTLC1 (left) and SPTLC2 (right). Bars are +/-SD. (One-way ANOVA with Dunnett’s.). m. Immunoblot of PANC1 and MIA PaCa-2 upon CRISPRi-mediated knockdown of SPTLC1, SPTLC2, or control showing changes in SPTLC1 and SPTLC2. Vinculin was used as a loading control. n. Luminescence values from CellTiter-Glo analyses on PANC1 (left) or MIA PaCa-2 (right) cells upon knockdown of SPTLC1, SPTLC2, or control, and treatment with apilimod (3000 nM) or DMSO for the indicated duration. Bars are +/-SEM. (Two-way ANOVA with Dunnett’s.). o. Confluence assays of MIA PaCa-2, PANC1, and 7940B upon treatment with DMSO, apilimod (300 nM for MIA PaCa-2, 100 nM for PANC1, and 50 nM for 7940B, YM-53601 (5000 nM), or both. Bars are +/-SEM. (Two-way ANOVA with Dunnett’s.). p. Confluence assays of MIA PaCa-2, PANC1, and 7940B upon treatment with DMSO, apilimod (300 nM for MIA PaCa-2, 100 nM for PANC1, and 50 nM for 7940B), NB-598 (5000 nM), or both. Bars are +/-SEM. (Two-way ANOVA with Dunnett’s.). Statistics and reproducibility: d. Data shown are technical triplicates from one of two independent experiments. e. This experiment was performed twice. f. n = 4 biological replicates. P-values: sgFASN-1+apilimod vs sgNC+DMSO:1.1e-16; sgFASN-1+apilimod vs sgFASN-1 + DMSO:1.8e-13; sgFASN-1+apilimod vs sgNC+apilimod:1.8e-13; sgFASN-2+apilimod vs sgNC+DMSO:1.8e-13; sgFASN-2+apilimod vs sgFASN-2 + DMSO:1.8e-13; sgFASN-2+apilimod vs sgNC+apilimod:1.8e-13. This experiment was performed twice. g. n = 4 biological replicates. P-values: sgFASN-1 + PIK5-33d vs sgNC+DMSO:1.8e-13; sgFASN-1 + PIK5-33d vs sgFASN-1 + DMSO:1.8e-13; sgFASN-1 + PIK5-33d vs sgNC+PIK5-33d:1.8e-13; sgFASN-2 + PIK5-33d vs sgNC+DMSO:1.8e-13; sgFASN-2 + PIK5-33d vs sgFASN-2 + DMSO:1.8e-13; sgFASN-2 + PIK5-33d vs sgNC+PIK5-33d:1.8e-13. This data is representative of two independent experiments. h. These experiments were performed once each. i. n = 6 biological replicates for MIA PaCa-2. n = 4 biological replicates per group for PANC1 and 7940B. P-values: MIA PaCa-2: ND646+apilimod vs DMSO:2.9e-13; vs ND646:2.9e-13; vs apilimod:2.9e-13; PANC1: ND646+apilimod vs DMSO: < 1.0e-15; vs ND646: < 1.0e-15; vs apilimod:<1.0e-15; 7940B: ND646+apilimod vs DMSO:1.5e-13; vs ND646:1.5e-13; vs apilimod:1.5e-13. j. n = 6 biological replicates for MIA PaCa-2. n = 4 biological replicates for PANC1 and 7940B. P-values: MIA PaCa-2: ND646 + ESK981 vs DMSO:2.9e-13; vs ND646:2.9e-13; vs ESK981:2.9e-13; PANC1: ND646 + ESK981 vs DMSO: < 1.0e-15; vs ND646: < 1.0e-15; vs ESK981: < 1.0e-15; 7940B: ND646 + ESK981 vs DMSO:2.2e-13; vs ND646:2.2e-13; vs ESK981:2.2e-13. These experiments were performed thrice each. k. n = 4 biological replicates. P-values: MIA PaCa-2: ND646 + PIK5-33d vs DMSO:1.8e-13; vs ND646:1.8e-13; vs PIK5-33d:1.8e-13; PANC1: ND646 + PIK5-33d vs DMSO: < 1.0e-15; vs ND646: < 1.0e-15; vs PIK5-33d:<1.0e-15; 7940B: ND646 + PIK5-33d vs DMSO:2.2e-13; vs ND646:2.2e-13; vs PIK5-33d:2.2e-13. These experiments were performed thrice each. l. n = 3 technical triplicates. P-values: PANC1-SPTLC1: sgNC vs sgSPTLC1:2.4e-5; PANC1-SPTLC2: sgNC vs sgSPTLC2:1.7e-5; MIA PaCa-2-SPTLC1: sgNC vs sgSPTLC1:4.6e-7; MIA PaCa-2-SPTLC2: sgNC vs sgSPTLC2:1.8e-5. m. This experiment was performed twice. n. n = 4 biological replicates. P-values: PANC1: sgNC+apilimod vs sgNC+DMSO: < 1.0e-15; sgNC+apilimod vs sgSPTLC1+DMSO: < 1.0e-15; sgNC+apilimod vs sgSPTLC2+DMSO: < 1.0e-15; sgNC+apilimod vs sgSPTLC1+apilimod:<1.0e-15; sgNC+apilimod vs sgSPTLC2+apilimod:<1.0e-15. MIA PaCa-2: sgNC+apilimod vs sgNC+DMSO: < 1.0e-15; sgNC+apilimod vs sgSPTLC1+DMSO: < 1.0e-15; sgNC+apilimod vs sgSPTLC2+DMSO: < 1.0e-15; sgNC+apilimod vs sgSPTLC1+apilimod:<1.0e-15; sgNC+apilimod vs sgSPTLC2+apilimod:<1.0e-15. o. n = 3 biological replicates. P-values: MIA PaCa-2: YM-53601+apilimod vs DMSO:3.0e-14; vs YM-53601:3.0e-14; vs apilimod:3.0e-14; PANC1: YM-53601+apilimod vs DMSO: 3.0e-14; vs YM-53601:3.0e-14; vs apilimod:3.0e-14; 7940B: YM-53601+apilimod vs DMSO: 3.0e-14; vs YM-53601:3.0e-14; vs apilimod:3.0e-14. p. n = 3 biological replicates. P-values: MIA PaCa-2: NB-598+apilimod vs DMSO:3.0e-14; vs NB-598:3.0e-14; vs apilimod:3.0e-14; PANC1: NB-598+apilimod vs DMSO: < 1.0e-15; vs NB-598: < 1.0e-15; vs apilimod:<1.0e-15; 7940B: NB-598+apilimod vs DMSO:3.0e-14; vs NB-598:3.0e-14; vs apilimod:3.0e-14. Source Data
Extended Data Fig. 6
Extended Data Fig. 6. PIKfyve inhibition activates an SREBP-dependent lipogenic transcriptional signature.
a. Scatter plot of log2 fold change in gene expression upon 8-hour treatment with apilimod (100 nM) vs DMSO (x-axis) and ESK981 (1000 nM) vs DMSO (y-axis). A linear regression was calculated with r- and p-values displayed. b. GSEA plots of cholesterol homeostasis and fatty acid metabolism using the fold change rank-ordered gene signature from the 7940B cells treated with apilimod or ESK981 for 8 hours. (GSEA enrichment test.). c-d. Volcano plot using RNA-seq analysis on 7940B cells treated with apilimod (25 nM, c.) or ESK981 (250 nM, d.) for eight hours highlighting SREBP-1 target genes. Vertical dashed lines indicate log2 fold change = +/-0.5). Horizontal dashed line indicates FDR = 10−6. e. Immunoblot showing PIKfyve, premature SREBP1 (SREBP1 (P)), and mature SREBP1 (SREBP1 (M)) in MIA PaCa-2, PANC-1, and 7940B cells upon treatment with PIKfyve inhibitors or degrader PIK5-33d (33 d) for 8 hours. Vinculin or histone H3 were used as loading controls. The drug doses used were as follows: MIA-PaCa-2 and PANC-1: apilimod=300 nM, ESK981 = 1000 nM, PIK5-33d = 1000 nM; 7940B: apilimod=100 nM, ESK981 = 1000 nM, PIK5-33d = 1000 nM. f. qPCR of MIA PaCa-2 and PANC1 showing changes in RNA levels of FASN upon CRISPRi-mediated knockdown of PIKFYVE. Bars are +/-SD. (One-way ANOVA with Dunnett’s.). g. Immunoblot analysis of MIA PaCa-2 and PANC1 showing changes in protein levels of FASN upon CRISPRi-mediated knockdown of PIKFYVE using two independent sgRNAs targeting PIKFYVE relative to control. Vinculin was used as a loading control. h. qPCR of MIA PaCa-2, PANC-1, and 7940B showing changes in RNA levels of labeled genes upon treatment with PIKfyve inhibitors for 8 hours. The drug doses used were as follows: MIA PaCa-2 and PANC-1: apilimod = 300 nM, ESK981 = 1000 nM. 7940B: apilimod = 100 nM, ESK981 = 1000 nM. Bars are +/-SD. (One-way ANOVA with Dunnett’s.). i-j. Immunoblot analysis of MIA PaCa-2, PANC1 (i.), and 7940B (j.) cells showing changes in protein levels of labeled genes upon treatment with PIKfyve inhibitors for 24 hours. Vinculin was used as a loading control. The drug doses used are indicated on the figure or as follows for PANC-1: apilimod = 300 nM, ESK981 = 1000 nM, PIK5-33d = 1000 nM. k. Immunoblot of MIA PaCa-2, PANC1, and 7940B cells treated with apilimod (100 nM for 7940B, 300 nM for MIA PaCa-2 and PANC1) or ESK981 (1000 nM) for 24 hours showing changes in LDLR. Vinculin was used as a loading control. l. qPCR showing changes in RNA levels of SQLE, FDFT1, HMGCR, or LDLR upon treatment with apilimod (100 nM for 7940B, 300 nM for MIA PaCa-2 and PANC1), or ESK981 (1000 nM) for 8 hours. Bars are +/-SD. (One-way ANOVA with Dunnett’s.). m. Immunoblot analysis of 7940B, PANC1, and MIA PaCa-2 cells upon treatment with apilimod (100 nM for 7940B, 300 nM for PANC1, and MIA PaCa-2), ESK981 (1000 nM), fatostatin (20 μM), apilimod + fatostatin, or ESK981 + fatostatin as indicated for eight hours showing changes in premature SREBP1 (P) and mature SREBP1 (M). Vinculin was used as a loading control for all blots. n. qPCR showing changes in FASN (top) or ACACA (bottom) upon treatment with apilimod (100 nM for 7940B, 300 nM for PANC1 and MIA PaCa-2), ESK981 (1000 nM), fatostatin (20 μM), apilimod + fatostatin, or ESK981 + fatostatin as indicated for eight hours. Bars are +/-SD. (One way ANOVA with Šídák’s multiple comparisons test.). o. qPCR of HPNE, MIA PaCa-2, and PANC1 cells showing differential baseline expressions of SREBF1 (left), FASN (middle), and ACACA (right). Ct values were normalized to β-actin first and then to HPNE. Bars are +/-SD. (One-way ANOVA with Dunnett’s.). Statistics and reproducibility: e. These experiments were performed twice with similar results. f. n = 3 technical triplicates. P-value: PANC1 FASN: sgNC vs sgPIKFYVE-1:5.5e-5. This experiment was performed thrice in MIA PaCa-2 cells with similar results and once in PANC1 cells. g. These experiments were performed once each. h. n = 3 technical triplicates. P-values: MIA PaCa-2 FASN: DMSO vs apilimod:2.0e-5; ACACA: DMSO vs ESK981:2.3e-5; PANC1 FASN DMSO vs apilimod:3.8e-7; DMSO vs ESK981:4.5e-6; 7940B Fasn DMSO vs apilimod:9.3e-7; DMSO vs ESK981:7.3e-5. These experiments were performed three independent times each with similar results. i. This experiment was performed once in each cell line. j. This experiment was performed twice with similar results. k. These experiments were performed once each. l. n = 3 technical triplicates per group. P-values: MIA PaCa-2: HMGCR: DMSO vs apilimod:5.3e-7; LDLR: DMSO vs apilimod:8.9e-7; PANC1: SQLE: DMSO vs apilimod:3.2e-8; DMSO vs ESK981:1.0e-6; HMGCR: DMSO vs apilimod:3.2e-8; DMSO vs ESK981:2.0e-5; 7940B: Fdft1: DMSO vs apilimod:1.2e-7; DMSO vs ESK981:2.0e-5; Hmgcr: DMSO vs apilmod:2.0e-7; DMSO vs ESK981:7.4e-6; Ldlr: DMSO vs apilimod:4.3e-5; DMSO vs ESK981:7.7e-5. m. These experiments were performed twice in each cell line. n. n = 3 technical triplicates per group. P-values: 7940B: Fasn: apilimod vs apilimod + fatostatin:2.4e-7; PANC1: FASN: ESK981 vs ESK981 + fatostatin:2.5e-6; ACACA: apilimod vs apilimod + fatostatin:3.2e-5; ESK981 vs ESK981 + fatostatin:1.8e-5; MIA PaCa-2: FASN: apilimod vs apilimod + fatostatin:1.1e-7; ACACA: apilimod vs apilimod + fatostatin:3.4e-5; ESK981 vs ESK981 + fatostatin:1.7e-5. HPNE: FASN: DMSO vs apilimod:2.8e-11; DMSO vs ESK981:2.6e-7; apilimod vs apilimod + fatostatin:6.9e-10; ESK981 vs ESK981 + fatostatin:6.8e-9; ACACA: DMSO vs apilimod:3.0e-5; apilimod vs apilimod + fatostatin:8.5e-5; ESK981 vs ESK981 + fatostatin:1.0e-7. o. n = 3 technical triplicates per group. P-values: SREBF1: HPNE vs MIA PaCa-2:1.5e-5; HPNE vs PANC1:1.5e-8; FASN: HPNE vs MIA PaCa-2:1.1e-6; HPNE vs PANC1:1.9e-9. Source Data
Extended Data Fig. 7
Extended Data Fig. 7. PIKfyve inhibition reprograms PDAC cell metabolism to favor lipogenesis.
a. Principal component analysis (PCA) of targeted metabolomics experiment on 7940B cells treated with DMSO, apilimod (100 nM), or ESK981 (1000 nM) for eight hours. b. Citrate levels as detected by LC-MS-based metabolomics on 7940B cells treated with apilimod (100 nM) or ESK981 (1000 nM) for either three or eight hours, as indicated. Bars are +/-SD. (One-way ANOVA with Dunnett’s.). c. Heatmap of glycolytic metabolite abundance in 7940B cells treated with DMSO, apilimod (100 nM), or ESK981 (1000 nM) for eight hours. G6P = glucose 6-phosphate; F6P = fructose 6-phosphate; FBP = fructose 1,6-bisphosphate; DHAP = dihydroxyacetone phosphate; G3P = glyceraldehyde 3-phosphate; 2PG = 2 phosphoglycerate; PEP = phosphoenolpyruvate. (One-way ANOVA with Dunnett’s.) The same data is represented in (d). d. Heatmap of significantly changed metabolites as determined by unpaired two-tailed t-test (apilimod vs DMSO or ESK981 vs DMSO, p < 0.05 in at least one of the two comparisons). Biological triplicates are displayed. e. PCA of targeted lipidomics experiment on 7940B cells treated with DMSO, apilimod (100 nM), or ESK981 (1000 nM) for 24 hours. Of note, one sample in the apilimod group was removed as an outlier. f. Forest plot indicating changes in lipid class abundance in 7940B cells upon treatment with DMSO, apilimod (100 nM), or ESK981 (1000 nM) for 24 hours. HexCer = hexosylceramide; SM = sphingomyelin; PI= phosphatidylinositol; Cer = ceramide; AC= acylcarnitine; PC= phosphatidylcholine; DG = diacylglyceride; FA = fatty acid; PE = phosphatidylethanolamine; LPC = lysophosphatidylcholine; CE = cholesteryl ester; LPE = lipophosphatidylethanolamine; TG = triacylglyceride. Effect sizes are in log2 scale of lipid abundance estimated from separate linear model for each treatment (apilimod or ESK981) compared to DMSO, adjusting for lipid classes with random intercept. Bars are 95% CI. g-h. Volcano plot showing differentially abundant lipid species in 7940B cells upon treatment with apilimod (100 nM, g) or ESK981 (1000 nM, h) for 24 hours. Highlighted in red are upregulated sphingolipid species. Highlighted in blue are downregulated sphingolipid species. (Two-tailed t-test using BH procedure to calculate FDR.). i. PCA of targeted lipidomics experiment on 7940B cells treated with DMSO, apilimod (100 nM), ESK981 (1000 nM), fatostatin (20 μM), apilimod + fatostatin, or ESK981 + fatostatin for 24 hours. Arrows are provided to highlight the change in lipid profile upon addition of fatostatin to apilimod or ESK981. Of note, data from one sample of the DSMO group was removed due to being a statistical outlier. j. Relative abundance of ceramides (left) and hexosylceramides (right) in 7940B cells upon treatment with apilimod (100 nM), ESK981 (1000 nM), fatostatin (20 μM), apilimod + fatostatin, or ESK+ fatostatin for 24 hours. (Unpaired two-tailed t-tests.). k. C20 ceramide (d18:1/20:0) isotopologue distribution in 7940B cells upon incubation with U-13C6 glucose and treatment with DMSO, apilimod (100 nM), or ESK91 (1000 nM) for 24 hours. Bars represent the range. l. Fractional enrichment pattern in C20 ceramide (d18:1/20:0) in 7940B cells upon incubation with U-13C6 glucose and treatment with DMSO, apilimod (100 nM), or ESK981 (1000 nM) for 24 hours, binned as indicated. Bars are +/-SD. (Two-way ANOVA with Dunnett’s with DMSO as the baseline.). m. Total ion counts of individual isotopologues of C20 ceramide (d18:1/20:0) in 7940B cells upon incubation with U-13C6 glucose and treatment with DMSO, apilimod (100 nM), or ESK981 (1000 nM). This is the pre-normalized data from (l). Bars represent the range. n. C20 ceramide (d18:1/20:0) isotopologue distribution in 7940B cells upon incubation with 12C6 glucose and treatment with DMSO, apilimod (100 nM), or ESK91 (1000 nM) for 24 hours. Extraneous peaks were detected at M + 12-14 and M + 30-32 which are suspected to be contaminating species that were co-eluted with our target species. o. Fractional enrichment pattern in C22 ceramide (d18:1/22:0) in 7940B cells upon incubation with U-13C6 glucose and treatment with DMSO, apilimod (100 nM), or ESK91 (1000 nM) for 24 hours. Bars represent the range. p. Data from (o) binned as indicated. Bars are +/-SD. (Two-way ANOVA with Dunnett’s.). q. Total ion counts of individual isotopologues of C22 ceramide (d18:1/22:0) in 7940B cells upon incubation with U-13C6 glucose and treatment with DMSO, apilimod (100 nM), or ESK981 (1000 nM). This is the pre-normalized data from (o). Bars represent the range. r. C22 ceramide (d18:1/22:0) isotopologue distribution in 7940B cells upon incubation with 12C6 glucose and treatment with DMSO, apilimod (100 nM), or ESK981 (1000 nM) for 24 hours. Extraneous peaks were detected at M + 12-14 which is suspected to be a contaminating species that were co-eluted with our target species. Statistics and reproducibility: b. n = 3 biological replicates. c. * indicates p < 0.05, ** indicates p < 0.01, *** indicates p < 0.001, **** indicates p < 0.0001. P-values: G6P: DMSO vs apilimod:9.0e-4; DMSO vs ESK981:2.6e-5; F6P: DMSO vs apilimod:5.5e-4; DMSO vs ESK981:2.6e-5; FBP: DMSO vs apilimod:0.007; DMSO vs ESK981:0.002; DHAP: DMSO vs apilimod:6.8e-6; DMSO vs ESK981:3.1e-7; G3P: DMSO vs apilimod:1.2e-4; DMSO vs ESK981:4.1e-5; 2PG: DMSO vs apilimod:8.2e-4; DMSO vs ESK981:7.2e-5; PEP: DMSO vs apilimod:6.9e-6; DMSO vs ESK981:1.5e-7. f-h. n = 4 biological replicates for DMSO and ESK981; n = 3 biological replicates for apilimod. i; n = 4 biological replicates per group for AP, ESK, Fato, AP+Fato, and ESK+Fato groups, n = 3 for the DMSO group. j. n = 4 biological replicates per group for AP, ESK, Fato, AP+Fato, and ESK+Fato groups, n = 3 for the DMSO group. P-values: Ceramides: ESK981 vs ESK981 + fatostatin:2.6e-39. k. n = 3 biological replicates per group. l. n = 3 biological replicates per group. P-values: M + 10-M + 19: DMSO vs AP:0.031; DMSO vs ESK:0.040; M + 30-M + 38: DMSO vs AP:0.0021; DMSO vs ESK:0.034. m. n = 3 biological replicates each. o. n = 3 biological replicates per group. p. n = 3 biological replicates per group. P-value: M + 30-M + 40: apilimod vs DMSO:0.013. q. n = 3 biological replicates per group. Source Data
Extended Data Fig. 8
Extended Data Fig. 8. PIKfyve inhibition does not activate SREBP-dependent transcriptional signatures primarily through AMPK or autophagic pathways.
a. Immunoblot analysis of 7940B, PANC1, and MIA PaCa-2 cells upon treatment with apilimod (100 nM for 7940B, 300 nM for PANC1 and MIA PaCa-2), ESK981 (1000 nM), or Compound C (dorsomorphin, labeled “AMPKi”, 20 μM) for eight hours showing changes in pACC1 (Ser 79), total ACC1, SREBP1 (P), and SREBP1 (M). Vinculin was used as loading control. b. Immunoblot analysis of MIA PaCa-2 cells upon CRISPR knockout of PRKAA1 and PRKAA2 (AMPKα1 and AMPKα2) or control and treatment with apilimod (300 nM) or ESK981 (1000 nM) for eight hours showing changes of SREBP1 (P), SREBP1 (M), AMPKα, and LC3A/B. Vinculin was used as a loading control. c. qPCR analysis showing changes in FASN (left) or ACACA (right) of MIA PaCa-2 upon CRISPR knockout of AMPKα1/2 and treatment with apilimod (300 nM) or ESK981 (1000 nM) for eight hours. All conditions were normalized to sgNC-DMSO condition. Bars are +/-SD. (One way ANOVA with Šídák’s multiple comparisons test.). d. qPCR of PANC1 cells upon siRNA knockdown of PRKAA1 and PRKAA2 (AMPKα1 and AMPKα2) or control showing changes in PRKAA1 and PRKAA2 (AMPKα1 and AMPKα2). Bars are +/-SD. (Unpaired two-tailed t-test.). e. Immunoblot analysis of PANC1 cells upon siRNA knockdown of AMPKα1/2 or control and treatment with apilimod (300 nM) or ESK981 (1000 nM) for eight hours showing changes in SREBP1 (P), SREBP1 (M), AMPKα, and LC3A/B. Vinculin was used as a loading control. f. Immunoblots of 7940B cells treated with apilimod or SBI-0206965 at the indicated doses for eight hours showing changes in SREBP1 (P), SREBP1 (M), and LC3 A/B. Vinculin was used as a loading control. This experiment was performed twice with similar results. g. Immunoblots of MIA PaCa-2 cells treated with apilimod or SBI-0206965 at the indicated doses for eight hours showing changes in SREBP1 (P), SREBP1 (M), and LC3 A/B. Vinculin was used as a loading control. This experiment was performed twice with similar results. h. Immunoblots of PANC1 cells treated with apilimod or SBI-0206965 at the indicated doses for eight hours showing changes in SREBP1 (P), SREBP1 (M), and LC3 A/B. Vinculin was used as a loading control. This experiment was performed twice with similar results. i. Immunoblot analysis of KPC 1361-sgNC, KPC 1361-sgATG5, or KPC 1361-sgATG7 cells treated with DMSO, ESK981 (1000 nM), or apilimod (300 nM) for eight hours showing changes in SREBP1 (P), SREBP1 (M), ATG5, and ATG7. Vinculin was used as a loading control. This experiment was performed twice with similar results. j. qPCR of KPC 1361-sgNC, KPC 1361-sgATG5, or KPC 1361-sgATG7 cells treated with DMSO, apilimod (300 nM), or ESK981 (1000 nM) for eight hours showing changes in Fasn (left) or Acaca (right). Bars are +/-SD. (Two-way ANOVA with Dunnett’s multiple comparison test, setting DMSO as the reference for each cell line.). k-l. Dose-response curves of PANC1, MIA PaCa-2, or 7940B cells treated with either apilimod (top) or SBI-0206965 (SBI, ULK inhibitor) at the indicated doses and co-treated with either DMSO or ND646 (100 nM for MIA PaCa-2, 1000 nM for PANC1 and 7940B) for seven days. Relative viabilities were calculated by normalizing all values to the DMSO condition. Bars are +/-SD. m. EC50 of apilimod in 7940B, MIA PaCa-2, or PANC1 cells upon co-treatment with DMSO or ND646. n. EC50 of SBI-0206965 in 7940B, MIA PaCa-2, or PANC1 cells upon co-treatment with DMSO or ND646. o. Log2 of the fold change in EC50 of apilimod or SBI-0206965 upon co-treatment with ND646 for 7940B, MIA PaCa-2, and PANC1 cells. Bars are +/-SD. (Paired two-tailed t-test.). p-q. Dose-response curves of KPC 1361-sgNC, KPC 1361-sgATG5, or KPC 1361-sgATG7 treated with indicated doses of apilimod and co-treated with either DMSO or ND646 (1000 nM) for seven days. Relative viabilities were calculated by normalizing all values to the DMSO condition. Bars are +/-SD. r. Dose-response curves of KPC 1361-sgNC, KPC 1361-sgATG5, or KPC 1361-sgATG7 treated with indicated doses of ESK981 and co-treated with either DMSO or ND646 (1000 nM) for seven days. Relative viabilities were calculated by normalizing all values to the DMSO condition. Bars are +/-SD. s. Log2 of the fold change in IC50 of apilimod (top) or ESK981 (bottom) treatment upon co-treatment with ND646 (1000 nM) versus DMSO as calculated from two independent replicates of the experiments using KPC1361-sgNC, KPC1361-sgATG5, and KPC1361-sgATG7 displayed in Extended Data Fig. 8p,q. Bars are +/-SD. Statistics and reproducibility a. This experiment was performed once. b. This experiment was performed twice with similar results. c. n = 3 technical replicates per group; P-values: FASN: sgNC: DMSO vs apilimod:2.3e-5; sgAMPKα: DMSO vs apilimod:3.0e-7; ACACA: sgNC: DMSO vs apilimod:5.7e-5; sgAMPKα: DMSO vs apilimod:9.9e-8. This experiment was performed twice with similar results. d. n = 3 technical replicates. P-values: PRKAA1: siNC vs sgAMPKα:1.4e-4; PRKAA2: siNC vs sgAMPKα:6.0e-6. This experiment was performed twice with similar results. e. This experiment was performed twice with similar results. f. This experiment was performed twice with similar results. g. This experiment was performed twice with similar results. h. This experiment was performed twice with similar results. i. This experiment was performed twice with similar results. j. n = 3 biological replicates per group. P-values: Fasn: sgNC: DMSO vs apilimod:2.4e-12; DMSO vs ESK981:4.9e-10; sgATG5: DMSO vs apilimod:4.8e-10; DMSO vs ESK981:5.1e-8; sgATG7: DMSO vs apilimod:1.5e-10; DMSO vs ESK981:2.8e-6; Acaca: sgNC: DMSO vs apilimod:2.0e-10; DMSO vs ESK981:1.2e-9; sgATG5: DMSO vs apilimod:4.5e-7; DMSO vs ESK981:2.3e-8; sgATG7: DMSO vs apilimod:2.0e-6; DMSO vs ESK981:7.4e-5. This experiment was performed thrice with similar results. k-l. n = 3 biological replicates per condition. o. n = 3 cell lines per group. p-q. n = 3 biological replicates per condition. These experiments were performed twice each with similar results. r-s. n = 2 independent experiments, represented by one data point for each condition. Source Data
Extended Data Fig. 9
Extended Data Fig. 9. Inhibition of PIKfyve activates SREBP-dependent transcriptional signatures through disrupting lysosomal lipid homeostasis pathways.
a. Immunoblots of 7940B, PANC1, MIA PaCa-2, and HPNE cells upon treatment with apilimod (100 nM for 7940B, 300 nM for PANC1, MIA PaCa-2, and HPNE), ESK981 (1000 nM), chloroquine (30 μM), or bafilomycin A1 (30 nM) for eight hours showing changes in SREBP1 (P), SREBP1 (M), and LC3A/B. Vinculin or histone H3 were used as loading controls. b. qPCR of 7940B, PANC1, MIA PaCa-2, or KPC1361 cells upon treatment with apilimod (100 nM for 7940B, 300 nM for PANC1, MIA PaCa-2, KPC 1361), ESK981 (1000 nM), chloroquine (CQ, 30 μM), or bafilomycin A1 (BF, 30 nM) for eight hours showing changes in FASN or ACACA mRNA levels as indicated. Bars are +/-SD. (Two-way ANOVA with Dunnett’s multiple comparison test, setting DMSO as the reference for each target for each cell line.). c. Immunoblots of PANC1 and MIA PaCa-2 cells treated with apilimod (300 nM), ESK981 (1000 nM), chloroquine (30 μM), bafilomycin (30 nM), or U18666A (5 μg/mL) for 8 hours showing changes in SREBP1 (P) and SREBP1 (M). Histone H3 or vinculin are used as loading controls. d. qPCR of MIA PaCa-2, PANC1, and 7940B cells assessing changes in RNA of FASN upon treatment with apilimod (100 nM for 7940B, 300 nM for PANC1, MIA PaCa-2) or U18666A (5 μg/mL) for 8 hours. Bars are +/-SD. (One-way ANOVA with Dunnett’s, with DMSO as the baseline.). e. Immunofluorescence images of PANC1 cells treated with DMSO, apilimod (1000 nM), ESK981 (1000 nM), or U18666A (5 μg/mL) for 24 hours stained with filipin or LAMP1. White squares indicate cropped area used for Fig. 3f. Scalebars= 5 μm. Statistics and reproducibility: a. This experiment was performed twice in MIA PaCa-2 cells with similar results and once in all other cells. b. n = 3 technical replicates per group. P-values: 7940B: Fasn: DMSO vs apilimod:1.6e-5; DMSO vs ESK981:1.2e-5; DMSO vs bafilomycin:3.0e-6; Acaca: DMSO vs apilimod:2.7e-5; DMSO vs ESK981:2.0e-5; KPC 1361: Fasn: DMSO vs apilimod:5.9e-7; DMSO vs ESK981:4.3e-5; DMSO vs BAF:7.8e-5; Acaca: DMSO vs apilimod:3.8e-6; DMSO vs ESK981:1.4e-5 PANC1: FASN: DMSO vs ESK981:5.8e-6; ACACA: DMSO vs ESK981:6.3e-6 MIA PaCa-2: FASN: DMSO vs apilimod:6.3e-8; DMSO vs chloroquine:9.1e-7; DMSO vs bafilomycin:5.9e-10; ACACA: DMSO vs bafilomycin:1.5e-5. c. These experiments were performed once each. d. n = 3 technical replicates per group. P-values: FASN: MIA PaCa-2: DMSO vs apilimod:1.5e-4; PANC1: DMSO vs apilimod:4.4e-5; Fasn: 7940B: DMSO vs apilimod:4.4e-6. e. These images are representative of n = 2 images each. Source Data
Extended Data Fig. 10
Extended Data Fig. 10. PIKfyve inhibition activates SREBP through causing lysosomal lipid sequestration.
a. Immunoblots of PANC1 and MIA PaCa-2 cells upon treatment with DMSO or apilimod (300 nM) for the indicated number of hours detecting changes of SREBP1 (P) and SREBP1 (M) protein levels. Vinculin was used as a loading control. b. qPCR showing changes in RNA levels of FASN (left) or LDLR (right) upon treatment with apilimod (300 nM for PANC1 and 100 nM for 7940B) or ESK981 (1000 nM) for the indicated number of hours. Bars are +/-SD. (Two-way ANOVA with Dunnett’s with the DMSO condition for each timepoint set as the baseline and normalized to 1.). c. Immunofluorescence images of 7940B cells upon treatment with DMSO, apilimod (100 nM), ESK981 (1000 nM), or U18666A (5 μg/mL) for 4 hours stained with filipin. Scalebars=20 μm. d. Immunofluorescence images of PANC1 cells upon treatment with DMSO or apilimod (300 nM) for 4 hours stained with filipin and LAMP1. Scalebars=5 μm. e. Immunoblot of PANC1, MIA PaCa-2, and 7940B cells upon treatment with DMSO, apilimod (300 nM for PANC1 and MIA PaCa-2; 100 nM for 7940B), or ESK981 (1000 nM) with or without cholesterol supplementation (10 μg/mL cholesterol and 1 μg/mL 25-hydroxycholesterol) for 8 hours detecting changes of SREBP1 (P) and SREBP1 (M) protein levels. Vinculin or histone H3 were used as a loading control. f. qPCR showing changes in RNA levels of FASN, LDLR, or HMGCR in PANC1, 7940B, or MIA PaCa-2 cells upon treatment with DMSO, apilimod (100 nM for 7940B, 300 nM for MIA PaCa-2 and PANC1), or ESK981 (1000 nM) with or without cholesterol supplementation (10 μg/mL cholesterol and 1 μg/mL 25-hydroxycholesterol) for 8 hours. Bars are +/-SD. (One way ANOVA with Šídák’s multiple comparisons test.). Statistics and reproducibility: a. These experiments were performed once each. b. n = 3 technical triplicates per group. P-values: PANC1: FASN: 8 hour: DMSO vs apilimod:4.7e-10; DMSO vs ESK981:9.4e-8; LDLR: 4 hour: DMSO vs apilimod:2.5e-8; 8 hour: DMSO vs apilimod:1.7e-11; DMSO vs ESK981:2.3-9; 7940B: Fasn: 8 hour: DMSO vs apilimod:2.2e-12; Ldlr: 2 hour: DMSO vs apilimod:1.3e-5; 4 hour: DMSO vs apilimod:7.0e-15; DMSO vs ESK981:1.1e-14; 8 hour: DMSO vs apilimod:<1.0e-15; DMSO vs ESK981:9.9e-12. c. These images are representative of n = 2 each. d. These images are representative of n = 3 each. e. These experiments were performed once each. f. n = 3 technical triplicates per group. P-values: PANC1 FASN: apilmod vs apilimod + sterols:4.5e-8; LDLR: apilimod vs apilimod+sterols:3.9e-12; ESK981 vs ESK91+sterols:7.7e-9; HMGCR: apilimod vs apilimod+sterols:1.4e-12; ESK981 vs ESK981+sterols:1.6e-10; MIA PaCa-2: FASN: ESK981 vs ESK981+sterols:1.3e-6; LDLR: apilimod vs apilmod+sterols:4.5e-6; ESK981 vs ESK981+sterols:2.5e-9; HMGCR: apilimod vs apilimod+sterols:2.4e-7; ESK981 vs ESK981+sterols:3.0e-6; 7940B: Fasn: apilimod vs apilimod+sterols:1.0e-5; ESK981 vs ESK981+sterols:2.3e-7; Ldlr: apilimod vs apilimod+sterols:1.1e-8; ESK981 vs ESK981+sterols:3.4e-9; Hmgcr: apilimod vs apilimod+sterols:4.0e-15; ESK981 vs ESK981 + sterols:5.1e-13. Source Data
Extended Data Fig. 11
Extended Data Fig. 11. KRAS-MAPK opposes PIKfyve in its regulation of lipogenesis and autophagy in PDAC cells.
a. qPCR of 7940B cells upon treatment with MRTX1133 (MRTX, KRASG12D inhibitor) or trametinib (tram, MEK inhibitor) and MIA PaCa-2 cells upon treatment with AMG510 (AMG, KRASG12C inhibitor) or trametinib for eight hours showing changes in MYC expression. Bars are +/-SD. (One-way ANOVA with Dunnett’s.). b. Immunoblot of 7940B cells upon treatment with MRTX1133 or trametinib and MIA PaCa-2 upon treatment with AMG510 or trametinib for eight hours showing changes in c-MYC levels. Vinculin was used as a loading control. c. ChIP-seq read feature distribution upon pulldown of IgG (DMSO) or c-MYC from MIA PaCa-2 cell lysates upon treatment with DMSO, AMG510 (100 nM), or trametinib (10 nM) for eight hours. d. Top five known motifs (ranked by p-value, HOMER, hypergeometric test) enriched upon pulldown of c-MYC from MIA PaCa-2 cells treated with DMSO. e. ChIP-seq track of FASN gene locus showing peaks called by MACS2 and MYC binding motif called by FIMO in MIA PaCa-2 cells upon treatment with DMSO, AMG510, or trametinib. f. qPCR of iKRAS (doxycycline-inducible KRASG12D) 9805 cells showing changes in RNA levels of labeled genes upon presence or absence of doxycycline (Dox) for 48 hours. Bars are +/-SD. (Unpaired two-tailed t-test.). g. Immunoblot analysis of iKRAS 9805 cells showing changes in protein levels of FASN and ACC1 upon presence or absence of doxycycline for 72 hours. Vinculin was used as a loading control. h. qPCR of 7940B and MIA PaCa-2 cells treated with KRASG12D inhibitor MRTX1133 (100 nM), KRASG12C inhibitor AMG510 (100 nM for MIA PaCa-2), or MEK inhibitor trametinib (10 nM for MIA PaCa-2, 30 nM for 7940B) for eight hours. Bars are +/-SD. (One-way ANOVA with Dunnett’s.). i. Counts per million (CPM) from RNA-seq analysis on AsPC1 cells treated with MRTX1133 (100 nM) for 24 hours. Data plotted are biological triplicates from publicly available RNA-seq data. (Unpaired two-tailed t-test.) Bars are +/-SD. j. CPM from RNA-seq analysis on AsPC1 cell-derived xenograft model. Mice were dosed with 30 mg/kg of MRTX1133 6 hours prior to tumor collection. Data plotted are taken from independent tumors from publicly available RNA-seq data. (Unpaired two-tailed t-test.) Bars are +/-SD. k. Principal component analysis of targeted lipidomics data showing shifts in 7940B global lipid profiles upon treatment with DMSO, apilimod (100 nM, 24 hours), trametinib (100 nM every 24 hours for 48 hours), MRTX1133 (1000 nM every 8 hours for 48 hours), apilimod and trametinib, or apilimod and MRTX. Of note, one sample in the DMSO group was removed as a statistical outlier. l. Relative abundance of ceramides (left) and hexosylceramides (right) in 7940B cells upon treatment with apilimod (100 nM for 24 hours), trametinib (100 nM every 24 hours for 48 hours), MRTX1133 (1000 nM every eight hours for 48 hours), apilimod + trametinib, or apilimod + MRTX. (Unpaired two-tailed t-tests.). m. Tandem fluorescent reporter assay in 7940B (left) or Panc 04.03 (right) cells showing changes in autophagic flux upon 24-hour treatment with labeled doses of MRTX1133. Data shown are four biological replicates from one of three independent experiments. Box represents 25th and 75th percentiles; whiskers represent the range. (One-way ANOVA with Dunnett’s.). n. Tandem fluorescent reporter assay on 7940B cells showing changed autophagic flux upon 4-hour pretreatment with apilimod (100 nM), ESK981 (1000 nM), or chloroquine (50 μM) and subsequent treatment with MRTX1133 (300 nM, left) or trametinib (25 nM, right) for 24 hours. (One-way ANOVA with Dunnett’s.). o. Tandem fluorescent reporter assay on iKRAS 9805 cells showing changed autophagic flux upon doxycycline withdrawal for 24 hours and subsequent treatment with apilimod (100 nM), ESK981 (1000 nM), or chloroquine (10 μM) for 24 hours. Box represents 25th and 75th percentiles; whiskers represent the range. (One way ANOVA with Dunnett’s.). p. Tandem fluorescent reporter assay in Panc 04.03 cells showing changes in autophagic flux upon four-hour pretreatment with apilimod (300 nM), ESK981 (1000 nM), or chloroquine (CQ, 30 mM) followed by 24-hour treatment with MRTX1133 (300 nM, left) or trametinib (25 nM). Data shown are four biological replicates from one of three independent experiments. Box represents 25th and 75th percentiles; whiskers represent the range. (One-way ANOVA with Dunnett’s.). Statistics and reproducibility: a. n = 3 technical triplicates per group. P-values: 7940B: Myc: DMSO vs MRTX1133:9.0e-5; DMSO vs trametinib:1.3e-5; MIA PaCa-2: MYC: DMSO vs AMG510:1.4e-5; DMSO vs trametinib: 1.3e-5. This experiment was performed thrice each with similar results. b. This experiment was performed twice with similar results. f. n = 3 technical triplicates. This experiment was performed thrice with similar results. g. This experiment was performed once. h. n = 3 technical replicates. These experiments were performed thrice each with similar results. P-values: 7940B: Fasn: DMSO vs MRTX1133:5.9e-5. k. n = 4 for apilimod, trametinib, apilimod+trametinib, MRTX1133, and apilimod+MRTX1133 groups; n = 3 for DMSO. l. n = 4 for apilimod, trametinib, apilimod+trametinib, MRTX1133, and apilimod+MRTX1133 groups; n = 3 for DMSO. P-values: Ceramides: apilimod vs apilimod+MRTX1133:1.1e-109; Hexosylceramides: apilimod vs apilimod + MRTX1133:1.3e-46. m. n = 4 biological relicates each. P-values: 7940B: DMSO vs MRTX1133 100 nM:5.6e-6; DMSO vs MRTX1133 1000 nM:1.5e-6; Panc04.03: DMSO vs MRTX1133 10 nM:4.7e-6; DMSO vs MRTX1133 100 nM:6.5e-7; DMSO vs MRTX1133 1000 nM:1.2e-5. n. n = 4 independent biological samples for each group. P-values: DMSO vs MRTX1133:9.4e-8; MRTX1133 vs MRTX1133+apilimod:2.0e-5; MRTX1133 vs MRTX1133 + ESK981:1.5e-5; MRTX1133 vs MRTX1133+chloroquine:5.8e-5; DMSO vs trametinib:8.4e-10; trametinib vs trametinib+apilimod:3.1e-10; trametinib vs trametinib+ESK981:1.4e-10; trametinib vs trametinib+chloroquine:1.7e-10. This data is representative of three independent experiments each. o. n = 4 independent biological samples for each group. P-values: DMSO-Dox vs DMSO+Dox:2.4e-11; DMSO-Dox vs apilimod:1.5e-6; DMSO-Dox vs ESK981: 2.8e-6; DMSO-Dox vs chloroquine: 1.5e-6. This data is representative of three independent experiments each. p. P-values: Panc 04.03: MRTX1133 vs DMSO:2.0e-8; MRTX1133 vs MRTX1133+apilimod:2.0e-7; MRTX1133 vs MRTX1133 + ESK981:5.3e-7; MRTX1133 vs MRTX1133+chloroquine:4.7e-6 trametinib vs DMSO:9.3e-9; trametinib vs trametinib+apilimod: 5.2e-8 trametinib vs trametinib+ESK981:7.5e-8; trametinib vs trametinib+chloroquine:2.0e-6. Source Data
Extended Data Fig. 12
Extended Data Fig. 12. Dual inhibition of PIKfyve and KRAS-MAPK results in synergistic efficacy in PDAC cell and tumor models.
a. 3D synergy plots (top) and corresponding effect value heatmaps (bottom) in 7940B cells treated with apilimod and trametinib (left), ESK981 and trametinib (middle left), apilimod and MRTX1133 (middle right), and ESK981 and MRTX1133 (right). Red peaks in the 3D plots indicate synergism, and the overall average synergy score is listed above. b. Confluence assays of 7940B cells treated with DMSO, trametinib (20 nM), apilimod (50 nM), or both trametinib and apilimod. Bars are +/-SEM. (Two-way ANOVA with Dunnett’s with the combination as the baseline.). c. Schematic outlining syngeneic orthotopic model of 7940B for C57BL/6 mice assessing in vivo efficacy of ESK981 (ESK, 30 mg/kg, QD, PO), trametinib (tram, 1 mg/kg QD, PO), or ESK981 and trametinib (ESK + tram). d. Relative body weight (compared to day 1) of mice harboring 7940B orthotopic tumors undergoing indicated treatment. Bars are +/-SEM. e. Raw pancreas + tumor weights collected at endpoint of 7940B syngeneic orthotopic model. Box represents 25th and 75th percentiles; whiskers represent the range. (One-way ANOVA with Tukey’s.). f. Representative images of H&E of one tumor from each treatment arm from 7940B syngeneic orthotopic model. Scalebar = 200 μm for the zoomed-out H&E images; 50 μm for the zoomed-in images. g. Quantification of CK19 positive area compared to hematoxylin counterstain on a section from each tumor of the 7940B syngeneic orthotopic model. Box represents 25th and 75th percentiles; whiskers represent the range. (One-way ANOVA with Tukey’s.). h. Barplot of tumor presence or absence based on gross and histological evidence. i. Schematic outlining efficacy study using subcutaneous model of UM19 pCDX treated with vehicle, trametinib (tram, 1 mg/kg, QD, PO), ESK981 (ESK 30 mg/kg, QD, PO), or ESK981 + trametinib (ESK + tram). j. Waterfall plot displaying change in tumor volume at treatment end point compared to baseline of the UM19 CDX model treated with trametinib +/-ESK981. The endpoint displayed of the vehicle and trametinib arms are day 19. The endpoint displayed of the ESK981 and ESK981 +/-trametinib group are day 57. The mice in the vehicle- and ESK981- treated groups were the same mice shown in (l-m). k. Schematic outlining efficacy study using subcutaneous model of UM-19 primary cell-derived xenograft (CDX) treated with vehicle, MRTX1133 (MRTX, 30 mg/kg, QD, IP), ESK981 (ESK 30 mg/kg, QD, PO), or ESK981 + MRTX1133 (ESK + MRTX). l. Tumor volumes as a percentage of the initial volume measured by calipers over treatment course of the UM19 primary CDX (pCDX) model treated with MRTX1133 + /-ESK981. The mice in the vehicle and ESK981 groups are shared with the mice displayed in (Fig. 4g,h, Extended Data Fig. 12j), as they were all treated in the same experiment. Bars are +SEM. m. Waterfall plot displaying change in tumor volume at treatment end point (day 19) compared to day 1. The mice in the vehicle and ESK981 groups are shared with the mice displayed in Fig. 4g,h, and Extended Data Fig. 12j, as they were all treated in the same experiment. n. Schematic outlining efficacy study using KPC autochthonous model assessing the combinatorial effects of ESK981 and selumetinib (MEK inhibitor). U.S. = ultrasound. o. Schematic outlining efficacy study using KPC autochthonous model assessing the combinatorial effects of ESK981 and MRTX1133. p. Waterfall plot of maximal tumor response to each therapy compared to their starting volume. The mice in the vehicle- and ESK981- treated groups are the same mice shown in Extended Data Fig. 12q–s, as they were treated in the same experiment. q. Kaplan-Meier curves of survival of KPC mice undergoing indicated therapies. (two-sided log-rank test; each comparison calculated independently). The mice in the vehicle- and ESK981- treated groups are the same mice shown in Fig. 4i,j, Extended Data Fig. 12p, as they were treated in the same experiment. r. Waterfall plot of maximal tumor response to each therapy compared to their starting volume. The mice in the vehicle- and ESK981- treated groups are the same mice shown in Fig. 4i,j, Extended Data Fig. 12p, as they were treated in the same experiment. s. Tumor volumes of KPC mice treated as indicated as measured by 3D ultrasound on the indicated treatment day. The mice in the vehicle- and ESK981- treated groups are the same mice shown in Fig. 4i,j, Extended Data Fig. 12p, as they were treated in the same experiment. Mouse cartoons used in Extended Data Fig. 12c,i,k,n,o were adapted from Adobe Stock Image (Asset #304271210). Statistics and reproducibility: a. Each drug dose combination effect value was a result of n = 5 biological replicates. This experiment was performed thrice with apilimod + trametinib with similar results and once with the other three combinations each. b. n = 4 biological replicates. P-values: apilimod+trametinib vs DMSO:1.0e-15; apilimod+trametinib vs trametinib:1.0e-15; apilimod+trametinib vs apilimod:1.0e-15. d. n = 9 individual animals for vehicle, ESK981, and trametinib groups and n = 8 individual animals for ESK981 + trametinib group. e. n = 9 individual animals for vehicle, ESK981, and trametinib groups and n = 8 individual animals for ESK981 + trametinib group. P-values: vehicle vs ESK981+trametinib:3.8e-5. f. These images are representative of n = 9 for vehicle, ESK981, and trametinib groups and n = 8 for ESK981 + trametinib group. g. n = 9 individual animals for vehicle, ESK981, and trametinib groups and n = 8 individual animals for ESK981 + trametinib group. P-value: vehicle vs ESK981 + trametinib:6.8e-5. l. n = 16 tumors from 8 animals for vehicle group; n = 14 tumors from 7 animals for MRTX and ESK groups; n = 12 tumors from 6 mice for the ESK + MRTX group. q,s. n = 5 individual animals for vehicle; n = 7 individual animals for MRTX1133; n = 6 individual animals for ESK981; and n = 6 individual animals for ESK981 + MRTX1133 groups. Source Data

Update of

Similar articles

Cited by

  • Divergent FOXA1 mutations drive prostate tumorigenesis and therapy-resistant cellular plasticity.
    Eyunni S, Mannan R, Zhang Y, Young E, Zhang Q, Luo J, Pang M, Mahapatra S, Tien JC, George JM, Jaber M, Hakkani H, Carson SE, Todd AJ, Hosseini N, Gondal M, Rebernick RJ, Cao X, Su F, Wang R, Mehra R, Li J, Cieslik M, Chinnaiyan AM, Parolia A. Eyunni S, et al. Science. 2025 Jun 26:eadv2367. doi: 10.1126/science.adv2367. Online ahead of print. Science. 2025. PMID: 40570057 Free PMC article.
  • A marker for sterol-dependent metastatic tropism.
    Wang Y, Wang X, David CJ, Zou Y. Wang Y, et al. Nat Struct Mol Biol. 2025 Aug;32(8):1331-1333. doi: 10.1038/s41594-025-01626-1. Nat Struct Mol Biol. 2025. PMID: 40646312 No abstract available.
  • Leveraging autophagy and pyrimidine metabolism to target pancreatic cancer.
    Dufresne S, Kuna RS, Wong K, Komarla A, Rock A, Rosada-Encarnación J, Shen C, Mondal P, Parham LR, Izidro Layng F, Peck KL, Fowler A, Lowy AM, Engle D, Tiriac H, Shaw R, Cosford N, Metallo C, Towers C. Dufresne S, et al. bioRxiv [Preprint]. 2025 Jun 5:2025.05.29.656904. doi: 10.1101/2025.05.29.656904. bioRxiv. 2025. PMID: 40501952 Free PMC article. Preprint.

References

    1. Biancur, D. E. et al. Functional genomics identifies metabolic vulnerabilities in pancreatic cancer. Cell Metab.33, 199–210 (2021). - PMC - PubMed
    1. Halbrook, C. J., Lyssiotis, C. A., Pasca di Magliano, M. & Maitra, A. Pancreatic cancer: advances and challenges. Cell186, 1729–1754 (2023). - PMC - PubMed
    1. Yang, S. et al. Pancreatic cancers require autophagy for tumor growth. Genes Dev.25, 717–729 (2011). - PMC - PubMed
    1. Davidson, S. M. et al. Direct evidence for cancer-cell-autonomous extracellular protein catabolism in pancreatic tumors. Nat. Med.23, 235–241 (2017). - PMC - PubMed
    1. Commisso, C. et al. Macropinocytosis of protein is an amino acid supply route in Ras-transformed cells. Nature497, 633–637 (2013). - PMC - PubMed

MeSH terms

Substances