. 2025 Jun;642(8069):1016-1023.
doi: 10.1038/s41586-025-08875-6. Epub 2025 Apr 23.

A distributed coding logic for thermosensation and inflammatory pain

Affiliations

A distributed coding logic for thermosensation and inflammatory pain

Nima Ghitani et al. Nature. 2025 Jun.

Abstract

Somatosensory neurons encode detailed information about touch and temperature and are the peripheral drivers of pain1,2. Here by combining functional imaging with multiplexed in situ hybridization3, we determined how heat and mechanical stimuli are encoded across neuronal classes and how inflammation transforms this representation to induce heat hypersensitivity, mechanical allodynia and continuing pain. Our data revealed that trigeminal neurons innervating the cheek exhibited complete segregation of responses to gentle touch and heat. By contrast, heat and noxious mechanical stimuli broadly activated nociceptor classes, including cell types proposed to trigger select percepts and behaviours4-6. Injection of the inflammatory mediator prostaglandin E2 caused long-lasting activity and thermal sensitization in select classes of nociceptors, providing a cellular basis for continuing inflammatory pain and heat hypersensitivity. We showed that the capsaicin receptor TRPV1 (ref. 7) has a central role in heat sensitization but not in spontaneous nociceptor activity. Unexpectedly, the responses to mechanical stimuli were minimally affected by inflammation, suggesting that tactile allodynia results from the continuing firing of nociceptors coincident with touch. Indeed, we have demonstrated that nociceptor activity is both necessary and sufficient for inflammatory tactile allodynia. Together, these findings refine models of sensory coding and discrimination at the cellular and molecular levels, demonstrate that touch and temperature are broadly but differentially encoded across transcriptomically distinct populations of sensory cells and provide insight into how cellular-level responses are reshaped by inflammation to trigger diverse aspects of pain.


Conflict of interest statement

Competing interests: The authors declare no competing interests.

Figures

Fig. 1
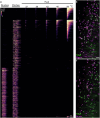
Fig. 1. Detection of heat and differential tuning of somatosensory neuron classes.
a, Heat maps showing in vivo GCaMP responses from 1,588 transcriptomically classified neurons from 15 mice tested with mechanical stimulation and heat. Heat maps are grouped by neuronal class with changes in GCaMP fluorescence (% ΔF/F) colour-coded as indicated by the scale bar. b, Proportions of heat (red), polymodal (orange) and mechanically tuned neurons (grey) for each class; the number of neurons and mice used for assignment are indicated. c, Mean responses of heat-responsive nociceptors by class (solid trace; numbers of heat-responsive cells indicated); the shaded area represents 95% confidence interval. d, Fractional recruitment of cheek-responsive neurons by class and temperature. e, Fractional representation of heat responses by class across the temperature range. Colour coding is as in d with LTMRs in grey; numbers of mice and cells are detailed in Supplementary Table 1. Scale bars, 10 s.
Fig. 2
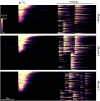
Fig. 2. In vivo functional imaging of Cre lines confirmed that NP1 and NP2B neurons detect noxious mechanical and thermal stimuli.
a, Heat maps showing calcium transients from Ai95 carrying knock-in alleles to label NP1 (upper panel; 561 neurons; four mice) and NP2B (lower panel; 72 neurons; three mice) neurons. Changes in GCaMP fluorescence in response to stimuli applied to the cheek are colour-coded by % ΔF/F (inset scale). b,c, Percentage of neurons (mean ± s.e.m.) responding to each stimulus for cells identified by ISH after functional imaging (pale grey) or Cre-mediated labelling (dark grey). b, NP1 cells: ISH, n = 13; CreER, n = 4. c, NP2B cells: ISH, n = 12; tdT, n = 3. See Supplementary Table 2 for details and statistics. Scale bar, 10 s.
Fig. 3
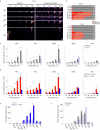
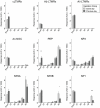
Fig. 3. PGE2-mediated inflammation differentially affects select classes of nociceptors.
a, Heat maps showing the effect of PGE2-induced inflammation on the thermal sensitivity of 582 C-nociceptors (eight mice) that responded to heat and/or pinch of the cheek (cheek-innervating neurons) grouped by class; for display purposes, baseline (left) and continuing inflammation (right) were independently sorted on the basis of the amplitude of heat response. b, Example of GCaMP traces for individual neurons at baseline (left) and after PGE2 injection (right) for classes with spontaneous activity during inflammation; red points and bars in the lowest example trace identify transients and their amplitudes (see Methods for details). c, Quantification of unstimulated activity (mean sum of transient amplitudes ± s.e.m.) in neuronal classes in wild-type mice before (grey) and after (red) PGE2-induced inflammation. d,e, Heat response for all cheek-innervating neurons of a given class over the full temperature range (mean area under the curve (AUC) ± s.e.m.). Wild-type mice (d) and Trpv1−/− mice (e) before and after PGE2 injection of the cheek. Additional information about heat sensisitization is shown in Extended Data Figs. 5 and 6. f, Unstimulated activity (mean sum of transient amplitudes ± s.e.m.) in neuronal class activity during inflammation in wild-type mice (red) and Trpv1−/− mice (blue). Note that the red bars in c and f show the same dataset for comparative purposes; *P < 0.05; **P < 0.01; ***P < 0.001; for details of statistical tests and number of mice and cells, see Supplementary Tables 1 and 2. KO, knockout. Scale bars, 10 s.
Fig. 4
Fig. 4. Stable representation of gentle touch at the periphery during inflammation.
a, Heat maps showing the effect of PGE2-induced inflammation on the brush sensitivity of 339 LTMRs (eight mice) that responded to pinch and/or brush of the cheek grouped by class. b, Percentage of neurons responding to at least 50% of individual brushes before (grey) and after (red) PGE2; mean ± s.e.m.; n = 8. c, Brush response magnitude (mean AUC ± s.e.m.) for all cheek-innervating neurons of a given class before (grey) and after (red) PGE2 injection; background and PGE2-induced activity (mean AUC ± s.e.m.) during an equivalent period without stimulation (pale grey and pink) showed no increase in LTMR responses after PGE2 injection and that nociceptor firing during inflammation is largely brush-independent (Extended Data Fig. 7). Supplementary Tables 1 and 2 include full details of statistical tests and numbers. Scale bar, 10 s.
Fig. 5
Fig. 5. Continuing nociceptor activity drives tactile allodynia.
a, Time course of von Frey 50% withdrawal threshold (mean ± s.e.m.) before (time = 0) and after injection of PGE2 into the hind paw of mice with silenced Trpv1-lineage nociceptors (red; n = 6) and littermate controls (black; n = 7). PGE2 injection induced mechanical sensitization in controls but not in mice with silenced nociceptors (P < 0.05) over 60 min. b, Violin-plot analysis of expression level (log-normalized single-cell RNA sequencing data), showing selective expression of Htr1f in NP3 nociceptors. c, Percentage and level of activation (ΔAUC) of neurons after injection of the selective HTR1F agonist LY344864 into the cheek. d, Heat maps of DRG imaging for mice expressing GCaMP under the control of Sst-Cre. Responses from 200 neurons of six mice showed that Sst-Cre labelled a population of brush cells and a separate population of LY344864-responsive neurons. Below, quantification of LY344864-stimulated activity (mean sum of transient amplitudes ± s.e.m.) for brush and non-brush cells. e, von Frey 50% withdrawal threshold (mean ± s.e.m.) before (time = 0) and after injection of LY344864 into the hind paw of wild-type mice (magenta; n = 7) and littermates with silenced Trpv1-lineage nociceptors (grey; n = 6). LY344864 injection induced mechanical sensitization in wild-type mice for at least 60 min but was ineffective in mice with silenced nociceptors. f, von Frey 60% withdrawal thresholds (mean ± s.e.m.; n = 7) at baseline (grey) and after paw injection of LY344864 in mice expressing KORD in Trpv1-lineage nociceptors. Mice received intraperitoneal dimethylsulfoxide (vehicle; magenta) or the selective KORD ligand Salvinorin B (SalB; blue) immediately before paw injection of LY344864. See Supplementary Tables 1 and 2 for full details of statistical tests and numbers; *P < 0.05; **P < 0.01. Scale bar, 10 s.
Extended Data Fig. 1
Extended Data Fig. 1. Response properties of trigeminal neurons during mechanical and thermal stimulation of the mouse cheek.
a) Heatmap showing the in vivo GCaMP responses from 2085 neurons responding to mechanical and thermal stimulation of the cheek in 15 mice; changes in GCaMP fluorescence (% ΔF/F) are color-coded as indicated in the scale bar. (b, c) Spatial activity map showing the full functional imaging field from an example mouse; cellular response magnitude is indicated by brightness and response to heat (50 °C, green) and (b) pinch or (c) brush responses (magenta). Note significant overlap of heat and noxious mechanical (b) but not gentle touch (c); scale bar: 50 µm.
Extended Data Fig. 2
Extended Data Fig. 2. Basis for ISH-based mapping of functional responses to transcriptomic class.
a) Violin-plot analysis of expression level (log normalized single cell RNA sequencing data), showing expression patterns of several marker genes used in this study across 10 major transcriptomic classes in the order shown in (b). At the single cell level, some of these classes can be further divided into subclasses, but neither the use of Cre-lines nor our approach recapitulate this resolution due to lack of markers with appropriate specificity and expression level. (b) Simplified representation of expression of a subset of these markers (red, positive; pink, weak expression; check, not diagnostic; white, negative) defines trigeminal neural classes. (c) Example images of a region of trigeminal ganglion subjected to functional imaging that was aligned to post-hoc multigene ISH. Upper left panel shows ISH for GCaMP with positive cells outlined in green. These cell outlines have been transferred to the ISH images for eight genes used in classification to demonstrate the diagnostic power of our approach. The positive and negative expression of these markers allowed unambiguous class assignment for all GCaMP expressing cells (lower right panel). Note, the viral approach for GCaMP expression (see Methods) results in stochastic GCaMP expression in a subset of sensory neurons (approx. 40% in the image shown) accounting for ISH-positive cells that are not GCaMP positive and therefore not outlined in green. (d) Upper panels show ISH for GCaMP (green) superimposed on the aligned in vivo functional imaging data for pinch, brush and heat (maximum projection images, magenta). Previously, we quantified the fidelity of alignment and showed that although there was not a pixel-to-pixel match between the different imaging modes, <5% of cells were displaced by more than 30 % of their diameter. Lower panels show the responding cells color-coded for transcriptomic class. As expected, each stimulus only activates a small subset of the GCaMP-positive trigeminal neurons since we only target stimulation to a small region of the cheek. In this example, the cLTMRs (green) responded to brush and pinch but not heat. Over the complete dataset for this study, in experiments where probes for all classes were assayed, more than 96% of functionally responding cells could be classified unambiguously and less than 2% had an ambiguous pattern that could not be resolved using the classification logic. (e) The red outlined GCaMP expressing neurons (dotted white outlines in the other ISH images) were classified and their GCaMP-transients are shown to the right. For the Ca-traces, ΔF/F and time are indicated by scale bars and arrows above the heat traces indicate the start and duration of heating pulses.
Extended Data Fig. 3
Extended Data Fig. 3. NP2B neurons, specificity of Mrgprb4-tdT-Cre recombination and DRG responses.
(a) Whole mount ISH images comparing methods used to distinguish NP2A and NP2B cells. NP2 cells (orange outlines) can be assigned by expression of Tmem233 and Fxyd2 but not Mrgprd or Nppb/Sst. NP2B cells (green outlines) also express Mlc1 and a lower level of Calca than NP2A cells (magenta outlines); scale bar = 50 µm. In animals where both methods were applied, there was >90 % agreement. (b) Example triple label ISH of a section from an Ai95 mouse carrying an Mrdprb4-tdT-Cre allele showing GCaMP (blue), Mlc1 (green) and tdT (red). Note perfect overlap of Mlc1 and tdT showing that tdT marks NP2B cells; GCaMP is much more broadly expressed. (c) Example image showing alignment of in vivo tdT fluorescence (red) and a spatial map of stimulus evoked activity (green, all stimuli combined) showing that most responding neurons in these mice are not NP2B cells; scale bars (b, b) = 50 µm for merged views. (d) Heatmap showing Ca-transients from lumbar DRG neurons from Ai95 mice (n = 5) carrying the Mrdprb4-tdT-Cre allele divided into 747 GCaMP-only cells and 109 NP2B neurons expressing tdT; changes in GCaMP fluorescence (% ΔF/F) are color-coded as indicated in the scale bar.
Extended Data Fig. 4
Extended Data Fig. 4. Tuning of NP1 neurons reflects stimulus application rather than heterogeneity in this class of sensory neurons.
Heatmaps showing Ca-transients from trigeminal neurons of three Ai95 mice carrying the Mrgprd-CreER knockin allele after tamoxifen induction; changes in GCaMP fluorescence in response to stimuli applied to the cheek are color-coded by % ΔF/F. Responding neurons were sorted based on their response to heating. Note that for each mouse, there were individual pinches that primarily activated neurons that were not temperature responsive (an example boxed, green) and other pinches that generally activated temperature responsive neurons (an example boxed, red). This strongly suggests that all NP1 neurons innervating the cheek are polymodal and that differences in position of stimulus activation or size of thermal versus mechanical receptive field account for apparent variation in tuning selectivity.
Extended Data Fig. 5
Extended Data Fig. 5. Inflammatory heat sensitization and sensory stimulus ongoing activity of nociceptors in wild type mice.
a) Response magnitude (mean AUC ± s.e.m) at the holding temperature of 30 °C (No stimulus) and at 45 °C before (light or dark grey) and after PGE2 injection (pink or red) expose the relative contributions of ongoing activity and thermal sensitization that occur in this model of inflammatory pain. There was a significant increase in the magnitude of the temperature response (response at 45 °C minus response without stimulation) in PEP and NP2A nociceptors after PGE2 induced inflammation. (b) Heat response magnitude (mean AUC ± s.e.m) for wild type mice before (grey) and after (red) PGE2 injection to the cheek. p < 0.05, *; p < 0.01, **; p < 0.001, ***; for details of statistical tests and numbers of mice and cells see Supplementary Information, Tables 1 and 2.
Extended Data Fig. 6
Extended Data Fig. 6. Inflammatory heat sensitization and sensory stimulus ongoing activity of nociceptors in Trpv1-/- mice.
a) Heatmaps showing the effect of PGE2-induced inflammation on the thermal sensitivity of 371 C-nociceptors in 6 Trpv1-/- mice that responded to heat and/or pinch of the cheek grouped by class; for display purposes baseline (left) and ongoing inflammation (right) were independently sorted based on magnitude of heat response. (b) Proportions of heat (red), polymodal (orange) and mechanically tuned neurons (grey) for each class in wild type mice (upper panel) or Trpv1-/- mice (lower panel); the number of neurons and mice used for assignment are indicated. Note that the relative number of PEP and NP3 neurons as well as the proportion responding to temperature is reduced in the knockout animals. (c, d) Heat response magnitudes (mean AUC ± s.e.m) displayed to compare wild type and Trpv1-/- mice (c) before and (d) after PGE2 injection to the cheek; note that the wild type data are a repeat of the data displayed in (Extended Data Fig. 6b). (e) Quantitation of unstimulated activity in Trpv1-/- mice (mean sum of transient amplitudes ± s.e.m.) before (pale blue) and after PGE2 induced inflammation (dark blue). (f) Change in unstimulated activity induced by PGE injection of the cheek (mean sum of transient amplitudes ± s.e.m.) for wild type (grey) and Trpv1-/- (blue) mice; p < 0.05, *; p < 0.01, **; p < 0.001, ***; for details of statistical tests and numbers of mice and cells see Supplementary Information, Tables 1 and 2.
Extended Data Fig. 7
Extended Data Fig. 7. Nociceptor responses to brushing are not increased during PGE2 induced inflammation.
Heatmaps showing the effect of PGE2-induced inflammation on the brush sensitivity and stimulus independent activity (right column) of 580 nociceptors (from 8 mice) that responded to mechanical stimulation of the cheek grouped by class. Note that spontaneous activity in Aδ-NOC, PEP, NP3, NP2A and NP2B neurons accounts for apparent activity during brushing i.e., brush responses were not increased during inflammation. Weak brush activity in NP1 neurons was not changed after PGE2 injection (see Fig. 4c).
Extended Data Fig. 8
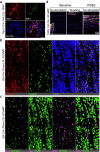
Extended Data Fig. 8. Silencing nociceptors and targeting NP3 cells as controls for strategies used to functionally determine nociceptor contribution to allodynia.
(a) Triple label ISH validating our approach for silencing a large subset of nociceptors (Trpv1 expressing PEP, NP3 and NP2A neurons). In DRGs, >96% of Trpv1 expressing neurons were TeNT positive (624/643 cells in sections from 3 mice) and >97% of TeNT positive cells were nociceptors i.e., co-expressed Trpv1 and/or Scn10a. (b) Sst-Cre was used to target NP3 cells; Cre-recombination (green) occurred in 63% of NP3 neurons expressing Sst/Nppb (red, 246/389) with variable (50-80%) recombination across 3 animals. Moreover, NP3 cells accounted for only 29% of the recombined neurons (246/847). Recombination also labeled S100b-positive neurons (blue), which do not express Sst, these cells were large-diameter and accounted for the other 71% of recombined cells. (c) Functional responses (magenta) were aligned to gene expression (green) showing that small diameter Sst/Nppb-NP3 cells never respond to brush but are heat sensitive consistent with data in Fig. 1. Brush but not heat activates the large diameter S100b-expressing neurons; scale bars, (a, c) 50 µm. (d) Heatmaps of DRG imaging for mice expressing GCaMP under the control of Sst-Cre. Responses from 174 neurons from 7 mice show that Sst-Cre labeled neurons are spontaneously active after injection of PGE2 into the paw, but brush cells were not activated by inflammation.
Extended Data Fig. 9
Extended Data Fig. 9. Dynamic tactile allodynia induced by PGE2 or LY344864 and unstimulated behavioral responses to inflammation.
a) The right hind paws of C57B/6 mice were brushed 20 times before and after injection of PBS (vehicle, n = 12), PGE2 (n = 7) or LY344864 (n = 5). Percentage response of each mouse (black lines) and the mean response of the group before (circles) and after injection (squares) are shown. (b) Time course showing that hind paw injection of LY344864 but not PBS induces pain-like behaviors to gentle brush (repetitive or extended lifting and guarding) resembling the time course for von Frey sensitization (Fig. 5e). (c-f) Changes in behavior were observed following (c,d) hind paw and (e, f) facial injection of PGE2 in wild type mice. (c) Ethograms showing time spent licking the injected hind paw for wild type mice (grey bars, n = 8) and littermates expressing TeNT in nociceptors (red bars, n = 8) for 15 min after injection of PGE2. Note that licking of the injected hind paw develops slowly minutes after PGE injection corresponding to induction of inflammation and is rarely seen in TeNT mice where nociceptor signaling is blocked. (d) Quantification of time spent licking the affected paw (mean ± s.e.m.) for the 10-minute period at the start of inflammation highlighted in yellow in panel (c). (e) Ethograms showing scored face directed behaviors, grooming of the face with both front paws (yellow), wiping with the right (green) or left (red) front paw and hind paw scratching of the right (purple) or left cheek (grey) for 15 min after facial injection of PBS (n = 5) or PGE2 (n = 6). Also shown are periods of inactivity greater than 1 s (black). Note that mice injected with PGE2 became inactive, often standing in a hunched posture within 5 min of PGE2 injection (Supplementary Information, Videos 2, 3), mirroring the induction of inflammation and nociceptor activity (Fig. 3a). Notably, PGE2 induced inflammation did not elicit the wiping or scratching observed after injection of strong agonists of select nociceptor classes but instead significantly reduced face directed behaviors. Anecdotally, PGE2 injected animals were sometimes observed to raise their paw towards the injected cheek but refrain from touching the skin (Supplementary Information, Video 4). (f) Quantitation of time spent in face directed behavior (left) and inactivity (right) after PBS (grey) or PGE2 (red) for the 10-minute period highlighted in yellow in panel (e). p < 0.05, *; p < 0.01, **; for details of statistical tests and numbers of mice see Supplementary Information, Tables 1 and 2.
Extended Data Fig. 10
Extended Data Fig. 10. Similar response profiles in mice with different depilation timing.
We used three different populations of mice during this study because we needed the fur intact to assess brushing and depilated skin for temperature series. Data in Figs. 1 and 2 were obtained from mice where the fur was removed acutely (during the functional imaging after mechanical stimulation had been performed). Data in other figures either used no fur removal (brush studies) or depilation was the previous day (approx. 24 h before recording) to minimize potential irritation from the chemical fur removal needed for temperature series. Note studies of inflammation were all carried out without acute fur removal. Response magnitudes (AUC mean ± s.e.m.) for same day (pale grey) and previous day (dark grey) depilation regimes for the different cell classes indicate only minimal differences in sensitivity; p < 0.05, *; p < 0.01, **; p < 0.001, ***. For details of statistical tests and numbers of mice and cells see Supplementary Information, Tables 1 and 2.

References

    1. Abraira, V. E. & Ginty, D. D. The sensory neurons of touch. Neuron79, 618–639 (2013). - PMC - PubMed
    1. Basbaum, A. I., Bautista, D. M., Scherrer, G. & Julius, D. Cellular and molecular mechanisms of pain. Cell139, 267–284 (2009). - PMC - PubMed
    1. von Buchholtz, L. J. et al. Decoding cellular mechanisms for mechanosensory discrimination. Neuron109, 285–298.e285 (2021). - PMC - PubMed
    1. Vrontou, S., Wong, A. M., Rau, K. K., Koerber, H. R. & Anderson, D. J. Genetic identification of C fibres that detect massage-like stroking of hairy skin in vivo. Nature493, 669–673 (2013). - PMC - PubMed
    1. Elias, L. J. et al. Touch neurons underlying dopaminergic pleasurable touch and sexual receptivity. Cell186, 577–590.e516 (2023). - PMC - PubMed

MeSH terms

LinkOut - more resources