. 2025 May;641(8064):942-951.
doi: 10.1038/s41586-025-08902-6. Epub 2025 Apr 23.

Cold memories control whole-body thermoregulatory responses

Affiliations

Cold memories control whole-body thermoregulatory responses

Andrea Muñoz Zamora et al. Nature. 2025 May.

Abstract

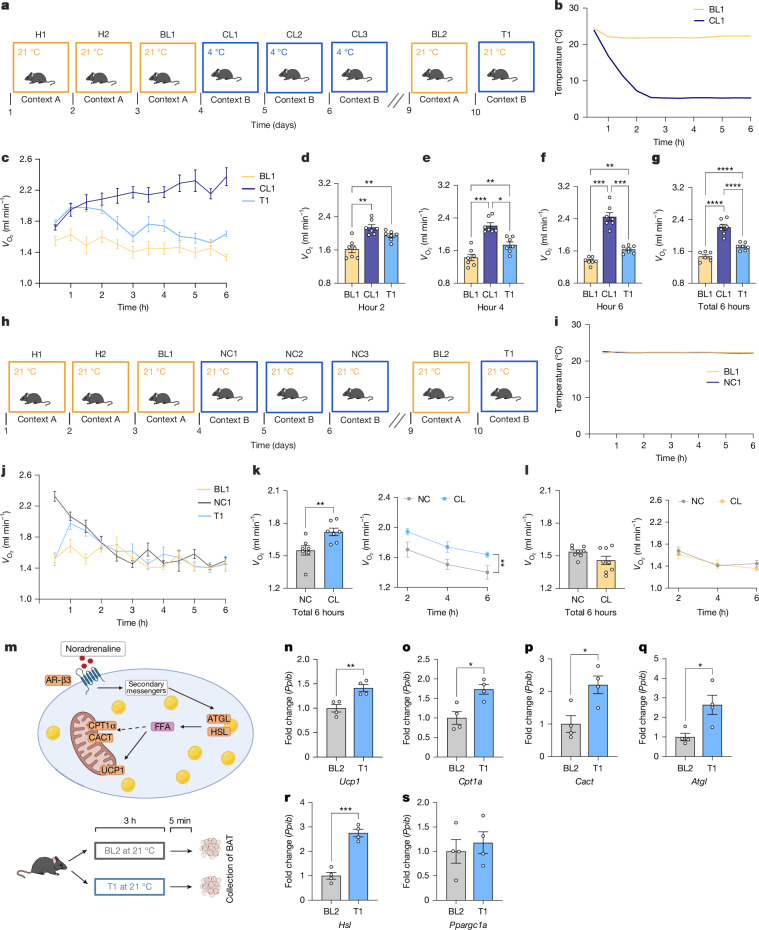
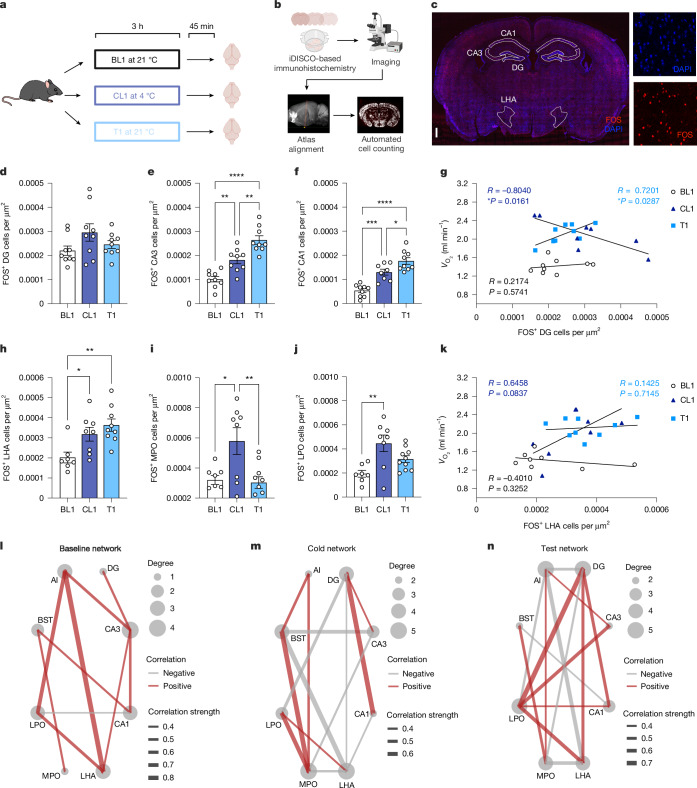
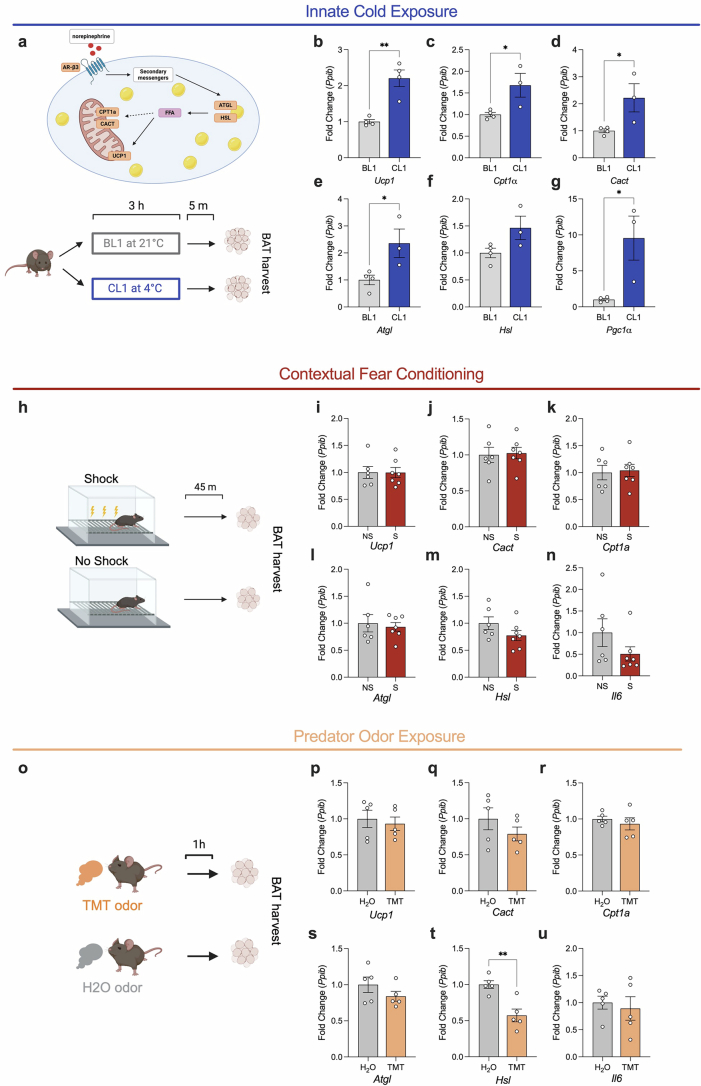
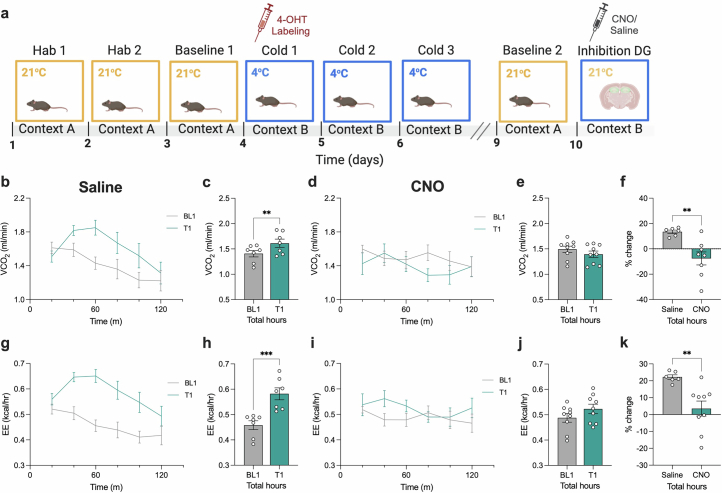
Environmental thermal challenges trigger the brain to coordinate both autonomic and behavioural responses to maintain optimal body temperature1-4. It is unknown how temperature information is precisely stored and retrieved in the brain and how it is converted into a physiological response. Here we investigated whether memories could control whole-body metabolism by training mice to remember a thermal challenge. Mice were conditioned to associate a context with a specific temperature by combining thermoregulatory Pavlovian conditioning with engram-labelling technology, optogenetics and chemogenetics. We report that if mice are returned to an environment in which they previously experienced a 4 °C cold challenge, they increase their metabolic rates regardless of the actual environmental temperature. Furthermore, we show that mice have increased hypothalamic activity when they are exposed to the cold, and that a specific network emerges between the hippocampus and the hypothalamus during the recall of a cold memory. Both natural retrieval and artificial reactivation of cold-sensitive memory engrams in the hippocampus mimic the physiological responses that are seen during a cold challenge. These ensembles are necessary for cold-memory retrieval. These findings show that retrieval of a cold memory causes whole-body autonomic and behavioural responses that enable mice to maintain thermal homeostasis.


Conflict of interest statement

Competing interests: C.A.D. is named on provisional and non-provisional patent applications for the prophylactic use of (R,S)-ketamine and related compounds against stress-induced psychiatric disorders. A.M.Z., A.D., P.B.C., T.M., E.U., J.D.O.L., L.M., C.O.S., L.L. and T.J.R. declare no competing interests.

Figures

Fig. 1
Fig. 1. Contextual cold memories increase metabolic rate and thermogenic gene expression.
a, Experimental timeline. b, Environmental temperature during baseline 1 (BL1, yellow) and cold day 1 (CL1, dark blue). c, Time plot of oxygen consumption between mice during BL1 (yellow), T1 (test, light blue) and CL1 (dark blue). dg, Comparison of oxygen consumption between mice during BL1 (yellow), T1 (light blue) and CL1 (dark blue) at hour 2 (d), hour 4 (e) and hour 6 (f) and for the total time averaged in metabolic cages (g). h, Experimental control timeline. i, Environmental temperature during BL1 (yellow) and NC1 (no cold 1, dark blue). j, Time plot of oxygen consumption between mice during BL1 (yellow), T1 (light blue) and NC1 (dark blue). k, Comparison of oxygen consumption between the cold-paired (light blue) and no-cold-paired (grey) cohorts on the test day (6 h averaged; left) and at hours 2, 4 and 6 (right). l, Comparison of oxygen consumption between the cold-paired (yellow) and no-cold-paired (grey) cohorts on BL1 (6 h averaged; left) and at hours 2, 4 and 6 (right). m, Thermogenic pathway in BAT and experimental timeline. ns, Relative expression of lipolysis and thermogenesis genes (Ucp1 (n), Cpt1a (o), Cact (p), Atgl (q), Hsl (r) and Ppargc1a (which encodes PGC1α; s)) in the BAT of mice during BL2 (grey) compared with T1 (blue). cg,jl,ns, Data are mean ± s.e.m., n = 4–8 mice per group. dg, Repeated measures analysis of variance (ANOVA). kl, Unpaired t-test and two-way repeated measures ANOVA. ns, Unpaired t-test. *P < 0.05, **P < 0.01, ***P < 0.001, ****P < 0.0001. CL2, cold day 2; CL3, cold day 3; FFA, free fatty acid; H1, habituation day 1; H2, habituation day 2; NC2, no cold 2; NC3, no cold 3; VO2, oxygen consumption. Illustrations of timeline (a), adipocyte lipolysis (m, top) and tissue collection (m, bottom) were created in BioRender (https://biorender.com).
Fig. 2
Fig. 2. Contextual cold memories are encoded and retrieved in the hippocampus and hypothalamus.
a, Experimental timeline for tissue collection. b, Automated brain-wide FOS detection pipeline used to identify FOS+ cells in multiple brain regions simultaneously. iDISCO, immunolabelling-enabled imaging of solvent-cleared organs. c, Hippocampal slice (left) with FOS+ cells (red; bottom right) and DAPI+ cells (blue; top right). Scale bar, 500 µm. df, Comparison of FOS+ neurons normalized to area in the DG (d), CA3 (e) and CA1 (f) between mice during BL1 (white), CL1 (dark blue) and T1 (light blue). g, Correlation between FOS+ cells in the DG and oxygen consumption between mice during BL1 (white), CL1 (dark blue) and T1 (light blue). hj, Comparison of FOS+ neurons normalized to area in the LHA (h), MPO (i) and LPO (j) between mice during BL1 (white), CL1 (dark blue) and T1 (light blue). k, Correlation between FOS+ cells in the LHA and oxygen consumption between mice during BL1 (white), CL1 (dark blue) and T1 (light blue). ln, Correlation analysis of FOS+ cells between brain regions at BL1 (l), CL1 (m) and T1 (n). Correlations with R > 0.5 are displayed in red. Correlations with R < 0.5 are displayed in grey. Line thickness is proportional to the strength of the correlation (R value). df,hj, Data are mean ± s.e.m., dn, n = 7–10 mice per group. df,hj, One-way ANOVA. g,k, Simple linear regression with slope comparison. *P < 0.05, **P < 0.01, ***P < 0.001, ****P < 0.0001. Illustration of the tissue collection a and schematic in b created with BioRender (https://biorender.com).
Fig. 3
Fig. 3. Putative contextual cold engrams are in the DG, LHA and MPO.
a, Genetic strategy. b, Experimental timeline. c, Representative image of eYFP+ cells (green). dg, Comparison between the test cohort (dark blue) and control cohort of eYFP+ neurons normalized to area (grey) in the DG (d), the LHA (e), the MPO (f) and the LPO (g). h, Representative image of FOS+ cells (red). il, Comparison between the test cohort (dark blue) and control cohort (grey) of FOS+ neurons normalized to area in the DG (i), the LHA (j), the MPO (k) and the LPO (l). m, Representative image of an eYFP+FOS+ cell. nq, Comparison between the test cohort (dark blue) and control cohort (grey) of colabelled neurons in the DG (n), the LHA (o), the MPO (p) and the LPO (q). rt, Correlation between the percentage of colabelled/eYFP+ cells in the DG and oxygen consumption (r) carbon dioxide production (s) and energy expenditure (EE, t) at T1 (orange), CL1 (black) and BL1 (grey). u, Correlation of percentage of colabelled/eYFP+ cells between regions during the recall of a cold memory on T1. v, Correlation of percentage of colabelled/eYFP+ cells in the control group. cq, Data are mean ± s.e.m., cv, n = 6 mice per group. dg,il,nq, Unpaired t-test. rt, Simple linear regression. u,v, Pearson’s r correlation analysis. *P < 0.05, **P < 0.01, ***P < 0.001. 4-OHT, 4-hydroxytamoxifen; VCO2, carbon dioxide production; Ctxt, context; HC, home cage. Scale bars, 250 μm. Illustrations of the transgenic mouse line (a) and the behavioural time line (b) were created with BioRender (https://biorender.com).
Fig. 4
Fig. 4. Artificial reactivation of cold-sensitive engrams in the DG increases metabolism and thermogenesis genes.
a, Genetic strategy. b, Experimental timeline. c, Environmental temperature during the labelling window. d, Representative image of hippocampal slice with FOS+ cells (red) and eYFP+ cells (green). e, Time plot of oxygen consumption during artificial reactivation of cold-sensitive engrams. Blue bars indicate the time the laser was turned on. fh, Comparison of oxygen consumption between the on (blue) and off (grey) epochs during the three stimulations. i, Comparison of oxygen consumption between the on (blue) and off (grey) epochs of cold-sensitive cells during all stimulations combined. j, Genetic strategy. k, Experimental timeline. l, Representative image of a hippocampal slice with FOS+ cells (red) and eYFP+ cells (green). mo, Comparison of colabelled neurons between the cold-stimulated cohort (dark blue) and the no-cold-stimulated control cohort (grey) in the LHA (m), the MPO (n) and the LPO (o). p, Correlation between the percentage of colabelled/eYFP+ cells in the LHA and oxygen consumption after cold stimulation (blue) and no-cold stimulation (grey). q, Experimental timeline. rv, Relative expression of lipolysis and thermogenesis genes (Ucp1 (r), Cpt1a (s), Hsl (t), Atgl (u) and Ppargc1a (v)) in the BAT of mice with cold-sensitive stimulated cells (blue) and no-cold control-stimulated cells (grey). ei, Data are mean, n = 8–9 mice per group. mp,rv, Data are mean ± s.e.m., n = 5–7 mice per group. ei, Paired t-test. mo, Unpaired t-test. p, Simple linear regression. rv, Unpaired t-test. *P < 0.05, **P < 0.01, ***P < 0.001, ****P < 0.0001. ChR2, channelrhodopsin. Scale bars (d, l), 250 μm. Illustrations of the transgenic labelling systems (a,j), the behavioural timelines (b,k) and the tissue collection timeline (q) were created with BioRender (https://biorender.com).
Fig. 5
Fig. 5. Inhibition of cold-sensitive engrams prevents the memory effects on oxygen consumption.
a, Genetic strategy. b, Representative image of a hippocampal slice with FOS+ cells (red) and mCitrine+ cells (green). Scale bar, 250 μm. c, Experimental timeline. d, Time plot of oxygen consumption of saline-injected mice during BL1 (grey) and T1 (teal). eg, Comparison of oxygen consumption of saline-injected mice during BL1 (grey) and T1 (teal) at hour one, hour two and total time averaged. h, Time plot of oxygen consumption of CNO-injected mice during BL1 (grey) and T1 (teal). ik, Comparison of oxygen consumption of CNO-injected mice during BL1 (grey) and T1 (teal) at hour one, hour two and total time averaged. l, Time plot of the percentage change in oxygen consumption on T1 (teal) compared with BL1 (black) in saline-injected mice. m, Time plot of the percentage change in oxygen consumption on T1 (teal) compared with BL1 (black) in CNO-injected mice. n, Comparison of the percentage change in oxygen consumption between saline-injected (grey) and CNO-injected (teal) mice on T1. Data are mean ± s.e.m., dn, n = 7–8 mice per group. eg,ik, Paired t-test. n, Unpaired t-test. **P < 0.01, ***P < 0.001. Illustration of the transgenic labelling system (a) and the behavioural timeline (c) were created with BioRender (https://biorender.com).
Extended Data Fig. 1
Extended Data Fig. 1. Retrieval of a contextual cold memory increases core body temperature.
a Diagrammatic representation of experimental timeline. b Time plot of core body temperature between mice during Baseline 1 (21 °C; yellow), Test 1 (21 °C; light blue) and Cold 1 (4 °C; dark blue). Comparison of core body temperature between mice during Baseline 1 (21 °C; yellow), Test 1 (21 °C; light blue) and Cold 1 (4 °C; dark blue) at c, hour 2 d, hour 4 e, hour 6 and f, total time averaged in metabolic cages. g Time plot of the change in core body temperature between mice during Baseline 1 (21 °C; yellow), Test 1 (21 °C; light blue) and Cold 1 (4 °C; dark blue) normalized to the average core body temperature on BL1. Time plot of the change in core body temperature between mice during Baseline 1 (21 °C; yellow) and Test 1 (21 °C; light blue) during h, the total 2 h i, the total 4 h and j, total time averaged in metabolic cages. b-j Data shown as mean ± SEM, n = 4 mice per group. c-f, Repeated measures ANOVA. h-j, Paired t-test. *p < 0.05, **p < 0.01, ****p < 0.0001. h, hour; BL1, baseline 1; CL1, Cold 1; T1, Test 1. Schematics in a created with BioRender (https://biorender.com).
Extended Data Fig. 2
Extended Data Fig. 2. Cold exposure increases metabolic rate and alters behavior.
a Time plot of oxygen consumption between mice during Baseline 1 (21 °C; yellow), Baseline 2 (21 °C; orange), Cold 1 (4 °C; dark blue), Cold 2 (4 °C; blue), and Cold 3 (4 °C; light blue; left), with comparisons of total time averaged in metabolic cages (right). b Time plot of energy expenditure between mice during Baseline 1 (21 °C; yellow), Baseline 2 (21 °C; orange), Cold 1 (4 °C; dark blue), Cold 2 (4 °C; blue), and Cold 3 (4 °C; light blue; left), with comparisons of total time averaged in metabolic cages (right). c Time plot of carbon dioxide production between mice during Baseline 1 (21 °C; yellow), Baseline 2 (21 °C; orange), Cold 1 (4 °C; dark blue), Cold 2 (4 °C; blue), and Cold 3 (4 °C; light blue; left), with comparisons of total time averaged in metabolic cages (right). d Time plot of movement between mice during Baseline 1 (21 °C; yellow), Baseline 2 (21 °C; orange), Cold 1 (4 °C; dark blue), Cold 2 (4 °C; blue), and Cold 3 (4 °C; light blue; left), with comparisons of total time averaged in metabolic cages (right). e Time plot of food consumption between mice during Baseline 1 (21 °C; yellow), Baseline 2 (21 °C; orange), Cold 1 (4 °C; dark blue), Cold 2 (4 °C; blue), and Cold 3 (4 °C; light blue; left), with comparisons of total time averaged in metabolic cages (right). a-e Data shown as mean ± SEM, n = 7-8 mice per group. a-e, Repeated measures ANOVA. *p < 0.05, **p < 0.01, ***p < 0.001, ****p < 0.0001. BL1, baseline 1; BL2, baseline 2; CL1, cold 1; CL2, cold 2; CL3, cold 3; VO2, oxygen consumption; VCO2, carbon dioxide emission; h, hour; g, grams.
Extended Data Fig. 3
Extended Data Fig. 3. A memory of a cold-paired context is sufficient to increase metabolic rate and alter behavior.
a Time plot of energy expenditure between mice during Baseline 1 (21 °C; yellow), Test 1 (21 °C; light blue) and Cold 1 (4 °C; dark blue; left), with comparisons at hour 2, hour 4, hour 6 and total time averaged in metabolic cages (right). b Time plot of carbon dioxide production between mice during Baseline 1 (21 °C; yellow), Test 1 (21 °C; light blue) and Cold 1 (4 °C; dark blue; left), with comparisons at hour 2, hour 4, hour 6 and total time averaged in metabolic cages (right). c Time plot of movement between mice during Baseline 1 (21 °C; yellow), Test 1 (21 °C; light blue) and Cold 1 (4 °C; dark blue; left), with comparisons at hour 2, hour 4 and total time averaged in metabolic cages (right). d Time plot of food consumption between mice during Baseline 1 (21 °C; yellow), Test 1 (21 °C; light blue) and Cold 1 (4 °C; dark blue; left), with comparisons at hour 2, hour 4 and total time averaged in metabolic cages (right). a-d Data shown as mean ± SEM, n = 7-8 mice per group. a-d, Repeated measures ANOVA. *p < 0.05, **p < 0.01, ***p < 0.001, ****p < 0.0001. BL1, baseline 1; T1, Test 1; CL1, cold 1; VCO2, carbon dioxide emission; EE; energy expenditure; h, hour.
Extended Data Fig. 4
Extended Data Fig. 4. Increases in metabolic rate on T1 compared to BL1 and BL2 is not due to activity.
a Time plot of the respiratory exchange ratio between mice during BL1 (21 °C; yellow), BL2 (21 °C; orange) and T1 (21 °C; light blue). Comparison of the respiratory exchange ratio between mice during BL1 (21 °C; yellow), BL2 (21 °C; orange) and T1 (21 °C; light blue) at b, hour 2 c, hour 4 d, hour 6 and e, total time averaged in metabolic cages. Comparison of oxygen consumption between male mice during BL1 (21 °C; yellow), BL2 (21 °C; orange) and T1 (21 °C; light blue) at f, hour 2 g, hour 4 h, hour 6 and i, total time averaged in metabolic cages. Comparison of oxygen consumption between female mice during BL1 (21 °C; yellow), BL2 (21 °C; orange) and T1 (21 °C; light blue) at j, hour 2 k, hour 4 l, hour 6 and m, total time averaged in metabolic cages. n Time plot of movement between mice during BL1 (21 °C; yellow), BL2 (21 °C; orange) and T1 (21 °C; light blue). o Comparison of movement between mice during BL1 (21 °C; yellow), BL2 (21 °C; orange) and T1 (21 °C; light blue) for the total time averaged in metabolic cages. p Comparison of energy expenditure between mice during BL1 (21 °C; yellow), BL2 (21 °C; orange) and T1 (21 °C; light blue) for the total time averaged in metabolic cages. q Comparison of oxygen consumption between mice during BL1 (21 °C; yellow), BL2 (21 °C; orange) and T1 (21 °C; light blue) for the total time averaged in metabolic cages. a-q Data shown as mean ± SEM, n = 7-8 mice per group. b-m, o-q, Repeated measures ANOVA. *p < 0.05, **p < 0.01, ***p < 0.001, ****p < 0.0001. BL1, baseline 1; BL2, baseline 2; T1, Test 1; EE, energy expenditure; VO2, oxygen consumption; h, hour.
Extended Data Fig. 5
Extended Data Fig. 5. A memory of a cold-paired context is sufficient to increase metabolic rate and alter behavior in females.
a Time plot of oxygen consumption between female mice during Baseline 1 (21 °C; yellow), Test 1 (21 °C; purple) and Cold 1 (4 °C; dark blue; left), with comparisons at hour 2, hour 4, hour 6 and total time averaged in metabolic cages (right). b Time plot of carbon dioxide production between female mice during Baseline 1 (21 °C; yellow), Test 1 (21 °C; purple) and Cold 1 (4 °C; dark blue; left), with comparisons at hour 2, hour 4, hour 6 and total time averaged in metabolic cages (right). c Time plot of energy expenditure between female mice during Baseline 1 (21 °C; yellow), Test 1 (21 °C; purple) and Cold 1 (4 °C; dark blue; left), with comparisons at hour 2, hour 4, hour 6 and total time averaged in metabolic cages (right). d Time plot of movement between female mice during Baseline 1 (21 °C; yellow), Test 1 (21 °C; purple) and Cold 1 (4 °C; dark blue; left), with comparisons at hour 2, hour 4 and total time averaged in metabolic cages (right). e Time plot of food consumption between female mice during Baseline 1 (21 °C; yellow), Test 1 (21 °C; light blue) and Cold 1 (4 °C; dark blue; left), with comparisons at hour 2, hour 4 and total time averaged in metabolic cages (right). a-e Data shown as mean ± SEM, n = 7-8 mice per group. a-e, Repeated measures ANOVA. *p < 0.05, **p < 0.01, ***p < 0.001, ****p < 0.0001. BL1, baseline 1; T1, Test 1; CL1, cold 1; VO2, oxygen consumption; VCO2, carbon dioxide emission; EE; energy expenditure; h, hour.
Extended Data Fig. 6
Extended Data Fig. 6. A cold memory is maintained after a prolonged break, is not due to stress, and causes avoidance behavior.
a Diagrammatic representation of experimental timeline for Pavlovian conditioning to a cold-paired context with an extended (4 day) break b Time plot of oxygen consumption between mice during BL1 (21 °C; yellow), T1 (21 °C; light blue) and CL1 (4 °C; dark blue) following an extended (4 day) break, with c comparisons of total time averaged in metabolic cages (right). d Time plot of energy expenditure between mice during BL1 (21 °C; yellow), T1 (21 °C; light blue) and CL1 (4 °C; dark blue) following an extended (4 day) break, with e comparisons of total time averaged in metabolic cages (right). f Time plot of carbon dioxide production between mice during BL1 (21 °C; yellow), T1 (21 °C; light blue) and CL1 (4 °C; dark blue) following an extended (4 day) break, with g comparisons of total time averaged in metabolic cages (right). h Time plot of oxygen consumption between mice exposed to TMT (orange) or control mice exposed to H2O (grey). i Comparison of pre (grey) and post (orange) odor exposure between mice exposed to TMT and control mice exposed to H2O. j Diagrammatic representation of experimental timeline for Pavlovian conditioning to the cold-paired side, or no cold paired side, of a CPP apparatus. k Time spent in each chamber of the CPP apparatus during pre-test. l Place preference for the no cold paired side (yellow) of the CPP apparatus compared to the cold-paired side (blue), time spent in either the cold-paired side, or no cold paired side was divided by the time spent in the same chamber during pre-test (Test/Pre-test). b-I,k,l, Data shown as mean ± SEM, n = 5-7 mice per group. c,e,g, Repeated measures ANOVA, i, Two-way ANOVA, k,l, Unpaired t-test. *p < 0.05, **p < 0.01. BL1, baseline 1; T1, Test 1; CL1, cold 1; VO2, oxygen consumption; VCO2, carbon dioxide emission; h, hour; TMT, trimethylthiazoline; s, seconds; CPP, conditioned place preference. Schematics in a and j created with BioRender (https://biorender.com).
Extended Data Fig. 7
Extended Data Fig. 7. Innate cold exposure, but not stress, increases lipolytic and thermogenic gene expression in BAT.
a Diagrammatic representation of the thermogenic pathway in BAT (above), with experimental timeline for tissue collection (below). Relative expression of lipolysis and thermogenesis genes b, Ucp1, c, Cpt1α, d, Cact, e, Atgl, f, Hsl and g, Pgc1α from the BAT of mice housed during BL1 (grey) compared cold exposed mice (CL1; blue). h, Diagrammatic representation of experimental timeline for tissue collection. Relative expression of lipolysis and thermogenesis genes i, Ucp1, j, Cact, k, Cpt1α, l, Atgl, m, Hsl and n, Il6 from the BAT of mice that received foot shocks compared to no shock controls. n = 6-7 mice per group. o Diagrammatic representation of experimental timeline for tissue collection. Relative expression of lipolysis and thermogenesis genes p, Ucp1, q, Cact, r, Cpt1α, s, Atgl, t, Hsl and u, Il6 from the BAT of mice that were exposed to TMT and H2O exposed controls. b-g,i-n,p-u, Data shown as mean ± SEM n = 3-7 mice per group. b-g,i-n,p-u, unpaired t-test. *p < 0.05, **p < 0.01. BAT, brown adipose tissue; FFA, free fatty acid; BL1, baseline 1; CL1, cold 1; m, minutes; NS, no shock; S, shocked; TMT, trimethylthiazoline; h, hour. Schematics in a, h and o created with BioRender (https://biorender.com).
Extended Data Fig. 8
Extended Data Fig. 8. Retrieval of a cold memory does not correlate metabolism with Fos+ in CA3, MPO or LPO, or increase neural activity in every region.
Correlation between oxygen consumption and Fos+ cells in a, CA1, b, CA3, c, MPO, and d, LPO between mice during BL1 (white), CL1 (dark blue) and T1 (light blue). e Representative image of hippocampal slice with Fos+ cells (red) and DAPI+ cells (blue). f Experimental timeline for tissue collection. g Diagrammatic representation of the automated brain-wide Fos detection pipeline used to identify Fos+ cells in multiple brain regions simultaneously. Comparison of Fos+ neurons normalized to area in the h, VMH i, DMH j, PVi k, ARH l, BST m, BLA n, BMA o, CeA p, AI and q, SSp between mice housed during BL1 (white), CL1 (dark blue) and T1 (light blue). Correlation matrix of Fos+ cells normalized to area during r, baseline day (BL1), s, cold training day (CL1) and t, the recall of a contextual cold memory on test day, with positive (red) and negative (grey) correlations. h-t, Data shown as mean ± SEM, a-d, h-t n = 3-9 mice per group. a-d, Simple linear regression with slope comparison, h-q, One-way ANOVA. *p < 0.05, **p < 0.01, ***p < 0.001, ****p < 0.0001. BL1, baseline 1; T1, Test 1; CL1, cold 1; CA3, cornu ammonis 3; CA1, cornu ammonis 1; VO2, oxygen consumption; MPO, medial preoptic area; LPO, lateral preoptic area. BL1, baseline 1; T1, Test 1; CL1, cold 1; VMH, ventromedial hypothalamic nucleus; DMH, dorsomedial nucleus of the hypothalamus; AI, agranular insular area; SSp, primary somatosensory area; PVi, periventricular hypothalamic nucleus -intermediate part; ARH, arcuate hypothalamic nucleus; BST, bed nuclei of the stria terminalis; BLA, basolateral amygdalar nucleus; BMA, basomedial amygdalar nucleus; CeA; central amygdalar nucleus; DG, dentate gyrus; CA3, cornu ammonis 3; CA1, cornu ammonis 1; LHA, lateral hypothalamic area. Schematics in f and g created with BioRender (https://biorender.com).
Extended Data Fig. 9
Extended Data Fig. 9. Distinct stress-related stimuli activate divergent brain regions.
a Diagrammatic representation of experimental timeline for tissue collection. b Representative image of hippocampal slice with Fos+ cells (red) and DAPI+ cells (blue). Comparison of Fos+ neurons normalized to area in the c, DG d, CA3 e, CA1 f, LHA g, DMH h, VMH i, ARH j, PVi k, SSp l, BLA m, BMA and n, CeA of mice that received foot shocks (red) compared to no shock controls (grey). Data shown as mean ± SEM, c-n, n = 5-6 mice per group. c-n, unpaired t-test. *p < 0.05, **p < 0.01, ***p < 0.001. S, shocked; NS, no shock; DG, dentate gyrus; CA3, cornu ammonis 3; CA1, cornu ammonis 1; LHA, lateral hypothalamic area; DMH, dorsomedial nucleus of the hypothalamus; VMH, ventromedial hypothalamic nucleus; ARH, arcuate hypothalamic nucleus; PVi, periventricular hypothalamic nucleus-intermediate part; SSp, primary somatosensory area; BLA, basolateral amygdalar nucleus; BMA, basomedial amygdalar nucleus; CeA; central amygdalar nucleus. Schematic in a created with BioRender (https://biorender.com).
Extended Data Fig. 10
Extended Data Fig. 10. Representative images of optogenetic and chemogenetic experiments.
a-c Representative images of hippocampal slices with Fos+ cells (red), ChR2+ cells (green), DAPI+ cells (blue) and optogenetic implant tracts. d-g Representative images of hippocampal slices with Fos+ cells (red), mCitrine+ cells (green) and DAPI+ cells (blue) of chemogenetic experiments.
Extended Data Fig. 11
Extended Data Fig. 11. Artificial reactivation of cold-sensitive memory engrams in the DG increases metabolic rate.
a Experimental timeline to label and reactivate no cold engrams. b Environmental temperature during the labeling window on no cold day 1. c Time plot of oxygen consumption during artificial reactivation of no cold control engrams (Blue bars indicate laser activation). d, e, f Comparison of oxygen consumption between the on (dark grey) and off (light grey) epochs during the three stimulations of no cold control cells, with g, all stimulations combined. h Change of oxygen consumption before, during and after stimulating cold-sensitive engram cells (blue) and no cold control cells (grey) normalized to the initial 20 min of recording. i Comparison of the change in oxygen consumption during on (blue) and off (grey) epochs between cold-sensitive stimulated cells and no cold control stimulated cells. Time plot of energy expenditure during artificial reactivation of j, cold-sensitive engrams (left) and k, no cold control cells (left), with comparison of oxygen consumption between the on (blue) and off (grey) epochs during the three stimulations of cold-sensitive cells (right). Time plot of carbon dioxide production during artificial reactivation of l, cold-sensitive engrams (left) and m, no cold control cells (left), with comparison of oxygen consumption between the on (blue) and off (grey) epochs during the three stimulations of cold-sensitive cells (right). Blue bars indicate the time the laser was turned on during the 3 stimulation periods. d-g,i-m, Data shown as mean, c-m, n = 8-9 mice per group. d-g,j-m, paired t-test, i, two-way ANOVA. *p < 0.05, **p < 0.01, ****p < 0.0001. VCO2, carbon dioxide production; Stim 1, stimulation 1; Stim 2, stimulation 2; Stim 3, stimulation 3. Schematics in a created with BioRender (https://biorender.com).
Extended Data Fig. 12
Extended Data Fig. 12. Artificial reactivation of cold-sensitive memory engrams in the DG increases metabolic rate in Fos tTA mice and engram activity in the hypothalmus.
a Diagrammatic representation of the Fos tTA transgenic labeling system for ChR2::GFP expression and b, timeline to label cold-sensitive engrams woth Fos tTA mice. Time plot of c, oxygen consumption e, energy expenditure and g, carbon dioxide production during artificial reactivation of cold-sensitive engrams (left), with comparison of on (blue) and off (grey) epochs during the first stimulation of cold-sensitive cells (right). Time plot of d, oxygen consumption f, energy expenditure and h, carbon dioxide production during artificial reactivation of no cold control cells (left), with comparison of on (blue) and off (grey) epochs during the first stimulation of no cold control cells (right). Comparison of eYFP+ neurons normalized to area between the cold stimulated (dark blue) and no-cold stimulated (grey) cohorts in i, the LHA, j, the MPO and k, the LPO. Comparison of Fos+ neurons normalized to area between the cold stimulated (dark blue) and no-cold stimulated (grey) cohorts in n, the LHA, o, the MPO and p, the LPO. Correlation between the percentage of colabeled/eYFP+ cells in i, the MPO and q, the LPO with oxygen consumption after cold stimulation (blue) and no-cold stimulation (grey). Correlation of percentage of colabeled/eYFP+ cells between regions after optogenetic stimulation of m, cold-sensitive engrams and r, no-cold engrams. Blue bars indicate the time the laser was turned on during the 3 stimulation periods. a-h, Data show as mean and, i-k,n-p, as mean ± SEM, n = 6-7 mice per group. c-h,i-p, unpaired t-test, l,q, simple linear regression. *p < 0.05, **p < 0.01. ChR2, channelrhodopsin-2; GFP, green fluorescent protein; DOX, doxycycline; VO2, oxygen consumption; VCO2, carbon dioxide production; Stim 1, stimulation 1; Stim 2, stimulation 2; Stim 3, stimulation 3; LHA, lateral hypothalamic area; MPO, medial preoptic area; LPO, lateral preoptic area. Schematics in a and b created with BioRender (https://biorender.com).
Extended Data Fig. 13
Extended Data Fig. 13. Inhibition of cold-sensitive engrams prevents the memory associated increases in metabolic rates.
a Diagrammatic representation of experimental timeline to label and chemogenetically inhibit contextual cold memory engrams. b Time plot of carbon dioxide production of saline injected mice during baseline 1 (grey) and test day 1 (teal), with c, the total time averaged. d Time plot of carbon dioxide production of CNO injected mice during baseline 1 (grey) and test day 1 (teal) with e, the total time averaged. f Comparison of the percentage change of carbon dioxide production between saline (grey) and CNO (teal) injected mice on test day 1. g Time plot of energy expenditure of saline injected mice during baseline 1 (grey) and test day 1 (teal) with h, the total time averaged. i Time plot of energy expenditure of CNO injected mice during baseline 1 (grey) and test day 1 (teal) with j, the total time averaged. k Comparison of the percentage change of energy expenditure between saline (grey) and CNO (teal) injected mice on test day 1. Data shown as mean ± SEM, b-k, n = 7-8 mice per group. c,e,h,j, paired t-test, f,k, unpaired t-test. **p < 0.01, ***p < 0.001. 4-OHT, 4-hydroxytamoxifen; VCO2, carbon dioxide emission; EE, energy expenditure; T1, test 1; BL1, baseline 1; m, minutes; CNO, clozapine N-oxide. Schematics in a created with BioRender (https://biorender.com).

References

    1. Tan, C. L. & Knight, Z. A. Regulation of body temperature by the nervous system. Neuron98, 31–48 (2018). - PMC - PubMed
    1. Morrison, S. F. & Nakamura, K. Central mechanisms for thermoregulation. Annu. Rev. Physiol.81, 285–308 (2019). - PubMed
    1. Jung, S. et al. A forebrain neural substrate for behavioral thermoregulation. Neuron110, 266–279 (2022). - PubMed
    1. Lal, N. K. et al. Xiphoid nucleus of the midline thalamus controls cold-induced food seeking. Nature621, 138–145 (2023). - PMC - PubMed
    1. Finger, S. Minds Behind the Brain: A History of the Pioneers and Their Discoveries (Oxford Univ. Press, 2004).

LinkOut - more resources