. 2025 Jun;642(8069):980-989.
doi: 10.1038/s41586-025-08891-6. Epub 2025 Apr 23.

Genomic and genetic insights into Mendel's pea genes

Affiliations

Genomic and genetic insights into Mendel's pea genes

Cong Feng et al. Nature. 2025 Jun.

Abstract

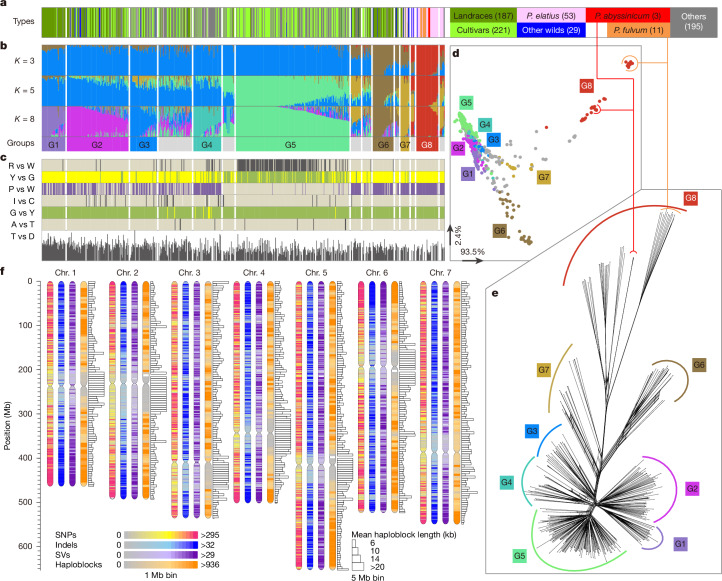
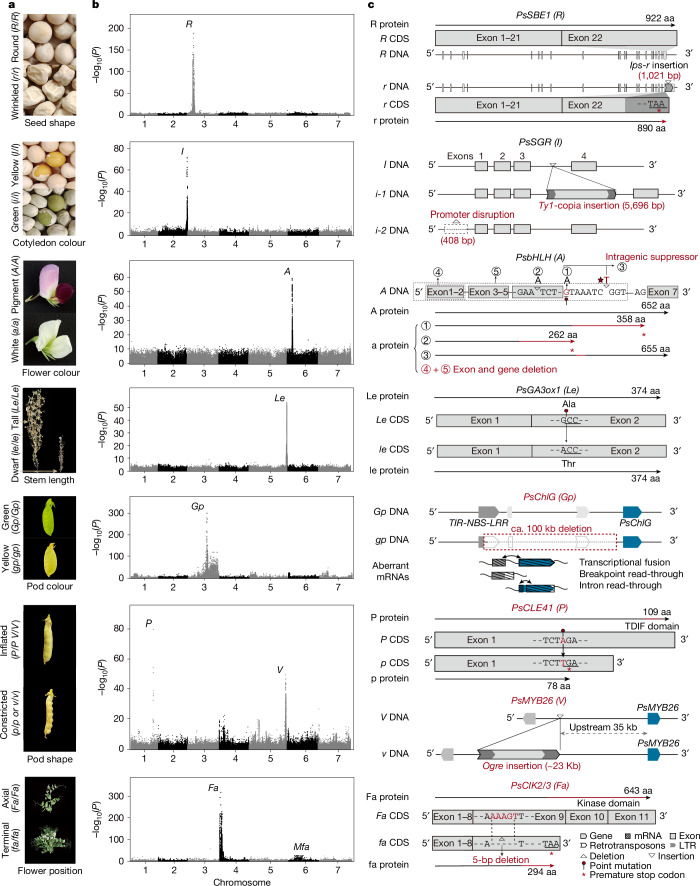
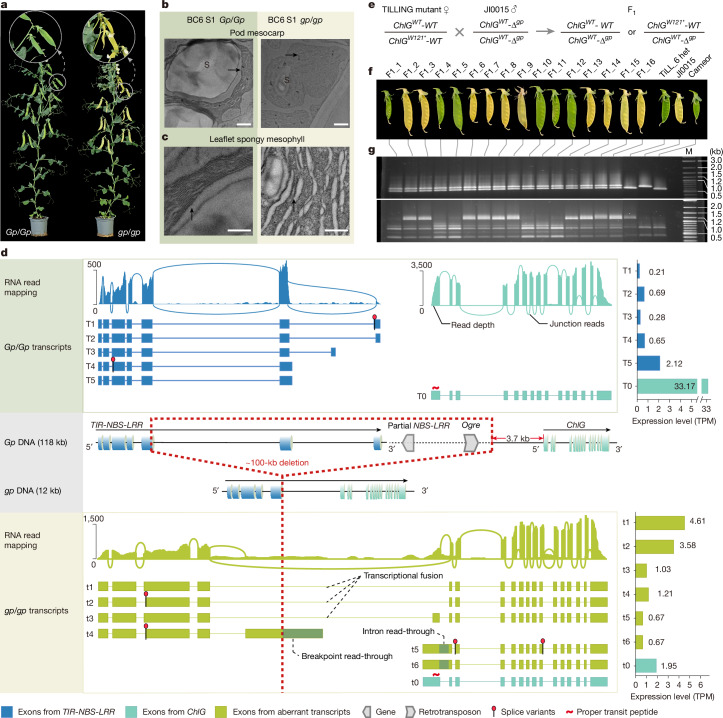
Mendel1 studied in detail seven pairs of contrasting traits in pea (Pisum sativum), establishing the foundational principles of genetic inheritance. Here we investigate the genetic architecture that underlies these traits and uncover previously undescribed alleles for the four characterized Mendelian genes2-7, including a rare revertant of Mendel's white-flowered a allele. Primarily, we focus on the three remaining uncharacterized traits and find that (1) an approximately 100-kb genomic deletion upstream of the Chlorophyll synthase (ChlG) gene disrupts chlorophyll biosynthesis through the generation of intergenic transcriptional fusion products, conferring the yellow pod phenotype of gp mutants; (2) a MYB gene with an upstream Ogre element insertion and a CLE peptide-encoding gene with an in-frame premature stop codon explain the v and p alleles, which disrupt secondary cell wall thickening and lignification, resulting in the parchmentless, edible-pod phenotype; and (3) a 5-bp exonic deletion in a CIK-like co-receptor kinase gene, in combination with a genetic modifier locus, is associated with the fasciated stem (fa) phenotype. Furthermore, we characterize genes and alleles associated with diverse agronomic traits, such as axil ring anthocyanin pigmentation, seed size and the 'semi-leafless' form. This study establishes a foundation for fundamental research, education in biology and genetics, and pea breeding practices.


Conflict of interest statement

Competing interests: The authors declare no competing interests.

Figures

Fig. 1
Fig. 1. Genotypic and phenotypic variation with respect to population and genome structure within Pisum.
a, Taxa types and other classifications indicated by colour on the right, including wild taxa (P. fulvum, P. elatius and other wild taxa listed in Supplementary Tables 1 and 5) and domesticated taxa (P. abyssinicum and P. sativum), further divided into cultivars, landraces and other, which mostly comprises genetic stocks. The number in brackets denotes the number of accessions for each classification. b, Admixture analyses at K = 3 (average of 5 runs), K = 5 (average of 3 runs) and K = 8 (one run that splits K = 5 groups). Accessions strongly assigned to admixture groups are colour-coded, with grey indicating admixture (see Supplementary Table 5). c, Distribution of phenotypes for Mendel’s seven pea traits, with initials labelled as follows: R (round, pale) versus W (wrinkled, black), seed shape; Y (yellow) versus G (green), cotyledon colour; P (pigmented, purple) versus W (white, pale), flower colour; I (inflated, pale) versus C (constricted, black), pod shape; G (green) versus Y (yellow), pod colour; A (axial, pale) versus T (terminal, black), flower position; and T (tall) versus D (dwarf), internode length. The bar length is proportional to internode length. d, Principal component analysis (PCA) of PLINK distance matrix for all accessions, with accessions having Q value > 0.75 colour-coded. e, Splits Tree analysis of accessions with Q value > 0.75, with colours matching PCA groups. f, Pisum genomic variation map across all seven chromosomes, including SNPs, insertions and deletions (<50 bp), large-scale structural variations (SVs) and the linkage disequilibrium (LD)-based haplotype map. Source data
Fig. 2
Fig. 2. Genetic architecture and genomic diversity of the genes underlying the seven pairs of contrasting traits that Mendel studied in detail.
a, Images of the contrasting phenotypes of the seven traits. b, Manhattan plots from the GWAS showing the genomic regions with strong peaks associated with phenotypic differences of each trait as scored in this study and plotted against the ZW6 assembly. c, Gene models for R, I, A, Le, P and Fa and associated genomic regions (Gp and V), depicting the wild-type and natural mutant alleles underlying each of the seven traits. Text and illustrations marked in red indicate those identified in this study. Details are provided in the text and Supplementary Information. aa, amino acids.
Fig. 3
Fig. 3. Characterization of the gp mutant.
a, General view of near-isogenic plants (BC6 S1 generation from the cross JI0015 gp/gp x Caméor Gp/Gp) developed in this study. Pot diameter is 9 cm. b, Transmission electron microscopic (TEM) sections of pod mesocarp cells. Scale bars, 1 μm. c, TEM sections of leaflet spongy mesophyll cells. Note the poorly developed thylakoid membranes (arrows) in gp compared to Gp. Scale bars, 0.5 μm. d, An approximately 100-kb genomic deletion adjacent to ChlG is illustrated for gp compared to the reference genome ZW6 (Gp). The deletion event in gp lines is illustrated on the Gp reference genome by the dashed box. The approximately 100-kb deletion event was called according to genome assembly comparisons between JI0015 and JI2822 (ref. ). Far right, expression of transcript types T0 and T1–T5 (Gp/Gp wild type; top right) and t0 and t1–t6 (gp/gp mutant; bottom right); numbers at ends of (or in) bars indicate the expression (in transcripts per million (TPM)). More details are provided in Supplementary Figs. 15–19 and Supplementary Tables 23–27. e, Crossing scheme for a complementation test between Caméor M4 TILLING line 411.1 carrying one lethal allele of ChlG and gp (JI0015), with the two types of expected F1 genotype. ChlGWT and ChlGW121* represent the wild-type and TILLING alleles of ChlG. WT represents the presence of the wild-type (Caméor) sequence between ChlG and the TIR-NBS-LRR gene, and Δgp represents the approximately 100-kb deletion, which co-segregates with gp. The question being addressed is whether ChlGW121*-WT complements gp (ChlGWT-Δgp). f, F1 pods segregating for green versus yellow. The number after the underscore is the plant number; the parental lines (TILL_6 het and JI0015) and wild-type Caméor are also shown. g, Codominant PCR marker test confirming that all plants presumed to be F1 are Gp/gp heterozygotes (top) and a dCAPS marker PCR test confirming that only the yellow-podded F1 plants inherited the ChlGW121* TILLING allele (bottom). M, DNA size marker (0.5 – 3 kb; 100 bp ladder lane from 1 kb to 0.5 kb and below).
Fig. 4
Fig. 4. A Genome–phenome association map for the identification of genetic loci that confer agronomic traits.
a, Summary of the most significant trait–marker associations underlying a variety of agronomic traits presented as a combined Manhattan plot. Gene symbols shown in a circle correspond to Mendel’s loci. b, Manhattan plot of GWAS data for seed protein content, showing a peak overlapped with the R gene locus. c, Manhattan plot of GWAS data for the presence or absence of axial ring pigmentation, on a subset of phenotypic data excluding accessions carrying white flowers (a/a). These data were collected at Harbin (northern China, 2022). A peak at the expected genomic position of D is significantly associated with the accumulation of axillary anthocyanin, and the peak at chromosome 6 is the location of A. d, Genomic interval of D locus on chromosome 2 defined by recombinant inbred lines (RIL) mapping and GWAS analyses, further defined by bioinformatic analysis of FN mutants as a MYB gene cluster,,, with the genes PsMYB104 and PsMYB106 both deleted in the d mutant line FN1218/6. The region outlined in red line indicates the approximate position of the deletion detected in FN1218/6 from mapping of sequence reads. e, Manhattan plot of GWAS data for Af/af (semi-leafless phenotype). Scale bar, 5 cm. f, Manhattan plot of GWAS data for hundred seed weight (HSW) and pod width (PW). The HSW and pod width genomic intervals span the same 8 Mb genomic region, named Organ Size 1 (PsOs1). Scale bar, 2 cm. g, Narrowed genomic interval of PsOs1 on chromosome 2 defined by two F2 mapping populations and BSA analysis (Methods) as a 1.01-Mb region encompassing 11 protein-coding genes, of which Psat02G0011300 (marked in yellow) is the most highly expressed gene. Photographs in c,e,f show the corresponding contrasting phenotypes. Source data
Extended Data Fig. 1
Extended Data Fig. 1. Schematic illustration of the genetic loci for each of Mendel’s seven traits plotted along the seven chromosomes (linkage groups).
The four previously cloned genes (R, I, A, Le) are annotated in black text, while the remaining genes with their gene identities and variations, or proposed candidates and variants, elucidated in this study (P, V, Gp, Fa) are highlighted in red text. The Mfa genetic locus, where the gene identity remains unknown, is also marked. Difference in the form of the ripe pods on chromosome 1 (LGVI, PP/pp) and 5 (LGIII, VV/vv); yellow versus green cotyledons (II/ii) on chromosome 2 (LGI); round seed versus wrinkled seed (RR/rr) and the colour of unripe pods (GpGp/gpgp) on chromosome 3 (LGV); difference in the position of the flower (FaFa/fafa) on chromosome 4 (LGIV); tall versus dwarf plants (LeLe/lele) on chromosome 5 (LGIII); seed coat (and flower) colour (AA/aa) on chromosome 6 (LGII).
Extended Data Fig. 2
Extended Data Fig. 2. Gene identity and functional variation underlying parchmentless pods (P vs. p).
a, Manhattan plot from GWAS analysis for the parchmentless pod trait, based on the ZW6 genome reference. b, Close-up view of the Manhattan plot in the most significant region identified in panel a. c, F2 genetic mapping interval derived from the cross JI2822 x JI0816, showing the mapped locus between markers AX-183563747 and AX-183563750 (chr1: 380,049,894-380,967,975) (Supplementary Tables 18–20). d, Map of gene positions within the P interval with Psat01G0420500 encoding a tracheary element differentiation inhibition factor CLE41 indicated in yellow. e, Allelic and haplotype variations for Psat01G0420500. Note that Hap1 carries a silent A-to-C transversion at chr1_380699321, close to chr1_380699320 of Hap3, where the T-to-A transversion is responsible for the Arg79* nonsense mutation. f, Haplotypes of Psat01G0420500 corresponding to accessions with ‘parchmentless’ phenotypes. g, Predicted amino acid sequence of Psat01G0420500 indicating the position of the Arg79* mutation in relation to the TDIF motif. h, Gene expression patterns for the 10 candidate genes from the genomic interval, in various organs and developmental stages of Caméor, showing that Psat01G0420500 (PsCLE41) is expressed exclusively in pod. Three biological replicates were used for each sample. The Min-Max scaling (normalization) approach was used to calculate the expression level for each gene across stages and organs by the formula: X_scaled = (X - X_min)/(X_max - X_min), where X is the original gene expression value, X_scaled is the scaled value, X_min is the minimum value of X, and X_max is the maximum value of X. Source data
Extended Data Fig. 3
Extended Data Fig. 3. V and parchmentless pods.
a, Manhattan plot of GWAS analysis based on the ZW6 genome reference for a subset of accessions carrying only the R79* allele (haplotype 3 in Extended Data Fig. 2e) of gene Psat01G0420500 and wild type accessions (i.e. no v/v mutants), showing the P GWAS signal but not the V GWAS signal. b, Manhattan plot of GWAS analysis from a subset of accessions excluding those with haplotype 3 (Extended Data Fig. 2e) of gene Psat01G0420500 (i.e. no p/p but only the v/v mutants). This analysis shows only the V GWAS signal but not the P GWAS signal. c, Close-up view of the local details of the chromosome 5 GWAS peak corresponding to V. d, Genetic mapping of V vs v from previous studies. e, Candidate genes (19) within the V genetic interval, with Psat05G0804500 (PsMYB26) highlighted in orange. f, Gene expression level in the pod tissues (8 days post flowering, three biological replicates for each sample) compared between the wild-type line (P/P V/V, JI1995) and the mutant line (P/P v/v, JI0074), across the 19 candidate genes under the interval. g, Allelic and haplotype variation in Psat05G0804500 (PsMYB26) across the diversity panel. All parchmentless accessions, except those carrying the R79* allele of P, are associated with a 23 kb Ogre retrotransposon element insertion. h, Gene expression patterns for the 19 candidate genes in various organs and developmental stages (three biological replicates for each sample) of Caméor, showing that Psat05G0804500 (PsMYB26) is expressed exclusively in pod and endocarp (red box). The normalization and statistical approach is the same as described in Extended Data Fig. 2h. Source data
Extended Data Fig. 4
Extended Data Fig. 4. Anatomical and molecular characterization of pod endocarp development and associated pathways.
a-c, Microscopic imaging showing the anatomical patterns of the pod endocarp in wildtype (P/P V/V, JI2776) at different developmental stages: 3 days, 8 days, and 12 days post flowering. d, Gene expression levels, measured by RNA-seq approach, of key genes involved in the conserved well-established TDIF-PXY-WOX signalling pathway (PsCLE41, PsSERK, PsPXY, PsWOX4, PsWOX14) and two key component genes (PsMYB26, PsNAC) which have been reported to be involved in the secondary cell wall thickening and lignification in Arabidopsis. Expression data were obtained from various organs at different developmental stages (three biological replicates for each sample) in Caméor. The normalization and statistical approach was the same as described in Extended Data Fig. 2h. e, Comparative microscopic imaging of pod endocarp anatomical patterns at 12 days post flowering in four genotypes: P/P V/V (JI0190), p/p V/V (JI0466), P/P v/v (JI0074), and p/p v/v (JI0134). f, qRT_PCR analysis of PsCLE41, PsPXY, PsMYB26, and PsNAC in lines with different genotypes (P/P V/V, p/p V/V, P/P v/v, p/p v/v). The pod samples were obtained 8 days post flowering. Two different lines were selected for each genotype, with five biological replicates (n = 5) for each sample. Data are presented as mean ± SEM, and statistical significance was determined using a two-sided t-test (which applies to g). g, qRT_PCR results of PsMYB26 and PsNAC compared between the control and the VIGS-silenced lines. Three to five biological replicates were used for each sample both in the control and silenced lines. h, Proposed model illustrating the functional roles of PsCLE41 and PsMYB26 in pod endocarp development and lignin biosynthesis. Source data
Extended Data Fig. 5
Extended Data Fig. 5. Identification of PsCIK2/3 as a candidate gene for Fa associated with fasciation.
a, Manhattan plot of GWAS based on the ZW6 genome reference, revealing a significant peak for fasciation between 0 and 40 Mb on chromosome 4; b, Close up of Manhattan plot of GWAS in the region of the peak in panel a; c, Bulked segregant mapping analyses (BSA) from sequencing fasciated and wild-type bulks of the F2 populations derived from the cross: Caméor (Fa/Fa) x JI0814 (fa/fa), and JI2822 (Fa/Fa) x JI0816 (fa/fa), further refining the genetic interval for Fa; d, Fine mapping of the Fa locus using two populations. In Caméor x JI0814 (Mapping 1), the region was narrowed down to chr4: 18,144,306-19,945,776 using 8 pairs of KASP markers (Supplementary Table 34); in the JI2822 x JI0816 population (Mapping 2), the interval was further confined chr4:18,180,969-19,506,907 (marker interval AX-183636277-AX183633456, Supplementary Table 18). e, Local detail of the fine-mapped genomic interval from panel d, showing 20 protein-coding genes, with Psat04G0031700 (encoding a Senescence-Associated Receptor-Like Kinase, PsCIK2/3) highlighted in orange; f, Population-based haplotype clustering analysis across the diversity panel for the 1.33Mb Fa region, identifying a cluster of fasciated accessions in Hap5; g, Haplotype clustering analysis of Psat04G0031700 (PsCIK2/3) reveals a 5 bp deletion associated with the fasciated phenotype, clustering all fasciated accessions into Hap3. h, Amino acid sequence alignment of PsCIK2/3 proteins from the wild-type line (JI2822, Fa, Psat04G0031700), the mutant line (JI0816, fa, Psat04G0031700-5bp), and the ortholog from Arabidopsis (AT2G23950.1, AtCIK2). Source data
Extended Data Fig. 6
Extended Data Fig. 6. Functional characterization of PsCIK2/3.
a, Flowering stage phenotype of Caméor (Fa/Fa, left) and JI0814 (fa/fa, right). b, Longitudinal section of 40-day-old stems from Caméor and JI0814, stained with safranin and fast green; the red crosses mark the region of the shoot apical meristem (SAM) in both genotypes. c, Transverse section of the apical meristem of 14-day-old paraffin-embedded stems, from Caméor (left) and JI0814 (right), stained with toluidine blue. d, Quantification of the number of vascular bundles in the longitudinal section of 40-day-old stems of Caméor and JI0814. e, Cross-sectional area of the apical meristem in 14-day-old stems of Caméor and JI0814. Three biological duplicates were used. ** represents a significant level at P < 0.01 using a Student’s t-test in (d) and (e). f, Gene expression level from RNA-seq data for key genes involved in the CLV3-WUS signalling pathway measured across different organs and developmental stages (three biological replicates for each sample) in Caméor. The normalization and statistical approach is the same as described in Extended Data Fig. 2h. g, qRT_PCR analysis of gene expression for key genes involved in the CLV3-WUS signalling pathway, comparing the apical bud and stem between the wild-type line (Caméor) and the fasciated line (JI0814). Three biological replicates (n = 3) were used for each sample. The samples were obtained 14 days post budding. Data are presented as mean ± SEM, and statistical significance was determined using a two-sided t-test. The calculation used H3 as the reference gene, with P_value <= 0.001 marked as “***”, P_value <= 0.01 marked as “**”, P_value <= 0.05 marked as “*”, P_value >0.05 marked as “ns”. h, In situ hybridization of PsCIK2/3 in the apical bud compared between the wild-type line (JI2716) and the fasciated line (JI0814). i, Subcellular localization of PsCIK2/3 in Nicotiana benthamiana, showing co-localization with the cell membrane. j, Yeast two-hybrid assay showing interaction of PsCIK2/3 with PsCLV1 and PsCLV2. Source data
Extended Data Fig. 7
Extended Data Fig. 7. Segregation analysis of Fa and Mfa.
a, Genotype data from the JI2822 x JI0816 F2 population, presented in an Excel spreadsheet format. The F2 individuals are sorted left to right according to their phenotype and their genotypic scores at Fa and Mfa. In the central upper part of the figure, homozygous JI0816 genotypes (fa/fa) are represented in yellow, homozygous JI2822 genotypes (Fa/Fa) are represented in green, and heterozygotes (Fa/fa) are represented in blue. In the central lower part of the figure, homozygous JI0816 genotypes (Mfa/Mfa) are represented in yellow, homozygous JI2822 genotypes (mfa/mfa) are represented in green, and heterozygotes (Mfa/mfa) are represented in blue. The limits of recombination intervals are marked by horizontal black lines. Wild-type (dark green) and fasciated (orange) phenotype scores are shown above the genotyping data. Homozygous and heterozygous genotypes at a proposed modifier locus, mfa, are shown below the genotyping data. F2 individuals informative for the positioning of Fa are marked with a red box; b, Tables explaining a one gene model of the summarised numerical data from panel a, where genotype fa/fa is fasciated; c, Tables explaining a two gene model of the summarised numerical data from panel a, showing the postulated Fa Mfa interaction, where the dominant allele Mfa is required for fasciation to occur. In this model fa/fa mfa/mfa is wild type but fa/fa Mfa/_ is fasciated. In both tables the numbers in red are F2 individuals with unexpected genotype/phenotype combinations, which were further tested and confirmed in the F3 population (Supplementary Notes and Supplementary Fig. 28).
Extended Data Fig. 8
Extended Data Fig. 8. Identification of genomic loci associated with major agronomic traits.
a, Multi-site phenotyping experiments were conducted to measure 79 traits in total from distinct climate zones at three different locations: Southern China (22°N, Shenzhen), Northern China (45°N, Harbin), and the UK (52°N, Norwich). Map created using the maps package (3.4.0) in R (version 4.2). b, Illustrative photographs and drawings of phenotypic data collected for different trait categories scored in this study. The points in the hexagon represent the total number of sub-traits collected for each category, with the red line indicating the total number of phenotypes assessed (Supplementary Table 37). c, Significant marker-trait associations (MTAs) and their genetic effects for component traits from seeds, pods, leaves, flowers, roots and plant architecture. The number of sub-traits for each category is shown in parentheses. Specific examples for some of the selected Manhattan plots are shown to explain: d, The acute vs. blunt pod tip phenotypes, corresponding to the Bt locus (a locus known from classical genetics alone). e, The pod neoplasm phenotype, the development of pustular-like growths, known as ‘neoplasms’. The locus known from classical genetics is Np. f, Green pod vs purple pod phenotypes corresponding to the known genetic loci: Pur and Pu. g, A new locus at the end of chromosome 3, underlying the seed number (SDN) per pod. h, Variations in flower number per axillary inflorescence corresponding to the known genetic loci: Fn and Fna. i, A new locus on chromosome 3, underlying the total seed weight per plant (SDY), a yield component trait. j, Variation in flowering time corresponding to the Hr locus. k, A new locus underlying flower size (FLS), on chromosome 1. l, Brown vs black hilum colour phenotypes, corresponding to the Pl locus. m, A historical locus (Ser1) at chromosome 5, explaining the phenotypic variation in leaflet margin serration.

References

    1. Mendel, G. Versuche über plflanzenhybriden. Verh. Naturforsch. Vereines Brünn4, 3–47 (1866).
    1. Bhattacharyya, M. K., Smith, A. M., Ellis, T. H. N., Hedley, C. & Martin, C. The wrinkled-seed character of pea described by Mendel is caused by a transposon-like insertion in a gene encoding starch-branching enzyme. Cell60, 115–122 (1990). - PubMed
    1. Martin, D. N., Proebsting, W. M. & Hedden, P. Mendel’s dwarfing gene: cDNAs from the le alleles and function of the expressed proteins. Proc. Natl Acad. Sci. USA94, 8907–8911 (1997). - PMC - PubMed
    1. Armstead, I. et al. Cross-species identification of Mendel’s i locus. Science315, 73 (2007). - PubMed
    1. Sato, Y., Morita, R., Nishimura, M., Yamaguchi, H. & Kusaba, M. Mendel’s green cotyledon gene encodes a positive regulator of the chlorophyll-degrading pathway. Proc. Natl Acad. Sci. USA104, 14169–14174 (2007). - PMC - PubMed