. 2025 May;27(5):749-761.
doi: 10.1038/s41556-025-01658-1. Epub 2025 Apr 23.

α-Ketoglutarate promotes trophectoderm induction and maturation from naive human embryonic stem cells

Affiliations

α-Ketoglutarate promotes trophectoderm induction and maturation from naive human embryonic stem cells

Karlien Van Nerum et al. Nat Cell Biol. 2025 May.

Abstract

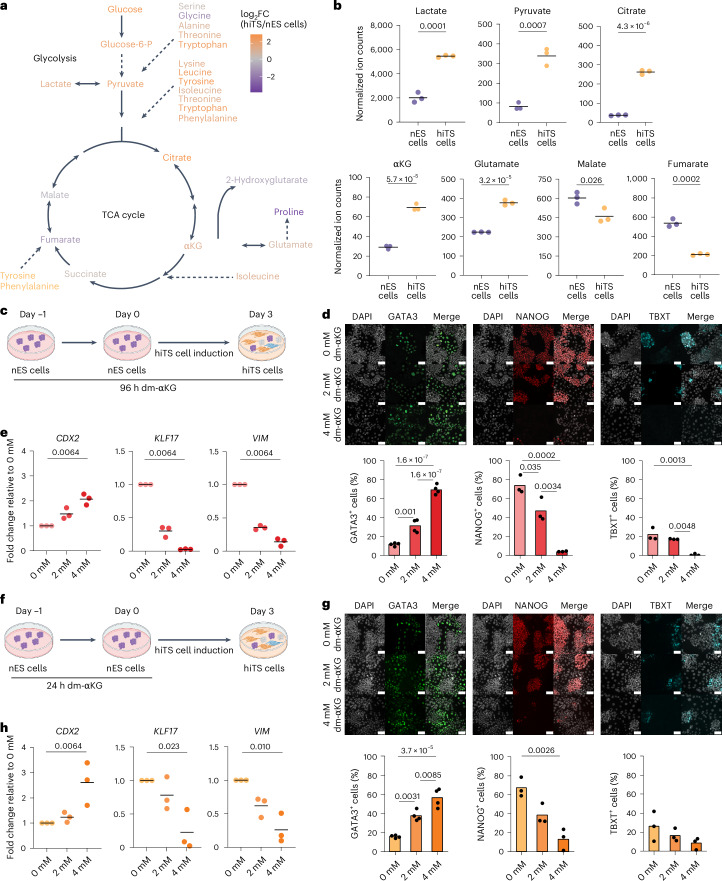
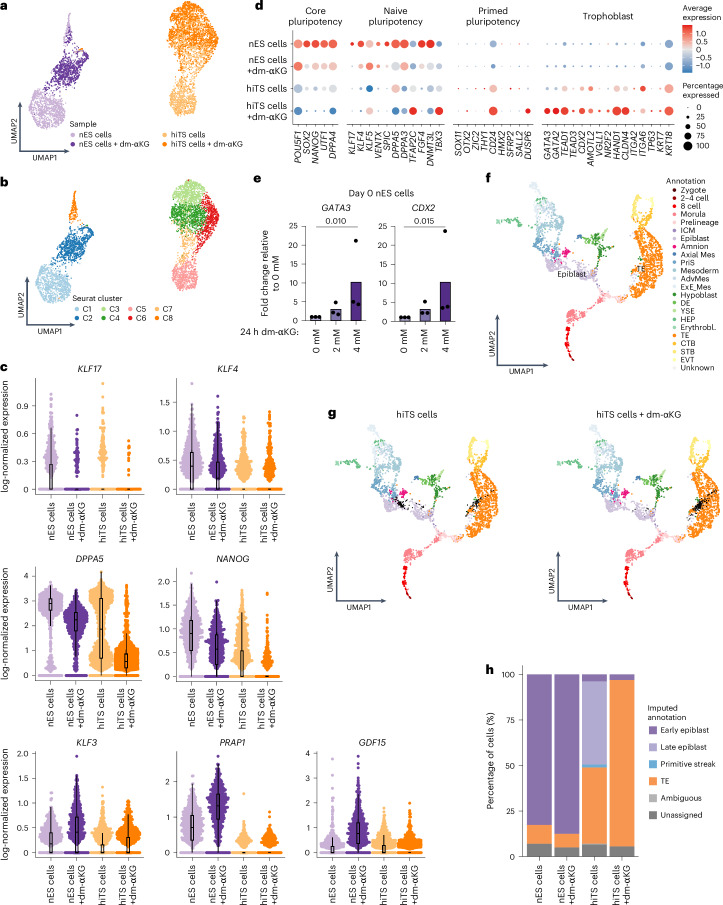
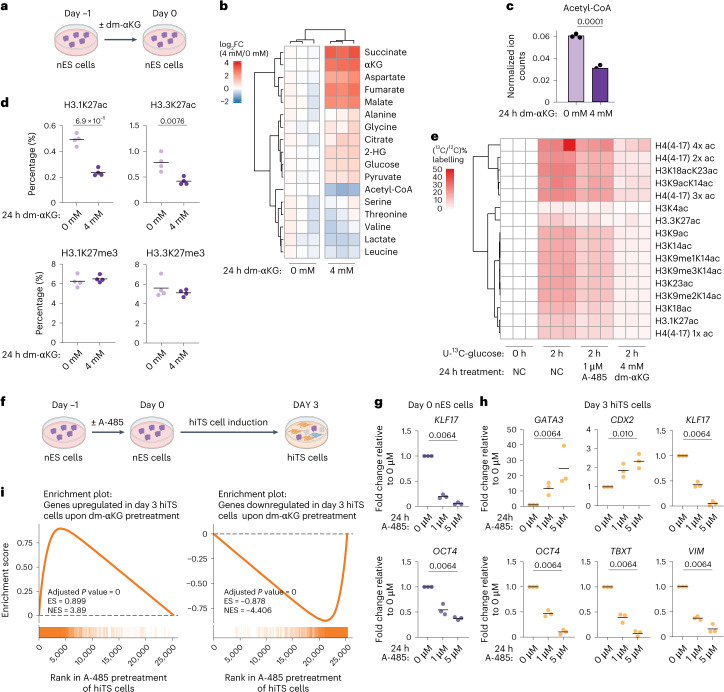
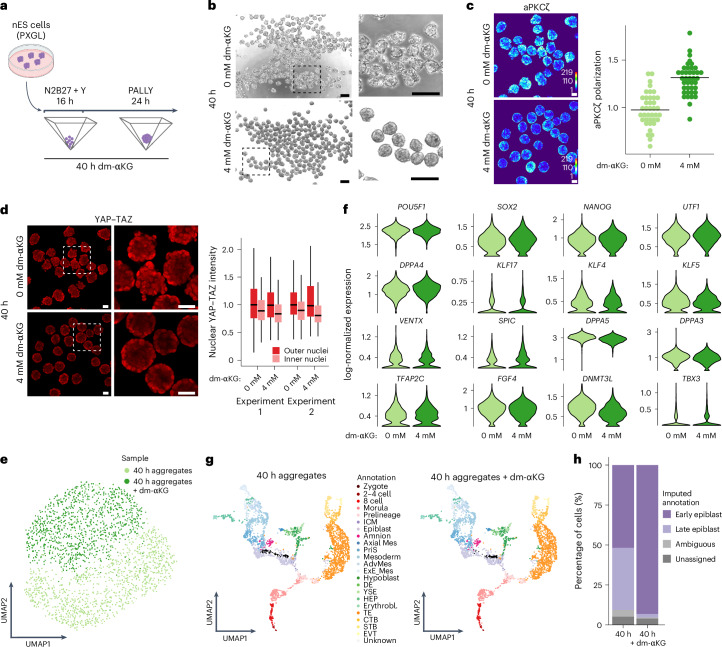
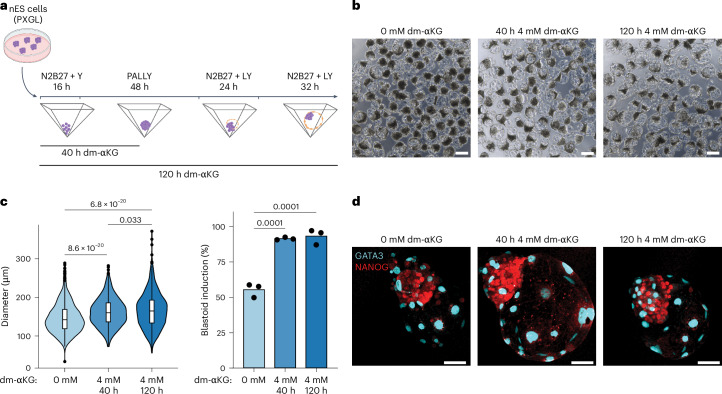
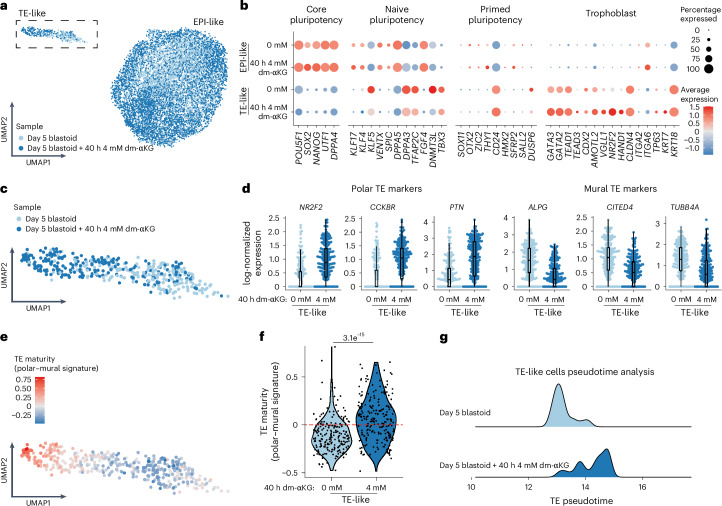
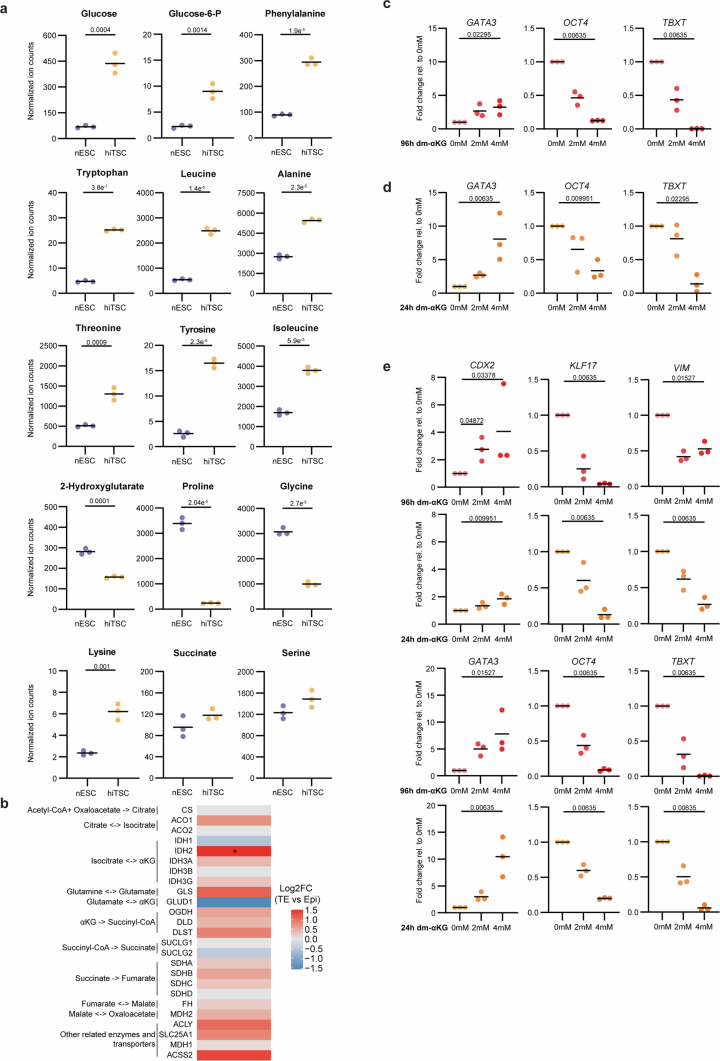
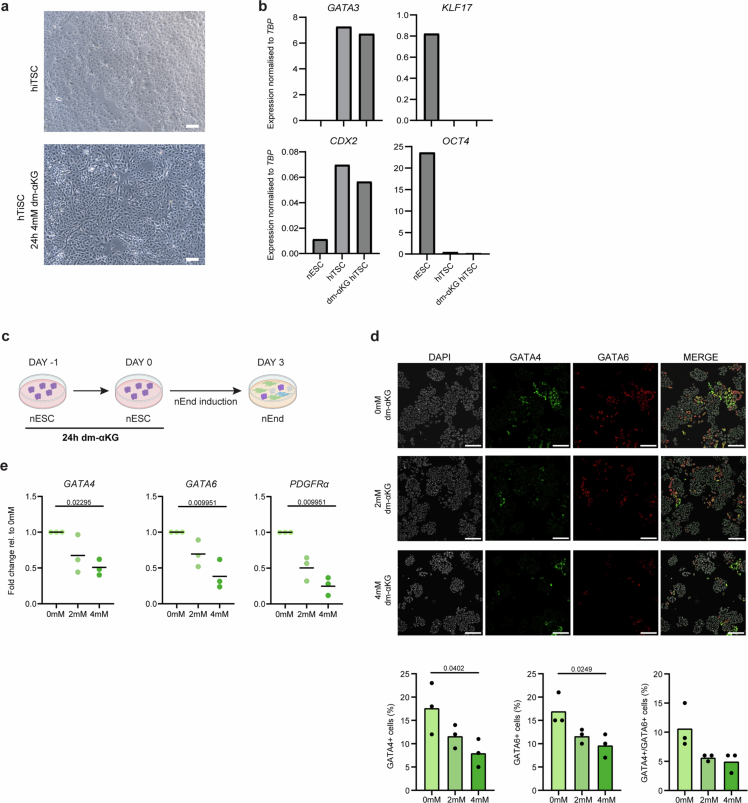
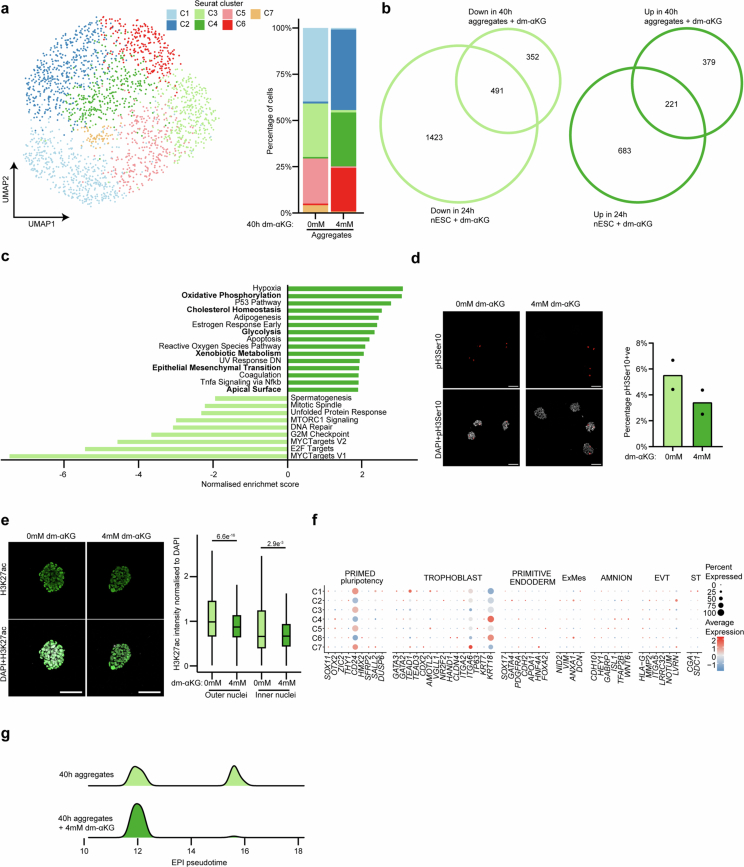
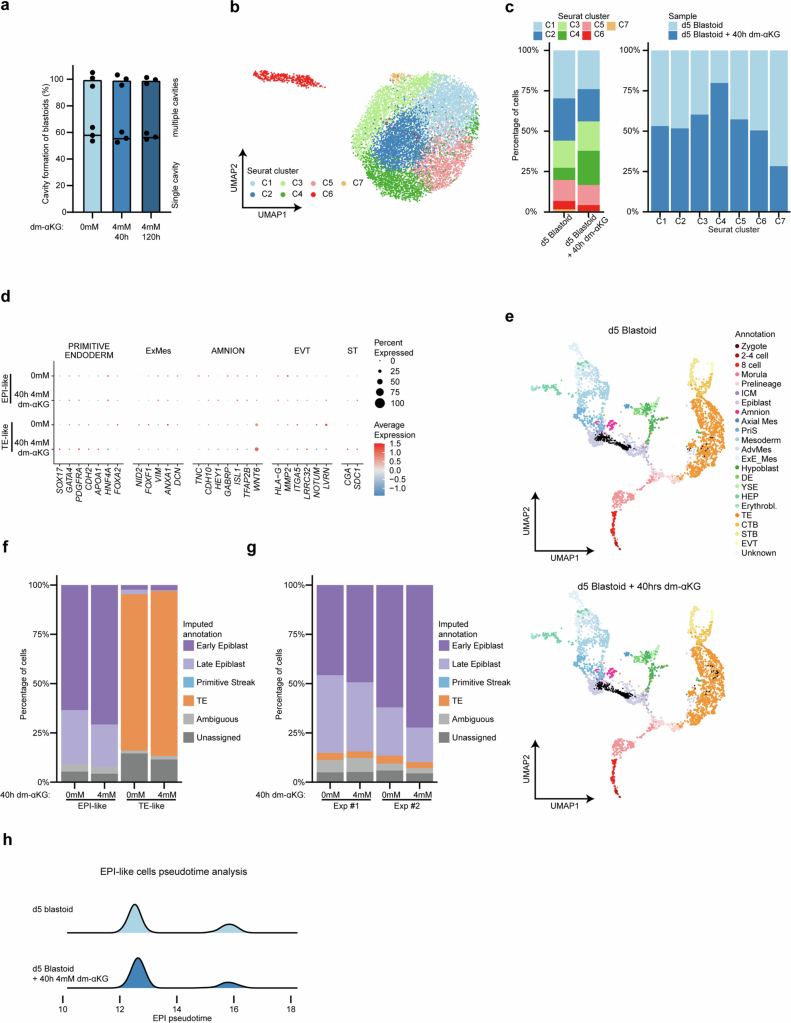
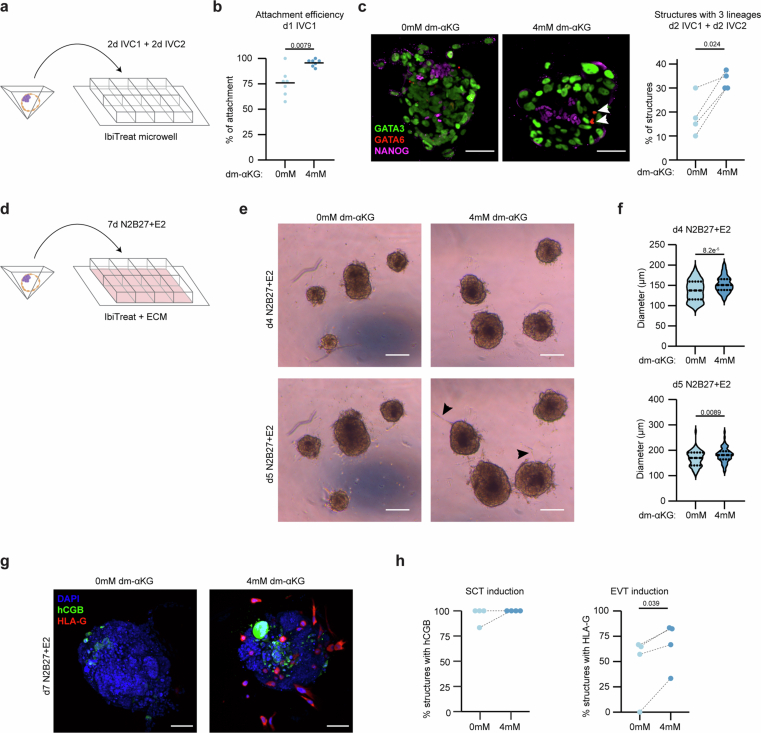
Development and lineage choice are driven by interconnected transcriptional, epigenetic and metabolic changes. Specific metabolites, such as α-ketoglutarate (αKG), function as signalling molecules affecting the activity of chromatin-modifying enzymes. However, how metabolism coordinates cell-state changes, especially in human pre-implantation development, remains unclear. Here we uncover that inducing naive human embryonic stem cells towards the trophectoderm lineage results in considerable metabolic rewiring, characterized by αKG accumulation. Elevated αKG levels potentiate the capacity of naive embryonic stem cells to specify towards the trophectoderm lineage. Moreover, increased αKG levels promote blastoid polarization and trophectoderm maturation. αKG supplementation does not affect global histone methylation levels; rather, it decreases acetyl-CoA availability, reduces histone acetyltransferase activity and weakens the pluripotency network. We propose that metabolism functions as a positive feedback loop aiding in trophectoderm fate induction and maturation, highlighting that global metabolic rewiring can promote specificity in cell fate decisions through intricate regulation of signalling and chromatin.


Conflict of interest statement

Competing interests: M.V.-A. is CEO of MoleQlar Analytics GmbH. The University of Copenhagen has filed patent application EP24163585.3 describing the use of dm-αKG enhancing trophectoderm quality. J.J.Z. and K.V.-N. are the inventors of this patent. All other authors declare no competing interests.

Figures

Fig. 1
Fig. 1. Metabolic asymmetry between nES cells and hiTS cells regulates trophoblast induction.
a, A schematic representation of measured metabolites in glycolysis and TCA cycle; metabolites are colour coded on the basis of their log2 fold change (FC) between hiTS cells and nES cells. b, Ion counts of metabolites measured by gas chromatography–mass spectrometry normalized to protein content (the line shows the mean). c, A schematic of hiTS cell induction with 96 h dm-αKG treatment. d, Top: representative IF images of trophoblast (GATA3), pluripotency (NANOG) and primitive streak (TBXT) markers at day 3 of hiTS cell induction, treated for 96 h with 0, 2 or 4 mM of dm-αKG. Bottom: IF quantification. e, Expression levels of trophoblast (CDX2), pluripotency (KLF17) and extra-embryonic mesoderm (VIM) marker genes, determined by RT-qPCR. The expression values were normalized to TBP and presented as fold change relative to the untreated day 3 hiTS cells. f, A schematic of hiTS cell induction with 24 h dm-αKG pretreatment. g, Top: representative IF images of GATA3, NANOG and TBXT at day 3 of hiTS cell induction, treated for 24 h with 0, 2 or 4 mM of dm-αKG. Bottom: IF quantification. h, Expression levels of CDX2, KLF17 and VIM, determined by RT-qPCR. The expression values were normalized to TBP and presented as fold change relative to the untreated day 3 hiTS cells. Data are presented as the mean and data points of N = 3 biological replicates (b, d, e, g and h). P values were calculated by two-sided unpaired t-tests (b), ordinary one-way analysis of variance (ANOVA) tests (d and g) or Kruskal–Wallis tests with Bonferroni correction (e and h). Scale bars, 50 μm. Created with BioRender.com (c and f). Source data
Fig. 2
Fig. 2. Metabolic rewiring by dm-αKG increases nES cell competence towards the TE fate.
a,b, UMAP plots from scRNA-seq analysis of samples collected as in Fig. 1f. Cells are coloured according to sample (a) or graph-based clusters (C1–C8, b) (N = 1 experiment, n = 5,346 cells). c, Combined beeswarm and box plots of log-normalized gene expression values of pluripotency markers (KLF17, KLF4, NANOG and DPPA5) and early Epi markers (KLF3, PRAP1 and GDF15). The sample type is shown with single cells plotted as dots; minima and maxima of the box plots span the interquartile range (IQR) 75th percentile subtracted from the 25th percentile, the centre indicates the median, and the whiskers extend to values within 1.5 times the IQR (N = 1 biological replicate, nES cells n = 1.158, nES cells + dm-αKG n = 900, hiTS cells n = 1,577, hiTS cells + dm-αKG n = 1,711) d, The expression of selected lineage-specific marker genes across samples. The size of the dots represents the proportion of cells in the sample expressing the given gene, and the colour encodes the scaled average expression. e, Levels of expression of trophoblast marker genes (GATA3 and CDX2) as determined by RT-qPCR. The expression values were normalized to TBP and are presented as fold change relative to the untreated day 0 nES cells. Data are presented as the mean and data points of N = 3 biological replicates. f, A 2D UMAP visualization of integrated scRNA-seq data derived from human pre-implantation and post-implantation embryos with annotation from ref. . ICM, inner cell mass; Axial Mes, axial mesoderm; PriS, primitive streak; AdvMes, advanced mesoderm; ExE_Mes, extra-embryonic mesoderm; DE, definitive endoderm; YSE, yolk sac endoderm; HEP, hemato-endothelial progenitors; Erythrobl., erythroblasts; TE, trophectoderm; CTB, cytotrophoblast; STB, syncytiotrophoblast; EVT, extravillous trophoblast. g, In vivo reference data with in vitro day 3 hiTS cells, generated from control or dm-αKG-treated nES cells. The black dots show neighbourhoods of in vitro generated cells projected onto a reference UMAP. h, Imputed annotation of in vitro samples from reference in vivo dataset. Unassigned and ambiguous labels refer to cells with either none or with more than two imputed annotations, respectively. P values were calculated by Kruskal–Wallis tests (e) with Bonferroni correction. Source data
Fig. 3
Fig. 3. Metabolically induced hypoacetylation increases nES cell competence towards TE.
a, A schematic of nES cell treatment with dm-αKG for 24 h. b, A heat map showing log2 fold change (FC) in normalized ion counts between 4 mM and 0 mM dm-αKG samples. FC was computed on the basis of the average across 0 mM samples. 2-HG, 2-hydroxyglutarate. N = 3 biological replicates. c, Ion counts of acetyl-CoA measured by liquid chromatography–mass spectrometry normalized to protein content (the bar shows the mean). N = 3 biological replicates. d, Global histone PTM levels quantified by mass spectrometry. N = 4 biological replicates. e, Mass spectrometry quantification of newly deposited histone acetylation using U-13C-glucose labelling. The scale shows the percentage of 13C-labelled acetyl-peptides relative to unlabelled 12C acetyl-peptides. NC, negative control or no treatment. N = 3 biological replicates. f, A schematic of hiTS cell induction with 24 h of P300i (A-485) treatment. g,h, Effects of P300 inhibition on expression levels measured by RT-qPCR. The data are normalized to TBP and presented as fold change to untreated control for nES cells (g) and day 3 hiTS cells (h). Shown are markers of the trophoblast (GATA3 and CDX2), pluripotent cells (KLF17 and OCT4), primitive streak (TBXT) and extra-embryonic mesoderm (VIM). Data are presented as the mean and data points of N = 3 biological replicates. i, Enrichment plots of gene sets defined by genes significantly upregulated (left) or downregulated (right) in day 3 hiTS cells upon dm-αKG pretreatment. Along the x axis, genes are ranked by Wald statistic (from positive to negative) from DESeq2 for P300i (A-485) pretreatment compared with untreated control. Vertical lines indicate where the members of the gene set appear in the ranked list of genes. The curve shows the running enrichment score (ES), and it peaks at the ES for the given gene set. NES, normalized enrichment score. P values were calculated by two-sided unpaired t-tests (bd), one-way Kruskal–Wallis tests with Bonferroni correction (g and h) or two-sided fast pre-ranked gene set enrichment analysis (FGSEA) with Benjamini–Hochberg correction (i). Created with BioRender.com (a). Source data
Fig. 4
Fig. 4. Increased αKG levels aid in polarization.
a, A schematic of aggregate formation with 40 h dm-αKG treatment. b, Representative brightfield images of 40 h aggregates with or without dm-αKG treatment. Scale bars, 200 μm. N = 3 biological replicates. c, Representative IF images and analysis of a polarity marker aPKCζ in 40 h aggregates with or without dm-αKG treatment. IF quantification shows aPKCζ intensity within the apical domain normalized to the signal in the remaining part of the aggregate. Each dot represents one aggregate, n = 39–40 from N = 2 biological replicates; the line is the median. Scale bars, 50 μm. d, Representative IF images and analysis of YAP and TAZ in 40 h aggregates with or without dm-αKG treatment. Nuclear YAP and TAZ intensity is quantified in the outer and inner cells. The box plots show: centre line, median; box limits, 25th and 75th percentiles; whiskers, 1.5× interquartile range; outliers not shown. Scale bars, 50 μm. N = 2 biological replicates, EXP1 0 mM outer nuclei n = 363, EXP1 0 mM inner nuclei n = 316, EXP1 4 mM outer nuclei n = 580, EXP1 4 mM inner nuclei n = 256, EXP2 0 mM outer nuclei n = 480, EXP2 0 mM inner nuclei n = 214, EXP2 4 mM outer nuclei n = 477, EXP2 4 mM inner nuclei n = 216, minimum 18 aggregates quantified per experiment. e, UMAP plots from scRNA-seq analysis of samples collected as in Fig. 4a. Cells are coloured according to sample (N = 1 experiment, minimum 100 aggregates, n = 2,255 cells). f, Violin plots showing log-normalized expression of core and naive pluripotency markers in 40 h aggregates with or without dm-αKG treatment. g, Integration of in vivo reference data (Fig. 2f) with in vitro 40 h control or dm-αKG-treated aggregates. The black dots show neighbourhoods of in vitro generated cells projected onto a reference UMAP. ICM, inner cell mass; Axial Mes, axial mesoderm; PriS, primitive streak; AdvMes, advanced mesoderm; ExE_Mes, extra-embryonic mesoderm; DE, definitive endoderm; YSE, yolk sac endoderm; HEP, hemato-endothelial progenitors; Erythrobl., erythroblasts; TE, trophectoderm; CTB, cytotrophoblast; STB, syncytiotrophoblast; EVT, extravillous trophoblast. h, Imputed annotation of in vitro samples from reference in vivo dataset. Unassigned and ambiguous labels refer to cells with either none or with more than two imputed annotations, respectively. Created with BioRender.com (a). Source data
Fig. 5
Fig. 5. dm-αKG facilitates blastoid induction.
a, A schematic of the blastoid induction protocol with 40 h and 120 h dm-αKG treatment. b, Representative brightfield images of day 5 blastoids untreated or treated for 40 h or 120 h with 4 mM dm-αKG. Scale bars, 200 μm. c, Quantification of blastoid diameter (left) and induction efficiency according to cavitation (right). Data are based on brightfield images of day 5 blastoids untreated or treated for 40 h or 120 h with 4 mM dm-αKG. Left: data are presented as violin plots with the median and 25th and 75 percentiles (±min–max) of N = 3 biological replicates, n = 737 (0 mM), 686 (4 mM, 40 h), 673 (4 mM, 120 h) blastoids. Right: data are presented as the mean and data points of N = 3 biological replicates. d, Representative IF images of 120 h blastoids with or without dm-αKG treatment (40 h or 120 h). Blastoids were stained for GATA3 (cyan) and NANOG (red). Shown is the maximum projection. Scale bars, 50 μm. N = 3 biological replicates. P values were calculated by one-way ANOVA tests with Bonferroni correction (c). Created with BioRender.com (a). Source data
Fig. 6
Fig. 6. dm-αKG facilitates TE maturation during blastoid induction.
a, UMAP plots from scRNA-seq analysis of samples treated for 40 h with 0 mM or 4 mM dm-αKG as in Fig. 5a. Cells are coloured according to sample (2 experiments, minimum 500 blastoids, n = 10,392 cells). The dotted box highlights TE-like cells. b, The expression of selected lineage-specific marker genes across samples further separated on the basis of Epi and TE signature. The size of the dots represents the proportion of cells in the indicated group expressing the given gene, and the colour encodes the scaled average expression. c, Magnification of UMAP (from a) focusing on TE-like cells. d, Combined beeswarm and box plots of log-normalized gene expression values of mature polar TE markers (pTE: NR2F2, CCKBR and PTN) and mural TE markers (mTE: ALPG, CITED4 and TUBB4A). The sample type is shown with single cells plotted as dots; boxes span the interquartile range (IQR), the centre line indicates the median, and the whiskers extend to values within 1.5 times the IQR. e, UMAP as in c where the colour code depicts the enrichment of 25 pTE over 25 mTE marker signature. f, A violin plot showing the pTE–mTE signature as in e but separated by sample. The black dots are individual cells from 2 experiments and a minimum of 500 blastoids. g, The distribution of pseudotime values in blastoid cells, which are related to the in vivo TE. TE pseudotime trajectories were identified from in vivo reference (Extended Data Fig. 4e). P values were calculated by two-sided Wilcoxon rank-sum test (f). Source data
Extended Data Fig. 1
Extended Data Fig. 1. Metabolic asymmetry between nESC and hiTSC regulates trophoblast induction.
a, Ion counts of metabolites measured by GC-MS normalised to protein content. nESC, naive embryonic stem cells; hiTSC, human induced trophoblast stem cells. b, Heatmap of Log2 fold change in the expression of key metabolic enzymes between in vivo TE and Epiblast. Median expression values were extracted from ref. . *IDH2 fold change is out of range and is 6.28. c-d, Expression levels of GATA3, OCT4 and TBXT in d3 hiTSC measured by RT-qPCR. The expression values were normalised to TBP and presented as fold change relative to the untreated d3 hiTSC. Shown are samples with dm-αKG treatment for 96 h (c) or 24 h (d). e, Expression levels of CDX2, GATA3, KLF17, OCT4, VIM and TBXT, in HNES1 cells determined by RT-qPCR. The expression values were normalised to TBP and presented as fold change relative to the untreated d3 hiTSC. HNES1 were treated with dm-αKG for 96 h (red panels) or 24 h (yellow panels). Data is presented as the mean and data points of N = 3 biological replicates. P values were calculated by two-sided unpaired t-tests (a) or by Kruskal–Wallis test with Bonferroni correction (c-e). Source data
Extended Data Fig. 2
Extended Data Fig. 2. Dm-αKG treated nESC give rise to stable hiTSC line but have reduced competence towards primitive endoderm.
a, Brightfield images of hiTSC stable cell lines ( > passage 5) derived from tt2iLGö nESC with or without 24 h 4mM dm-αKG pre-treatment. Scale bar = 200 μm. b, Expression levels of CDX2, GATA3, KLF17 and OCT4, determined by RT-qPCR. The expression values were normalised to TBP. N = 1. c, Schematic of nEnd induction with 24h dm-αKG pre-treatment. d, Top panel: representative IF images of GATA4 and GATA6 at d3 of nEnd induction, treated for 24 h with 0, 2 or 4 mM of dm-αKG. Bottom panel: IF quantification. e, Expression levels of GATA4, GATA6 and PDGFRα, determined by RT-qPCR. The expression values were normalised to TBP and presented as fold change relative to the untreated d3 nEnd. Data is presented as the mean and data points of N = 3 biological replicates (d and e). P values were calculated by ordinary one-way ANOVA tests (d) or Kruskal–Wallis tests with Bonferroni correction (e). Scale bar = 100 μm. (c) Created with BioRender.com. Source data
Extended Data Fig. 3
Extended Data Fig. 3. Metabolic rewiring by dm-αKG alters the competence of nESC towards the TE fate.
a, Bar charts showing the percentage of cells from different Seurat clusters in each sample (left); and how samples contribute to Seurat clusters (right). b, Gene set enrichment analysis for differentially expressed genes between Seurat cluster C1 and C2. Shown are some significantly enriched Reactome terms. Normalised enrichment score is positive when terms are enriched in genes upregulated in C2 vs C1. c, Expression of selected lineage-specific marker genes across Seurat clusters separated according to sample type. Combinations of clusters and samples containing less than 20 cells are not shown. Dot size represents the proportion of cells in which the gene was detected, and colour indicates scaled average expression. d, Expression of selected lineage-specific marker genes across samples related to Fig. 2d. The size of the circles represents the proportion of cells in the sample with the indicated gene expression level. e, Pseudotime plots showing expression dynamics of putative early epiblast/ICM markers (KLF3, PRAP1, GDF15) also upregulated within Seurat cluster C2. Data was extracted from ref. . ICM: inner cell mass; EPI: epiblast; PrE: primitive endoderm; TE: trophectoderm; B1/B2: early blastocyst at B1/B2 stage. Source data
Extended Data Fig. 4
Extended Data Fig. 4. Metabolic rewiring by dm-αKG allows for efficient TE-like cell induction.
a, UMAP of human pre-implantation and post-implantation embryos with annotation for scRNA-seq data integration from ref. with cells coloured by reference dataset of origin. b-c, Projection of in vivo reference data with in vitro d0 nESC or d3 hiTSC, control or pre-treated with dm-αKG for 24 h. Black dots show neighbourhoods of in vitro generated cells projected onto a reference UMAP. Colour code represents different annotations (b – as in Fig. 2g) or developmental time (c). d, Imputed developmental time of in vitro samples from reference in vivo dataset. E: embryonic day, CS: Carnegie Stage. Unassigned and ambiguous labels refer to cells with either none or with more than two imputed stages respectively. e, Reference pseudotime trajectories of the in vivo epiblast (EPI: left) and trophectoderm (TE: right) related to the reference developmental time based on ref. . f-g, Distribution of pseudotime values in nESC (f) and d3 hiTSC (g) cells which are related to the in vivo EPI and TE respectively. Pseudotime trajectories were identified from in vivo reference (e). Source data
Extended Data Fig. 5
Extended Data Fig. 5. Treatment of nESC by dm-αKG leads to histone hypoacetylation.
a, Cell number quantification of nESC treated with 0 or 4 mM of dm-αKG. Data is presented as the mean and data points of N = 3 biological replicates. 1.6 ×10⁴ cells per cm2 were seeded in a 6-well plate pre-coated with ECMatrix™-511 Silk E8 Laminin Substrate. nESC were cultured for 48 h before treatment with 0 or 4 mM of dm-αKG for 24 h. Two 6-well wells were collected per condition for each biological replicate. b, Left panel: representative IF images of Phospho-Histone H3-Ser10 (pH3S10) in nESC treated with 0 or 4 mM of dm-αKG for 24 h. Right panel: IF quantification showing the percentage of pH3Ser10+ve cells. Data is presented as the mean and data points of N = 3 biological replicates. Scale bar = 100 μm. c, Expression levels of GATA3, KLF17, OCT4 and TBXT, in d3 hiTSC determined by RT-qPCR. The expression values were normalised to TBP and presented as fold change relative to the untreated d3 hiTSC. Naive ESC were treated with either 4mM dm-αKG or 1 µM UNC1999 for 24 h prior to being induced without treatment towards hiTSC. Data is presented as the mean and data points of N = 3 biological replicates. d, Left panel: representative IF images of H3K27ac at d0 in nESC treated with 0 or 4 mM of dm-αKG. Right panel: IF quantification showing H3K27ac intensity normalised to DAPI. N = 1 biological replicate, nESC n = 391, nESC + 4mM dm-αKG n = 468. Box plot shows: center line: median; box minima and maxima: 25th and 75th percentiles; whiskers: 1.5x interquartile range, 75th percentiles subtracted from 25th percentiles. Scale bar = 50 μm. e, Left panel: representative IF images of P300 at d0 in nESC treated with 0 or 4 mM of dm-αKG. Right panel: IF quantification showing P300 intensity normalised to DAPI. N = 3 biological replicates. Scale bar = 100 μm. f. Experimental set-up of U-13C-Glucose labelling in nESC treated with 0 or 4 mM of dm-αKG or 1 mM A-485. P values were calculated by Kruskal–Wallis test with Bonferroni correction (c) or two-sided unpaired t-test (a, b, e). (f) Created with BioRender.com. Source data
Extended Data Fig. 6
Extended Data Fig. 6. Treatment of nESC by dm-αKG alters enhancer usage.
a, Differential peak enrichment analysis of ATAC-seq (N = 3 replicates). Peaks enriched in control and dm-αKG treated nESC are highlighted in blue and red respectively; the number of differentially enriched peaks in both conditions are indicated. Dashed lines indicate adjusted p-value < 0.01 and |Log2(FC) | > 1. b, Genome browser tracks displaying ATAC-seq signal across loci that are more (GDF15, GATA2) or less (KLF17, KLF4) accessible upon dm-αKG treatment of nESCs. Signals from control and dm-αKG-treated nESCs are shown in blue and red, respectively. Gray boxes highlight peaks with altered accessibility. c, GREAT gene set enrichment analysis of differentially enriched peaks is shown with fold enrichment plotted as dot size and adjusted p-value in colour scale. Peaks enriched in nESC + dm-αKG and in nESC compared to all peaks are shown. d, Transcription factor motif enrichment analysis on differentially enriched peaks is plotted. Dot colour represents enrichment relative to all peaks and dot size is -log10p-value. Motifs were grouped based on similarity and only one TF per related motif is shown. e, Left panel: representative IF images of YAP/TAZ at d0 in nESC treated with 0 or 4 mM of dm-αKG. Right panel: IF quantification showing YAP/TAZ intensity normalised to DAPI. N = 3 biological replicates. Scale bar = 20 μm. f, Enrichment plots of gene sets defined by genes significantly upregulated (top) or downregulated (bottom) in nESC upon 24h dm-αKG treatment. Along the x-axis genes are ranked by Wald statistic (from positive to negative) from DESeq2 for P300i (A-485) pre-treatment compared to untreated control. Vertical lines indicate where the members of the gene set appear in the ranked list of genes. The curve shows the running enrichment score (ES) and it peaks at the ES for the given gene set. P values were calculated by two-sided unpaired t-test (e) or two-sided FGSEA with Benjamini-Hochberg correction (f). Source data
Extended Data Fig. 7
Extended Data Fig. 7. Treatment of 40 h aggregates with dm-αKG leads to improved apical polarisation.
a, Left panel: UMAP plots from scRNA-seq analysis of samples collected as in Fig. 4a. Cells are coloured according to graph-based clusters (C1-C7)(n = 2255). Right panel: Bar charts showing the percentage of cells from different Seurat clusters in each sample. b, Venn diagrams showing the overlap between genes significantly downregulated (left) and upregulated (right) upon 4mM dm-αKG treatment in nESC (24 h) and aggregates (40 h). Shown are all genes differentially expressed genes with adj. p-val<0.05 from scRNA-seq experiments. Fisher’s exact test for both comparisons is p-val < 2.2e-16. c, Gene set enrichment analysis for differentially expressed genes between 40 h aggregate samples: 4 mM vs 0mM dm-αKG. Shown are most significantly enriched Hallmark terms. Normalised enrichment score is positive when terms are enriched in genes upregulated in 4 mM vs 0 mM. d, Left panel: representative IF images of Phospho-Histone H3-Ser10 (pH3S10) in 40 h aggregates treated with 0 or 4 mM of dm-αKG. Right panel: IF quantification showing the percentage of pH3Ser10+ve cells. Data is presented as the mean and data points of N = 2 biological replicates. Scale bar = 100 μm. e, Left panel: representative IF images of H3K27ac in 40 h aggregates treated with 0 or 4 mM of dm-αKG. Right panel: IF quantification showing H3K27ac intensity normalised to DAPI within the inner and outer layers of nuclei. N = 3 biological replicates, 40 h aggregates inner nuclei n = 863, 40 h aggregates outer nuclei n = 951, 40 h aggregates + 4mM dm-αKG inner nuclei n = 749, 40 h aggregates + 4mM dm-αKG outer nuclei n = 747. Box plot shows: center line: median; box minima and maxima: 25th and 75th percentiles; whiskers: 1.5x interquartile range, 75th percentiles subtracted from 25th percentiles. Scale bar = 100 μm. P values were calculated by two-sided Wilcoxon rank sum test. f, Expression of selected lineage-specific marker genes across samples related to Fig. 4f. The size of the circles represents the proportion of cells in the cluster for which expression of the gene is detected and colour encodes the scaled average expression. g, Distribution of pseudotime values in aggregate cells which are related to the in vivo epiblast (EPI). EPI pseudotime trajectories were identified from in vivo reference (Extended Data Fig. 4e). Source data
Extended Data Fig. 8
Extended Data Fig. 8. 40h dm-αKG treatment of aggregates leads to improved blastoid development.
a, Quantification of cavitated blastoid structures with singly cavity or multiple cavities. Data shows the mean percentages and data points of N = 3 biological replicates. b, UMAP plot from scRNA-seq analysis of samples collected as in Fig. 5a. Cells are coloured according to graph-based clusters (C1-C7)(n = 10392). c, Bar charts showing the percentage of cells from different Seurat clusters in each sample (left); and how samples contribute to Seurat clusters (right). d, Expression of selected lineage-specific marker genes across samples related to Fig. 6b. The size of the circles represents the proportion of cells in the indicated class for which expression of the gene is detected and colour encodes the scaled average expression. e, Integration of in vivo reference data (Fig. 2f) with in vitro d5 blastoids generated with 40 h 0 mM or 4mM dm-αKG treatment. Black dots show neighbourhoods of in vitro generated cells projected onto a reference UMAP. f-g, Imputed annotation of in vitro samples from reference in vivo dataset. Unassigned and ambiguous labels refer to cells with either none or with more than two imputed annotations respectively. Shown are cells from individual samples separated based on their EPI/TE-like marker gene expression as in Fig. 6a (f) or biological replicate (g). h, Distribution of pseudotime values in blastoid cells which are related to the in vivo epiblast (EPI). EPI pseudotime trajectories were identified from in vivo reference (Extended Data Fig. 4e). Source data
Extended Data Fig. 9
Extended Data Fig. 9. 40h dm-αKG treatment of blastoids leads to improved attachment and trophoblast lineage differentiation.
a, Schematic of blastoid attachment assays in IVC1-2 medium on IbiTreat µ-plates. b, Quantification of attachment efficiency 24 h after plating blastoids, treated with 40 h 0 mM or 4mM dm-αKG. Data shows the mean attachment percentages and data points of N = 7 biological replicates, n = 560. c, Left panel: representative IF images of NANOG, GATA3 and GATA6 in blastoids treated for 40 h with 0 or 4 mM of dm-αKG at d4 of attachment. White arrows indicate GATA6 single positive cells. Scale bar = 100 μm. Right panel: IF quantification. Data shows the mean percentages of structures with all 3 lineages (NANOG, GATA3 and GATA6) and data points of N = 4 biological replicates, n = 181. d, Schematic of blastoid attachment assays in N2B27 + E2 medium on IbiTreat µ-plates coated with ECM. e, Representative brightfield images of blastoids with or without 40 h 4mM dm-αKG treatment at d4 and d5 post attachment. Black arrows indicate extravillous trophoblast-like cells. Scale bar = 160 μm. f, Quantification of size (diameter) of blastoids treated for 40 h with 0 or 4 mM of dm-αKG at d4 and d5 of attachment. N = 4, n = 142 structures. Violin plot shows: center line: median; bottom and upper line: 25th and 75th percentiles. g, Representative IF images of DAPI, hCGB and HLA-G in blastoids treated for 40 h with 0 or 4 mM of dm-αKG at d7 of attachment. Scale bar = 100 μm. h, IF quantification of structures with syncytiotrophoblast- (SCT) and extravillous trophoblast- (EVT) like cells. Data shows the mean percentages of structures with hCGB or HLA-G positive cells and data points of N = 4 biological replicates, n = 115. P values were calculated by two-sided paired t-tests (c,h) or two-sided unpaired t-tests (b,f). Source data

Similar articles

References

    1. Anani, S., Bhat, S., Honma-Yamanaka, N., Krawchuk, D. & Yamanaka, Y. Initiation of Hippo signaling is linked to polarity rather than to cell position in the pre-implantation mouse embryo. Development141, 2813–2824 (2014). - PubMed
    1. Gerri, C. et al. A conserved role of the Hippo signalling pathway in initiation of the first lineage specification event across mammals. Development150, dev201112 (2023). - PMC - PubMed
    1. Negron-Perez, V. M. & Hansen, P. J. Role of yes-associated protein 1, angiomotin, and mitogen-activated kinase kinase 1/2 in development of the bovine blastocyst. Biol. Reprod.98, 170–183 (2018). - PMC - PubMed
    1. Niwa, H. et al. Interaction between Oct3/4 and Cdx2 determines trophectoderm differentiation. Cell123, 917–929 (2005). - PubMed
    1. Dattani, A., Huang, T., Liddle, C., Smith, A. & Guo, G. Suppression of YAP safeguards human naive pluripotency. Development149, dev200988 (2022). - PMC - PubMed

MeSH terms

LinkOut - more resources