. 2025 Jul;31(7):2350-2364.
doi: 10.1038/s41591-025-03647-1. Epub 2025 Apr 23.

CMV serostatus is associated with improved survival and delayed toxicity onset following anti-PD-1 checkpoint blockade

Affiliations

CMV serostatus is associated with improved survival and delayed toxicity onset following anti-PD-1 checkpoint blockade

Gusztav Milotay et al. Nat Med. 2025 Jul.

Abstract

Cytomegalovirus (CMV) is a globally endemic latent herpes virus that profoundly impacts T cell immunity. We investigated the oncological consequences of CMV infection across 341 prospectively recruited patients receiving immune checkpoint blockade (ICB) for melanoma. CMV+ patients with metastatic melanoma (MM) have higher lymphocyte counts, reduced neutrophil to lymphocyte ratio and divergent CD8+ T cell gene expression. Combination anti-CTLA-4/anti-PD-1 ICB, but not single-agent anti-PD-1 ICB, induces cytotoxicity and CMV-associated gene expression in CD8+ T cells from CMV- patients. Correspondingly, overall survival was independent of CMV serostatus in combination anti-CTLA-4/anti-PD-1 ICB recipients (CMV+ hazard ratio for death: 1.02, P = 0.92), whereas CMV+ single-agent anti-PD-1 ICB recipients had improved overall survival (CMV+ hazard ratio for death: 0.37, P < 0.01), a finding also seen in CMV+ adjuvant single-agent anti-PD-1 ICB recipients (CMV+ hazard ratio for recurrence: 0.19, P = 0.03). We identify TBX21, encoding T-bet, as a transcriptional driver of CMV-associated CD8+ T cell gene expression, finding that TBX21 expression is predictive of overall survival (hazard ratio: 0.62, P = 0.026). CMV+ patients unexpectedly show reduced cumulative incidence of grade 3+ immune-related adverse events at 6 months (0.30 versus 0.52, P = 2.2 × 10⁻⁵), with lower incidence of colitis (P = 7.8 × 10⁻⁴) and pneumonitis (P = 0.028), an effect replicated in non-melanoma ICB recipients (n = 58, P = 0.044). Finally, we find reduced CMV seropositivity rates in patients with MM compared with UK Biobank controls (odds ratio: 0.52, P = 1.8 × 10⁻⁴), indicating CMV seropositivity may protect against MM. Specifically, patients with BRAF-mutated MM are less likely to be CMV+ (odds ratio = 2.2, P = 0.0054), while CMV- patients present 9 yr earlier with BRAF wild-type MM (P = 1.3 × 10⁻⁴). This work reveals an interaction between CMV infection, MM development according to BRAF status and response to ICB, while demonstrating CMV infection is protective against severe ICB immune-related adverse events, highlighting the potential importance of previous infection history and chronic immune activation in MM development and immunotherapy outcomes.


Conflict of interest statement

Competing interests: In the last 3 years, B.P.F. has performed consultancy for NICE Consultancy, Roche, Pathios, UCB and TCypher and has been given speaker fees by GSK, UCB and BMS, all outside the submitted work. M.R.M. reports grants from Roche, grants from Astrazeneca, grants from GSK, expenses from Novartis, grants and expenses from Immunocore, expenses from BMS, expenses from Pfizer, expenses from Merck/MSD, expenses from Regeneron, expenses from BiolineRx, expenses from Replimune and grants from GRAIL, all outside the submitted work. The other authors declare no competing interests.

Figures

Fig. 1
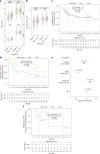
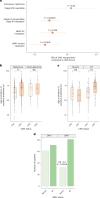
Fig. 1. Baseline hematological and immunological associations of CMV infection in patients with melanoma.
a, Pretreatment lymphocyte count is elevated in CMV+ patients with MM (n = 124 CMV, n = 105 CMV+; P = 9.1 × 10−5; lower and upper box hinges represent the 25th to 75th percentiles, the central line represents the median and the whiskers extend to the highest and lowest values no greater than 1.5 × IQR). b, CMV pretreatment NLR is reduced in CMV+ patients (P = 0.0015; samples and boxplot as in a). c, Flow cytometry-derived pretreatment T cell subset proportions according to CMV serostatus for CD4+ T cells (n = 41 CMV, n = 33 CMV+; P = 0.0010 T naive, P = 7.3 × 10−4 TCM, P = 5.2 × 10−6 TEM, P = 6.6 × 10−9 TEMRA; boxplot as in a). d, CD8+ T cells (P = 1.8 × 10−6 T naive, P = 3.2 × 10−6 TCM, P = 0.068 TEM, P = 1.6 × 10−9 TEMRA; samples and boxplots as in c). e, Baseline pretreatment CD25+FOXP3+CD4+ T cells according to CMV serostatus (P = 7.6 × 10−4; samples and boxplots as in c). f, Differentially expressed genes (DEGs) according to CMV serostatus from pretreatment CD8+ T cells; y axis shows Benjamini–Hochberg-corrected −log10(Padj) derived from negative binomial Wald test using CMV samples as a reference (n = 111 CMV, n = 95 CMV+). g, Gene Ontology Biological Process (GOBP) analysis of DEGs from f, highlighting induction/suppression (orange and blue, respectively) of pathways involved in T cell activation in CMV seropositivity. All statistical tests were two-sided Wilcoxon rank sum unless otherwise stated. FC, fold-change; NS, not significant; TCM, central memory T cells. Source data
Fig. 2
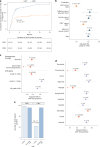
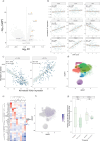
Fig. 2. CMV is associated with divergent CD8+ T cell transcriptomic and clinical response to ICB.
a, cICB treatment of CMV patients leads to a highly significant induction of CMV score (y axis) (top-left panel), not observed in CMV patients receiving sICB (bottom-left panel) (n = 79 CMV, n = 72 CMV+; P = 2.8 × 10−9 cICB CMV, P = 0.28 sICB CMV, P = 0.41 cICB CMV+, P = 0.54 sICB CMV+). P values derived from two-sided Wilcoxon signed-rank test; lower and upper box hinges represent the 25th to 75th percentiles, the central line represents the median and the whiskers extend to the highest and lowest values no greater than 1.5 × IQR. b, cICB treatment leads to a significant induction of cytotoxicity score irrespective of CMV status (n = 64 CMV P = 2.1 × 10−7, n = 44 CMV P = 0.0013). P values derived from two-sided Wilcoxon signed-rank test; boxplot as in a. c, Kaplan–Meier analysis shows no significant difference in OS of cICB-treated CMV+ and CMV patients (n = 113 CMV, n = 78 CMV+; P = 0.92, two-sided log-rank test). d, Kaplan–Meier analysis demonstrates increased OS of CMV+ versus seronegative sICB recipients (n = 30 CMV, n = 45 CMV+; P = 0.039, two-sided log-rank test). e, Cox proportional hazards model as per d shows significantly reduced adjusted HR for death in CMV+ recipients of sICB (HRadj = 0.37; 95% CI, 0.18 to 0.78; P = 0.0089, Wald test). Increased age is significantly associated with increased risk of death when controlling for CMV (HRadj = 1.07; 95% CI, 1.02 to 1.13; P = 0.0058, Wald test). f, Improved PFS in stage II/III resectable patients following sICB in CMV+ patients relative to CMV patients (n = 11 CMV, n = 17 CMV+; P = 0.030, two-sided log-rank test). Source data
Fig. 3
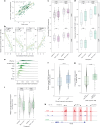
Fig. 3. CMV is associated with organ-specific irAE risk.
a, Cumulative incidence of developing grade 3+ irAEs in all ICB-treated patients with melanoma is significantly reduced in CMV seropositivity (n = 161 CMV, n = 147 CMV+; P = 2.2 × 10−5, two-sided log-rank test). b, Multivariable semi-competing risks analysis, where death is a semi-competing risk, indicates that CMV is protective against grade 3+ irAE development when adjusting for age, sex, treatment type, BRAF mutation status and treatment intent as covariates (HRadj = 0.60; 95% CI, 0.42 to 0.86; P = 0.0058, Wald test; patients as in a). c, Time-independent adjusted ORs for development of all grade, grade 3+ and grade 1–2 irAEs and requirement of steroid or second-line immunosuppression in CMV+ patients, adjusting for covariates as per b (binary logistic regression) (steroids: ORadj = 0.46; 95% CI, 0.27 to 0.77; P = 0.0032; second-line immunosuppressants: ORadj = 0.40; 95% CI, 0.20 to 0.77; P = 0.0076; grade 3+ irAEs: ORadj = 0.45; 95% CI, 0.27 to 0.74; P = 0.0020; patients as in a). d, Adjusted ORs for development of all grade organ-specific irAEs in CMV+ patients (binary logistic regression) adjusting for covariates as per b (colitis: ORadj = 0.39; 95% CI, 0.22 to 0.67; P = 7.8 × 10−4; pneumonitis: ORadj = 0.23; 95% CI, 0.060 to 0.76; P = 0.028; myalgia: ORadj = 0.15; 95% CI, 0.060 to 0.56; P = 0.0091; dermatitis: ORadj = 1.66; 95% CI, 1.02 to 2.7; P = 0.044; patients as in a). e, CMV+ cICB-treated patients are at significantly reduced odds of developing colitis (n = 115 CMV, n = 78 CMV+; two-sided Fisher’s exact test, OR = 2.7; 95% CI, 1.4 to 5.2; P = 0.0018). Source data
Fig. 4
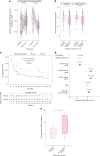
Fig. 4. CD8+ T cell signature of CMV infection is associated with TBX21 expression.
a, Normalized CD8+ TBX21 expression correlated with CMV score after one cycle of immunotherapy (n = 181, Spearman’s rank correlation test, ρ denotes the Spearman ρ and P value is from two-sided t-test). b, Baseline CD8+ subset correlations with TBX21 highlight that increased TBX21 expression is correlated with increased circulating TEMRA and decreased naive T cell proportions (n = 89, Spearman’s rank correlation test, ρ and P values defined as in a). c, In CMV patients, treatment with cICB (top-left panel) is associated with a significant induction of TBX21 (n = 64, P = 0.0033). This is not observed in CMV patients receiving sICB (bottom-left panel) where TBX21 is significantly downregulated (n = 15, P = 0.0026). In CMV+ patients no significant change in TBX21 expression is noted in either cICB recipients (top-right panel) (n = 44, P = 1) or sICB recipients (bottom-right panel) (n = 28, P = 0.94). All P values result from application of a two-sided Wilcoxon signed-rank test; lower and upper box hinges represent the 25th to 75th percentiles, the central line represents the median and the whiskers extend to the highest and lowest values no greater than 1.5 × IQR. d, Flow cytometry blinded to CMV and ICB type measuring the proportion of GZMB+ CD8+ T cells before and after one cycle of ICB, dichotomized by CMV status and ICB type (n = 18 CMV, n = 14 CMV+; cICB CMV: P = 0.0024, cICB CMV+: P = 0.12, sICB CMV: P = 0.84, sICB CMV+: P = 0.44). P values relate to a two-sided Wilcoxon signed-rank test; boxplots as in c. e, Imputed TBX21 expression by CD8+ subsets in sICB-treated patients as assessed using scRNA-seq (n = 16). f, Median imputed TBX21 expression by effector clone stratified by peripheral repertoire occupancy in posttreatment samples, demonstrating that TBX21 is a marker of clonal expansion (n = 17; P = 8.5 × 10−7, two-sided Wilcoxon rank sum test; boxplot as in c). g, Putative CMV-reactive effector cells have raised TBX21 relative to non-reactive cells at baseline (n = 16; P = 1.6 × 10−14, two-sided Wilcoxon rank sum test; boxplot as in c). h, ATAC-seq data indicate that TBX21 is significantly more accessible in murine CMV-reactive inflationary T cells (M38) relative to TCM and naive counterparts. The region with the maximum change in accessibility between M38 compared with TCM cells at the TBX21 locus was 3.8 log2FC, Padj = 3.8 × 10−17. i, TBX21 is induced in CMV nonreactive clones in CMV+ individuals (n = 7, P = 4.4 × 10−6), while a fall is observed in seronegative patients (n = 8, P = 3.0 × 10−8). P values were derived from two-sided Wilcoxon signed-rank tests; boxplots were as in c. DN, double-negative T cells; GD, gamma-delta T cells; MAIT, mucosal-associated invariant T cells; TRB, T cell receptor beta chain. Source data
Fig. 5
Fig. 5. Post-ICB TBX21 expression is associated with improved MM survival.
a, Median imputed TBX21 expression in effector clones from scRNA-seq data, stratified by disease control 3 yr after initiation of systemic treatment for metastatic disease, highlighting highly significant induction of TBX21 in patients who respond to treatment (n = 8, P = 6.2 × 10−11) while a significant downregulation is noted in patients who progress (n = 7, P < 2.2 × 10−16). P values from two-sided Wilcoxon signed-rank test; lower and upper box hinges represent the 25th to 75th percentiles, the central line represents the median and the whiskers extend to the highest and lowest values no greater than 1.5 × IQR. b, Bulk CD8+ TBX21 according to disease control at 3 yr after initiation of systemic treatment (baseline: n = 211, P = 0.049; post-cycle 1: n = 163, P = 0.0080; two-sided Wilcoxon rank sum test; boxplots as in a). c, Kaplan–Meier analysis demonstrates significantly improved PFS in patients with above median TBX21 after one cycle of immunotherapy (n = 181, P = 0.0051, two-sided log-rank test). d, Cox proportional hazards model indicates that increased posttreatment TBX21 is associated with improved OS when adjusting for ICB type, age, sex, BRAF mutation status and CMV status (HRadj = 0.61; 95% CI, 0.38 to 0.96; P = 0.035 derived from Wald test). Increased age is associated with increased risk of death when controlling for TBX21 (HRadj = 1.03; 95% CI, 1.00 to 1.05; P = 0.023, Wald test). e, Bulk RNA-seq from tumor samples, isolated from patients on sICB treatment, indicates that TBX21 is raised in patients with no progression compared with those who progress (n = 19 not progressive disease, n = 15 progressive disease; P = 0.036, two-sided Wilcoxon rank sum test; boxplots as in a). Source data
Fig. 6
Fig. 6. CMV interacts with MM epidemiology in a BRAF-mutation-dependent manner.
a, CMV seropositivity of patients with cutaneous MM and stage II/III (age 40–70) versus those rates within UKB in white British aged 40–70 (adjuvant melanoma: n = 21; OR = 1.2; 95% CI, 0.44 to 3.02; P = 0.83; MM: n = 150; OR = 0.52; 95% CI, 0.36 to 0.74; P = 1.8 × 10−4; BRAF-WT: n = 82; OR = 0.58; 95% CI, 0.36 to 0.94; P = 0.026; BRAF mutant: n = 66; OR = 0.44; 95% CI, 0.25 to 0.76; P = 0.0018). All ORs and P values were obtained from a two-sided Fisher’s exact test. b, Presentation with cutaneous MM occurs significantly later in patients seropositive for CMV (left panel, 64 yr CMV versus 71 yr CMV+, n = 252, P = 0.0014), while no significant difference is noted in other ICB-treated metastatic cancer (right panel, n = 53, P = 0.89). P values were derived from two-sided Wilcoxon rank sum tests; lower and upper box hinges represent the 25th to 75th percentiles, the central line represents the median and the whiskers extend to the highest and lowest values no greater than 1.5 × IQR. c, Relationship between age of presentation with MM and BRAF V600 mutation status according to CMV serostatus (left panel: BRAF V600 mutated, right panel: BRAF WT). There is no significant difference in age of presentation of BRAF-mutated patients according to CMV serostatus (n = 93, P = 0.33), whereas a highly significant effect is noted in patients with BRAF-WT MM (right panel, 65 yr CMV versus 74 yr CMV+, n = 152, P = 1.3 × 10−4, two-sided Wilcoxon signed-rank test; boxplots as in c). d, Breakdown of BRAF mutation status versus CMV serostatus across all patients with cutaneous MM in the cohort (OR = 2.2; 95% CI, 1.2 to 3.9; P = 0.0054, two-sided Fisher’s exact test). Source data
Extended Data Fig. 1
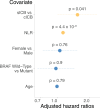
Extended Data Fig. 1. Increased neutrophil:lymphocyte ratio is negatively prognostic in metastatic melanoma.
Cox proportional hazards model of covariates including neutrophil:lymphocyte ratio and occurrence of death in patients with MM (n = 258, HRadj = 1.1, CI 1.08:1.2, P = 4.4 × 10⁻⁶, Wald test). Source data
Extended Data Fig. 2
Extended Data Fig. 2. Derivation of CMV score.
(a) ROC analysis of CMV seropositivity prediction using the first principal component of DEGs between baseline CD8+ samples based on CMV status. Area under the curve (y axis) is plotted against the Benjamini-Hochberg-corrected -log10(adjusted P value) threshold (x axis) used to determine genes to be incorporated in the score with the optimal threshold labelled. (b) CMV score of pre-treatment patient CD8+ T-cell samples according to CMV seropositivity (n = 111 CMV-, n = 95 CMV+, P < 2.2 × 10⁻¹⁶, two-sided Wilcoxon rank sum test); lower and upper box hinges represent the 25th to 75th percentiles, the central line represents the median and the whiskers extend to the highest and lowest values no greater than 1.5 × interquartile range. (c) Correlation of CMV score with number of CD8+ clones stratified by repertoire occupancy post one cycle of immunotherapy (n = 180, Spearman’s Rank Correlation test, rho denotes the Spearman rho, and P value is from two-sided t-test). (d) Cytotoxicity score is not induced following sICB, irrespective of CMV status (n = 43, CMV- P = 0.93, CMV + P = 0.58, two-sided Wilcoxon signed-rank test; boxplot as in (b)). Source data
Extended Data Fig. 3
Extended Data Fig. 3. Relationship between organ-specific toxicity development and HR for death.
(a) Cox proportional hazards analysis of irAEs by grade and by organ specificity demonstrates grade 1-2 irAEs and specifically dermatitis and arthritis bestow reduced risk of death in MM (n = 299, Dermatitis: HRadj = 0.60, CI 0.41:0.88, P = 0.0088; Arthritis: HRadj = 0.46, CI 0.22:0.96, P = 0.039; Wald test). (b) Cumulative incidence of grade 1-2 irAEs according to CMV status in melanoma (n = 161 CMV-, n = 147 CMV+; P = 0.99, two-sided log-rank test). (c) Cumulative incidence of grade 3+ irAEs is significantly lower in CMV+ patients once restricting to cICB treatment (n = 115 CMV-, n = 78 CMV+; P = 0.0061, two-sided log-rank test). Source data
Extended Data Fig. 4
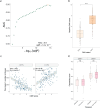
Extended Data Fig. 4. Association of TBX21 expression with clonality and cell subsets.
(a) Differential expression of transcription factors with altered activity in CMV seropositivity in baseline CD8+ samples, y-axis shows Benjamini-Hochberg-corrected -log10(Padj.) derived from negative binomial Wald test using CMV- samples as a reference (n = 111 CMV-, n = 95 CMV+). (b) Correlation of transcription factors with induced activity in CMV seropositivity with CMV score (n = 181, Spearman’s Rank Correlation test, rho denotes the Spearman rho, and P value is from two-sided t-test) post cycle 1. (c) TBX21 correlation with with number of CD8+ clones stratified by repertoire occupancy post one cycle of immunotherapy (n = 180, Spearman’s Rank Correlation test, rho and P value as defined in (b)). (d) UMAP plot of CD8+ T-cell subsets in single-cell RNA-seq data. (e) Differential expression of log-transformed cell subset marker genes in single-cell data. (f) Feature plot of TBX21 expression in single-cell data. (g) TBX21 expression dynamics in putative CMV-reactive effector clones in scRNA-seq data, stratified by CMV status (n = 7 CMV+: P = 0.34, n = 8 CMV-: P = 0.16; two-sided Wilcoxon signed-rank test; lower and upper box hinges represent the 25th to 75th percentiles, the central line represents the median and the whiskers extend to the highest and lowest values no greater than 1.5 × interquartile range). Source data
Extended Data Fig. 5
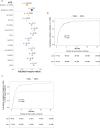
Extended Data Fig. 5. TBX21 expression is associated with survival metrics.
(a) Kaplan Meier analysis demonstrates significantly improved in OS in patients with above median TBX21 post one cycle of immunotherapy (n = 181, P = 0.026, two-sided log-rank test). (b) Cox proportional hazards model indicates that increased post-treatment TBX21 is associated with improved PFS when adjusting for ICB type, age, sex, BRAF mutational status and CMV status (n = 181, HRadj = 0.66, CI 0.45:0.98, P = 0.039, Wald test). Source data
Extended Data Fig. 6
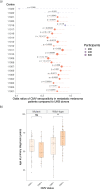
Extended Data Fig. 6. Relative CMV seropositivity across UKB recruitment centres and association with age at diagnosis of primary.
(a) Relative depletion of CMV+ individuals in MM cohort versus UKB data according to recruitment centre (n = 150): all ORs and P values were obtained from a two-sided Fisher’s exact test. (b) Age of diagnosis of primary cutaneous melanoma by CMV serotype and BRAF status (CMV serology determined at onset of systemic treatment for metastatic disease), (n = 204, PMutant = 0.25, PWild-type = 0.0019, two-sided Wilcoxon rank sum test; lower and upper box hinges represent the 25th to 75th percentiles, the central line represents the median and the whiskers extend to the highest and lowest values no greater than 1.5 × interquartile range). Source data

References

    1. Simoni, Y. et al. Bystander CD8+ T cells are abundant and phenotypically distinct in human tumour infiltrates. Nature557, 575–579 (2018). - PubMed
    1. Scheper, W. et al. Low and variable tumor reactivity of the intratumoral TCR repertoire in human cancers. Nat. Med.25, 89–94 (2019). - PubMed
    1. Rosato, P. C. et al. Virus-specific memory T cells populate tumors and can be repurposed for tumor immunotherapy. Nat. Commun.10, 567 (2019). - PMC - PubMed
    1. Wu, T. D. et al. Peripheral T cell expansion predicts tumour infiltration and clinical response. Nature579, 274–278 (2020). - PubMed
    1. Lucibello, F. et al. Divergent local and systemic antitumor response in primary uveal melanomas. J. Exp. Med.221, e20232094 (2024). - PMC - PubMed

MeSH terms