

Elucidating predictors of preoperative acute heart failure in older people with hip fractures through machine learning and SHAP analysis: a retrospective cohort study
- PMID: 40269712
- PMCID: PMC12016091
- DOI: 10.1186/s12877-025-05920-x
Elucidating predictors of preoperative acute heart failure in older people with hip fractures through machine learning and SHAP analysis: a retrospective cohort study
Abstract
Background: Acute heart failure (AHF) has become a significant challenge in older people with hip fractures. Timely identification and assessment of preoperative AHF have become key factors in reducing surgical risks and improving outcomes.
Objective: This study aims to precisely predict the risk of AHF in older people with hip fractures before surgery through machine learning techniques and SHapley Additive exPlanations (SHAP), providing a scientific basis for clinicians to optimize patient management strategies and reduce adverse events.
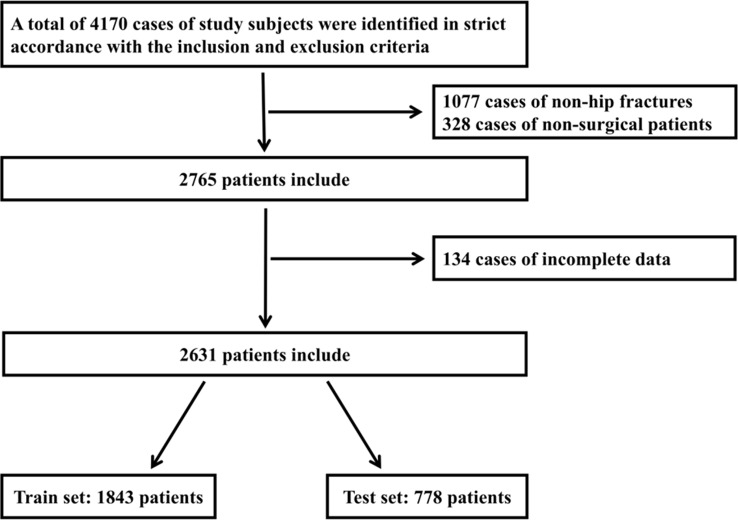
Methods: A retrospective study design was employed, selecting patients admitted for hip surgery in the Department of Geriatric Orthopedics at the Third Hospital of Hebei Medical University from January 2018 to December 2022 as research subjects. Data were analyzed using logistic regression, random forests, support vector machines, AdaBoost, XGBoost, and GBM machine learning methods combined with SHAP analysis to interpret relevant factors and assess the risk of AHF.
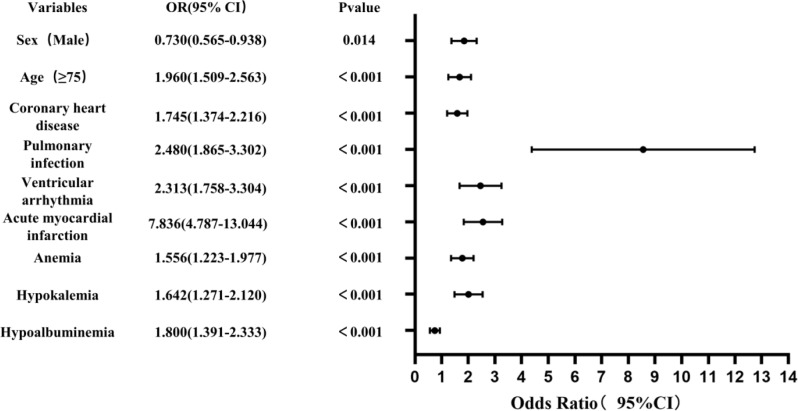
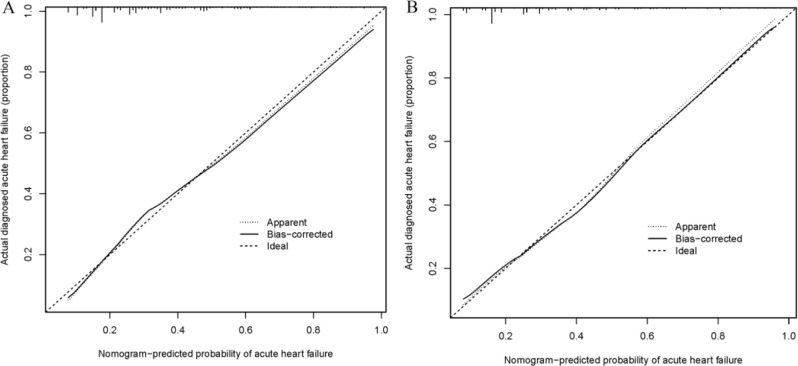
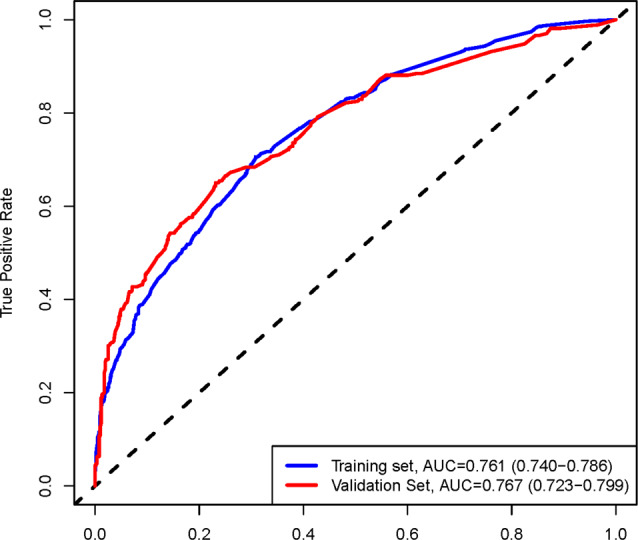
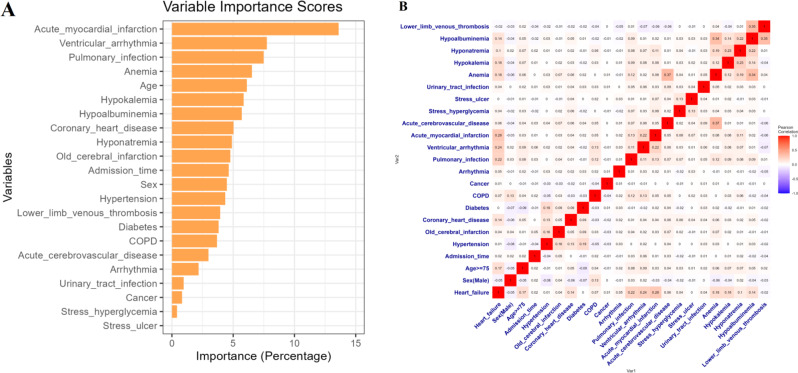
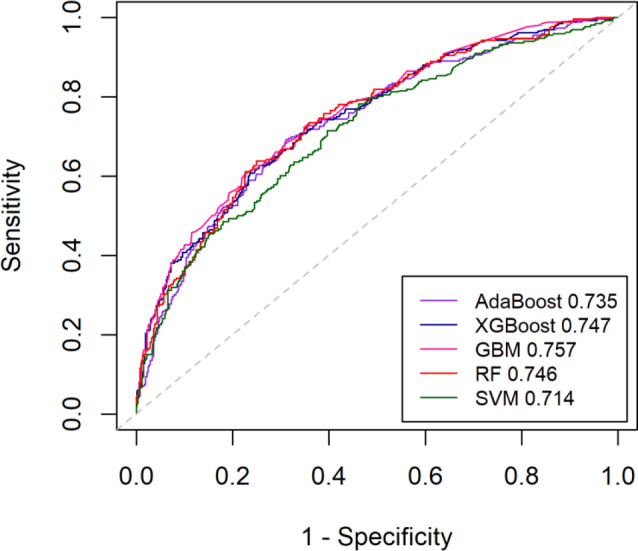
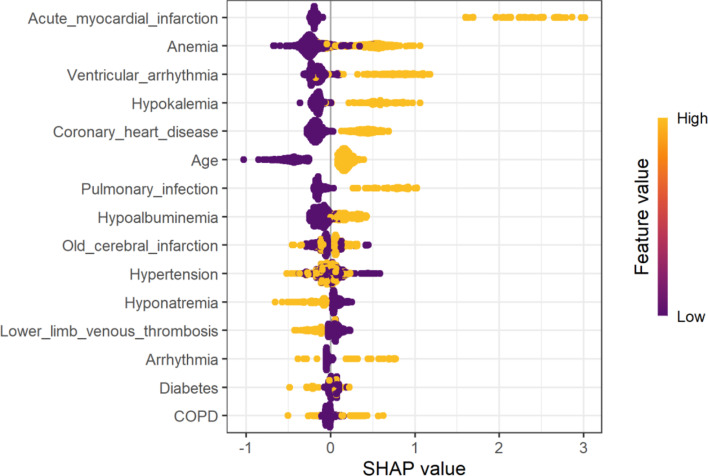
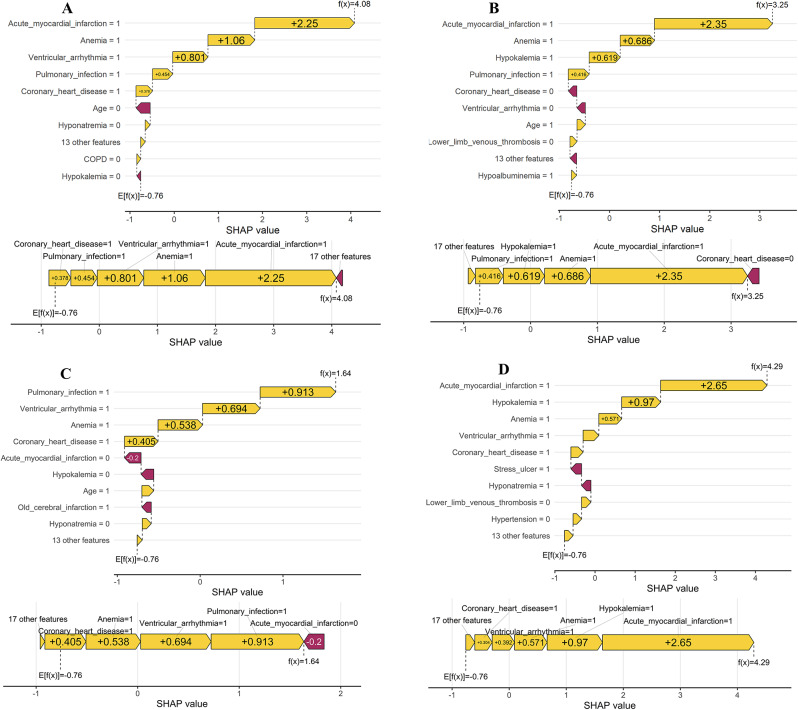
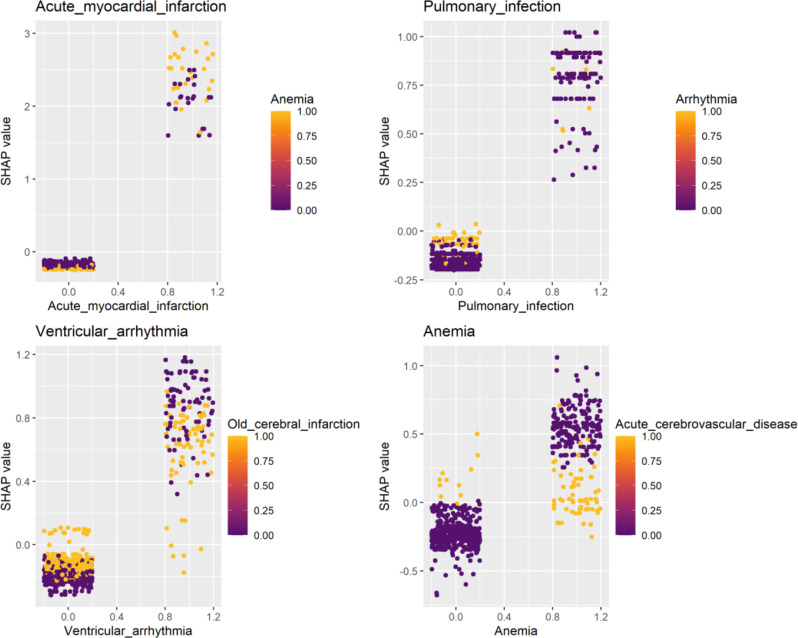
Results: A total of 2,631 patients were included in the final cohort, with an average age of 79.3 ± 7.7. 33.7% of patients experienced AHF before surgery. A predictive model for preoperative AHF in older people hip fracture patients was established through multivariate logistics regression: Logit(P) = -2.262-0.315 × Sex + 0.673 × Age + 0.556 × Coronary heart disease + 0.908 × Pulmonary infection + 0.839 × Ventricular arrhythmia + 2.058 × Acute myocardial infarction + 0.442 × Anemia + 0.496 × Hypokalemia + 0.588 × Hypoalbuminemia, with a model nomogram established and an AUC of 0.767 (0.723-0.799). Predictive models were also established using five machine learning methods, with GBM performing optimally, achieving an AUC of 0.757 (0.721-0.792). SHAP analysis revealed the importance of all variables, identifying acute myocardial infarction as the most critical predictor and further explaining the interactions between significant variables.
Conclusion: This study successfully developed a predictive model based on machine learning that accurately predicts the risk of AHF in older people with hip fractures before surgery. The application of SHAP enhanced the model's interpretability, providing a powerful tool for clinicians to identify high-risk patients and take appropriate preventive and therapeutic measures in preoperative management.
Keywords: Heart failure; Hip fracture; Machine learning; Prediction model; Preoperative; SHAP.
© 2025. The Author(s).
Conflict of interest statement
Declarations. Ethics approval and consent to participate: The ethical review board of the Third Hospital of Hebei Medical University evaluated and sanctioned this research protocol, ensuring adherence to the Helsinki Declaration. The approval was granted under the reference number 2021–087 − 1. Due to the retrospective nature of data gathering in this study, the board also provided a waiver for informed consent. Prior to analysis, all patient data were anonymized to protect privacy. Consent for publication: Not applicable. Competing interests: The authors declare no competing interests.
Figures


Similar articles
-
Predictive modeling of preoperative acute heart failure in older adults with hypertension: a dual perspective of SHAP values and interaction analysis.BMC Med Inform Decis Mak. 2024 Nov 6;24(1):329. doi: 10.1186/s12911-024-02734-6. BMC Med Inform Decis Mak. 2024. PMID: 39506761 Free PMC article.
-
Comparing machine learning models for predicting preoperative DVT incidence in elderly hypertensive patients with hip fractures: a retrospective analysis.Sci Rep. 2025 Apr 16;15(1):13206. doi: 10.1038/s41598-025-97880-w. Sci Rep. 2025. PMID: 40240511 Free PMC article.
-
Predictive characteristics and model development for acute heart failure preceding hip fracture surgery in elderly hypertensive patients: a retrospective machine learning approach.BMC Geriatr. 2024 Mar 28;24(1):296. doi: 10.1186/s12877-024-04892-8. BMC Geriatr. 2024. PMID: 38549043 Free PMC article.
-
Developing a prediction model for preoperative acute heart failure in elderly hip fracture patients: a retrospective analysis.BMC Musculoskelet Disord. 2024 Sep 14;25(1):736. doi: 10.1186/s12891-024-07843-x. BMC Musculoskelet Disord. 2024. PMID: 39277727 Free PMC article.
-
Establishment and validation of clinical prediction model and prognosis of perioperative pneumonia in elderly patients with hip fracture complicated with preoperative acute heart failure.BMC Surg. 2024 Nov 20;24(1):369. doi: 10.1186/s12893-024-02668-w. BMC Surg. 2024. PMID: 39567977 Free PMC article.
References
-
- Gullberg B, Johnell O, Kanis JA. World-wide projections for hip fracture. Osteoporos INT. 1997;7(5):407–13. - PubMed
-
- Boddaert J, Raux M, Khiami F, Riou B. Perioperative management of elderly patients with hip fracture. Anesthesiology. 2014;121(6):1336–41. - PubMed
-
- Duceppe E, Patel A, Chan M, Berwanger O, Ackland G, Kavsak PA, Rodseth R, Biccard B, Chow CK, Borges FK, et al. Preoperative N-Terminal Pro-B-Type natriuretic peptide and cardiovascular events after noncardiac surgery: A cohort study. Ann Intern Med. 2020;172(2):96–104. - PubMed
-
- Shameer K, Johnson KW, Glicksberg BS, Dudley JT, Sengupta PP. Machine learning in cardiovascular medicine: are we there yet? Heart. 2018;104(14):1156–1164. - PubMed
MeSH terms
LinkOut - more resources
Full Text Sources
Medical
