

Metabolic dysfunction-associated steatotic liver disease (MASLD) biomarkers and progression of lower limb arterial calcification in patients with type 2 diabetes: a prospective cohort study
- PMID: 40269920
- PMCID: PMC12020187
- DOI: 10.1186/s12933-025-02705-9
Metabolic dysfunction-associated steatotic liver disease (MASLD) biomarkers and progression of lower limb arterial calcification in patients with type 2 diabetes: a prospective cohort study
Abstract
Background: Studies have demonstrated that both lower limb arterial calcification and metabolic dysfunction-associated steatotic liver disease (MASLD) are linked to the development of peripheral artery disease. However, the potential relationship between MASLD biomarkers and progression of lower limb arterial calcification in individuals with type 2 diabetes (T2D) remains unclear. This study aimed to investigate whether the biomarkers of MASLD included in the FibroMax® panels are associated with the progression of lower limb arterial calcification in patients with T2D.
Methods: The lower limb arterial calcification score (LLACS) was evaluated through computed tomography at baseline and after an average follow-up of 31.2 ± 3.7 months in a cohort of 150 patients with T2D. We also measured the serum biomarkers included in the FibroMax® panels (SteatoTest®, FibroTest®, NashTest®, ActiTest®). The predictive ability of these biomarkers of MASLD on LLACS progression was assessed through univariate and multivariate linear regression models, principal component regression analysis, as well as machine learning algorithms.
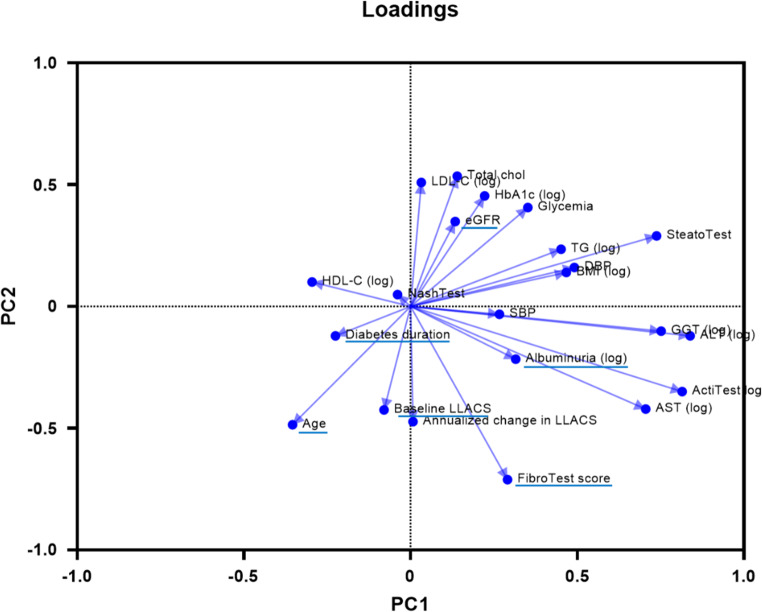
Results: During the follow-up period, LLACS increased in 127 (85%) of the 150 patients with T2D. In univariate analysis, the annualized change in LLACS was positively and mainly correlated with baseline LLACS (r = 0.860, p < 0.0001), the FibroTest® score (r = 0.304, p = 0.0002), and age (r = 0.275, p = 0.0006), and negatively correlated with glomerular filtration rate (r = - 0.242, p = 0.003). In multivariate analysis, the FibroTest® score remained independently associated with the annualized change in LLACS, after adjusting for baseline LLACS and risk factors for lower extremity artery disease (β coefficient [95% confidence interval]: 988 [284-1692], p = 0.006). This association persisted even after adjustment for variables selected by principal component analysis (β = 1029 [289-1768], p = 0.007). Two advanced machine learning models identified the FibroTest® score as the second most important predictor of annualized change in LLACS, following baseline LLACS.
Conclusions: This study represents the first demonstration of an independent relationship between a non-invasive liver fibrosis test and the progression of lower limb arterial calcification in patients with T2D. Beyond its utility in assessing liver fibrosis, the FibroTest® could be a valuable and easy-to-use biomarker for predicting the risk of worsening lower limb arterial calcification.
Trial registration: ClinicalTrials.gov identifier NCT02431234.
Keywords: Liver fibrosis; Nonalcoholic fatty liver disease; Peripheral arterial disease; Type 2 diabetes mellitus.
© 2025. The Author(s).
Conflict of interest statement
Declarations. Ethics approval and consent to participate: This study involving human participants have been performed in accordance with the Declaration of Helsinki and have been approved by our local ethics committee. Consent for publication: Not applicable. Competing interests: The authors declare that they have no competing interests.
Figures

References
-
- American Diabetes Association. Peripheral arterial disease in people with diabetes. Diabetes Care. 2003;26:3333–41. - PubMed
-
- Everhart JE, Pettitt DJ, Knowler WC, Rose FA, Bennett PH. Medial arterial calcification and its association with mortality and complications of diabetes. Diabetologia. 1988;31:16–23. - PubMed
Publication types
MeSH terms
Substances
Associated data
LinkOut - more resources
Full Text Sources
Medical
