. 2025 Apr 23;20(1):45.
doi: 10.1186/s13024-025-00831-2.

Increased TMEM106B levels lead to lysosomal dysfunction which affects synaptic signaling and neuronal health

Affiliations

Increased TMEM106B levels lead to lysosomal dysfunction which affects synaptic signaling and neuronal health

Jolien Perneel et al. Mol Neurodegener. .

Abstract

Background: Genetic variation in Transmembrane protein 106B (TMEM106B) is known to influence the risk and presentation in several neurodegenerative diseases and modifies healthy aging. While evidence from human studies suggests that the risk allele is associated with higher levels of TMEM106B, the contribution of elevated levels of TMEM106B to neurodegeneration and aging has not been assessed and it remains unclear how TMEM106B modulates disease risk.

Methods: To study the effect of increased TMEM106B levels, we generated Cre-inducible transgenic mice expressing human wild-type TMEM106B. We evaluated lysosomal and neuronal health using in vitro and in vivo assays including transmission electron microscopy, immunostainings, behavioral testing, electrophysiology, and bulk RNA sequencing.

Results: We created the first transgenic mouse model that successfully overexpresses TMEM106B, with a 4- to 8-fold increase in TMEM106B protein levels in heterozygous (hTMEM106B(+)) and homozygous (hTMEM106B(++)) animals, respectively. We showed that the increase in TMEM106B protein levels induced lysosomal dysfunction and age-related downregulation of genes associated with neuronal plasticity, learning, and memory. Increased TMEM106B levels led to altered synaptic signaling in 12-month-old animals which further exhibited an anxiety-like phenotype. Finally, we observed mild neuronal loss in the hippocampus of 21-month-old animals.

Conclusion: Characterization of the first transgenic mouse model that overexpresses TMEM106B suggests that higher levels of TMEM106B negatively impacts brain health by modifying brain aging and impairing the resilience of the brain to the pathomechanisms of neurodegenerative disorders. This novel model will be a valuable tool to study the involvement and contribution of increased TMEM106B levels to aging and will be essential to study the many age-related diseases in which TMEM106B was genetically shown to be a disease- and risk-modifier.

Keywords: Lysosomal dysfunction; Mouse model; Neuronal activity; Synaptic signaling; TMEM106B.


Conflict of interest statement

Declarations. Ethics approval and consent to participate: Not applicable. Consent for publication: Not applicable. Competing interests: Dr. Rademakers is a member of the Scientific Advisory Board of Arkuda Therapeutics and receives invention royalties from a patent related to progranulin. Dr. Mackenzie is a member of the Scientific Advisory Board of Prevail Therapeutics and receives invention royalties from a patent related to progranulin. The remaining authors declare that the research was conducted in the absence of any commercial or financial relationships that could be construed as a potential conflict of interest.

Figures

Fig. 1
Fig. 1
Development and validation of TMEM106B overexpression model. A Design of the transgene and induction of transgenic expression using Cre-mediated recombination. B Western blot of hemibrain lysates of 6-month-old animals using a human-specific anti-TMEM106B antibody (60,333–1-Ig, Proteintech), eGFP antibody (50430–2-AP, Proteintech), and anti-TMEM106B (E7H7Z, Cell Signaling Technology) (n = 3/genotype). C Quantification of the Western blot shows expression of the transgene, with a 2-fold increase in homozygous animals relative to heterozygous animals. D Quantification of total TMEM106B protein levels shows an approximately 4-fold to 8-fold overexpression for heterozygous and homozygous animals, respectively. E qPCR analysis of hemibrain lysates of 6-month-old animals using mouse-specific and human-specific qPCR primers shows expression of the transgene without downregulation of mouse Tmem106b (n = 4/genotype). F phase-contrast images of MEFs showing large vacuolar structures and G quantification of the vacuolar phenotype using pixel-based analysis. Per genotype, 4 replicate wells (derived from one embryo) were used and phase contrast images from 8 positions per well were acquired. Datapoints represent the average vacuolization ratio per image. Data represented as mean ± SEM. One-way ANOVA **, P < 0,01; ***, P < 0,001; ****, P < 0,0001
Fig. 2
Fig. 2
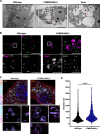
TMEM106B overexpression leads to large TMEM106B + vacuoles in primary neurons. A Numerous vacuoles were observed within the cytoplasm of hTMEM106B(+) neurons, including vacuoles containing fine material and membrane structures (asterisks) as well as empty, electron-clear vacuoles (red arrow heads). Scale bars (5 µm and 2 µm). B EEA1 staining shows normal EEA1 distribution and size and shows no colocalization with enlarged vesicles. C Expansion microscopy of wild-type and hTMEM106B(+) neurons. Scale bar (10 µm and 1000 nm). D The diameter of lysosomes was quantified for 4 cells/genotype. The large vacuolar lysosomes in hTMEM106B(+) neurons have a significantly higher diameter (P < 0.0001) and have fewer small (< 500 nm) lysosomes compared to wild-type neurons (P < 0.0001). Mann–Whitney U test
Fig. 3
Fig. 3
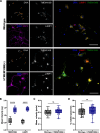
TMEM106B overexpression induces lysosomal dysfunction. A Representative images of hTMEM106B(+) and wild-type neurons stained for LAMP1 and TMEM106B, acquired with the same acquisition parameters, and displayed with identical brightness and contrast settings. Asterisks indicate example neurons that were included in the intensity measurement by discrimination from glial and/or dead cells based on nuclear features (see materials and methods for details). Scale bars (50 µm) and B Intensity measurements in wild-type and hTMEM106B(+) neurons show higher TMEM106B and LAMP1 intensity in TMEM106B overexpression neurons. Datapoints represent the average intensity per replicate (coverslip). Axonal lysosomal transport was evaluated by live cell imaging using Lysotracker. There was no significant difference in lysosomal mobility or speed between wild-type and hTMEM106B(+) neurons, quantified in C-D. Datapoints represent the average mobility or speed of tracks in one image field. Data represented as mean ± SEM. T-test *, P < 0,05; **, P < 0,01; ***, P < 0,001; ****, P < 0,0001
Fig. 4
Fig. 4
TMEM106B overexpression impairs lysosomal function. A Representative images of hTMEM106B(+) and wild-type neurons stained with DQ-BSA, acquired with the same acquisition parameters, and displayed with identical brightness and contrast settings. Asterisks indicate example neurons that were included in the intensity measurement by discrimination from glial and/or dead cells based on nuclear features (see materials and methods for details). Scale bars (50 µm) and B Intensity measurements in wild-type and hTMEM106B(+) neurons show lower DQ-BSA intensity in TMEM106B overexpression neurons (P = 0.018). Datapoints represent the average DQ-BSA intensity per replicate (well). C Proteolytic activity was further evaluated using a cathepsin D activity assay, showing a suggestive decrease in cathepsin D activity (P = 0.054). Data represented as mean ± SEM. T-test *, P < 0,05; **, P < 0,01; ***, P < 0,001; ****, P < 0,0001
Fig. 5
Fig. 5
TMEM106B overexpression leads to age-related downregulation of immediate early genes. We performed bulk RNAseq on the cerebral hemibrain of 15-month-old animals (hTMEM106B(+) and wild-type (n = 4/genotype). A Volcano plot and B heatmap of differentially expressed genes using DESeq2. C STRING-DB Interaction network of DEGs shows clear interaction between most DEGs, which are well-known immediate early genes (IEGs). D Pathway enrichment analysis using Enrichr shows enrichment of the DEGs in neurotrophic tyrosine receptor kinase (NTRK) signaling. E Visual representation of the NTRK signaling pathway, highlighting the involvement and function of the identified DEGs in the pathway. Figure created with Biorender. F qPCR validation of top three differentially expressed genes across different age groups (n = 4–7/genotype) shows that there is no difference in expression in 1-month-old animals. The downregulation of IEGs is becoming apparent at 6 months of age with a significant downregulation of Arc in hTMEM106B(+) mice, which further progresses in a significant decrease in 12-month-old animals and 15-month-old animals. This data shows that the downregulation of IEGs is age-related and not present from birth. Data represented as mean ± SEM. Two-way ANOVA *, P < 0,05; **, P < 0,01
Fig. 6
Fig. 6
TMEM106B overexpression alters synaptic transmission in the hippocampus. A Graphical representation of the experimental set-up. We performed electrical stimulation of the Schaffer collateral pathway in the hippocampal CA1 region of 12-month-old animals and assessed the ability of synapses to undergo long-term potentiation (LTP) after high-frequency tetanisation (100 Hz). Figure created with Biorender. B-C There was no signifcant difference in LTP between wild-type and hTMEM106B(+) animals. However, there was a significant decrease in baseline (pre-tetanus) paired-pulse ratio (P = 0.04), with hTMEM106B(+) animals exhibiting reduced paired-pulse facilitation. LTP; n = 11–14 brain slices/genotype. PPR; n = 15–16 brain slices/genotype. Data represented as mean ± SEM. T-test *, P < 0,05
Fig. 7
Fig. 7
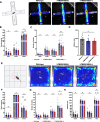
Increased TMEM106B levels leads to an anxiety-like phenotype in 12-month-old mice. A Graphical representation of the experimental set-up and composite heatmaps of wild-type (n = 14), hTMEM106B(+) (n = 20), and hTMEM106B(++) animals (n = 8) in the elevated plus maze. Figure created with Biorender. B Quantification of time spent in each zone, C the number of entries in each zone, and D the distance traveled within the maze. hTMEM106B(++) animals spent more time in the closed arms of the maze (P = 0.035) and hTMEM106B(+) animals showed a suggestive decrease in time spent in the closed arms (P = 0.065). hTMEM106B overexpression mice had fewer entries in each of the zones WT vs hTMEM106B(+), P = 0.023; WT vs hTMEM106B(++), P = 0.0044. E Graphical representation of the experimental set-up and composite heatmaps of wild-type, hTMEM106B(+), and hTMEM106B(++) animals in the open field test. Figure created with Biorender. F Quantification of time spent in each zone, G the number of entries in each zone, and H the distance traveled within the maze. hTMEM106B(++) mice spend less time in the corner of the box as opposed to wild-type (P = 0.008) and hTMEM106B(+) (P = 0.006) mice, the composite heatmap shows predominant localization of the hTMEM106B(++) mice to the sides and close to the corner of the box explaining the difference. TMEM106B overexpression animals show an overall decreased number of entries in the different zones of the maze (WT vs hTMEM106B(+), P = 0.025; WT vs hTMEM106B(++), P = 0.026) and travel less distance in each of the zones of the open field box. Together this data suggests that the overexpression animals are, overall, less explorative in the box and maze and show anxiety-like phenotype. Data represented as mean ± SEM. Two-way ANOVA, *, P < 0,05; **, P < 0,01
Fig. 8
Fig. 8
TMEM106B overexpression leads to cell loss in the hippocampus of 21-month-old mice. A Representative images of NeuN immunostaining of the hippocampal region of wild-type, hTMEM106B(+), and hTMEM106B(++) mice (n = 4–6/genotype) with zooms for the CA1 and CA3 regions. Scale bars (100 µm). B Quantitative measurements of neuronal loss included the quantification of the NeuN(+) area and quantification of NeuN(+) cells and total cells/mm2 (Hoechst). hTMEM106B(+) show a suggestive reduction in NeuN(+) cells (P = 0.051), a reduction in total cells/mm2 (P = 0.025), and a suggestive decrease in total NeuN(+) area (P = 0.058). hTMEM106B(++) show a reduction in NeuN(+) cells (P = 0.018), a suggestive reduction in total cells/mm.2 (P = 0.056), and a decrease in total NeuN(+) area (P = 0.0035). Data represented as mean ± SEM. ANOVA *, P < 0,05; **, P < 0,01

References

    1. Nelson PT, Wang WXX, Partch AB, Monsell SE, Valladares O, Ellingson SR, et al. Reassessment of risk genotypes (GRN, TMEM106B, and ABCC9 Variants) associated with hippocampal sclerosis of aging pathology. J Neuropathol Exp Neurol. 2015;74:75–84. - PMC - PubMed
    1. Hu Y, Sun JY, Zhang Y, Zhang H, Gao S, Wang T, et al. rs1990622 variant associates with Alzheimer’s disease and regulates TMEM106B expression in human brain tissues. BMC Med. 2021;19:11. - PMC - PubMed
    1. Tropea TF, Mak J, Guo MH, Xie SX, Suh E, Rick J, et al. TMEM106B Effect on cognition in Parkinson disease and frontotemporal dementia. Ann Neurol. 2019;85:801–11. - PMC - PubMed
    1. Doyle JJ, Parker JA, Bateman A. TMEM106B, an unexpected point of contact between FTD, ageing and a hypomyelination disorder. Brain. 2020;143:1628–31. - PubMed
    1. Ito Y, Hartley T, Baird S, Venkateswaran S, Simons C, Wolf NI, et al. Lysosomal dysfunction in TMEM106B hypomyelinating leukodystrophy. Neurol Genet. 2018;4:e288. - PMC - PubMed

LinkOut - more resources