. 2025 Jun;21(24):e2503399.
doi: 10.1002/smll.202503399. Epub 2025 Apr 24.

(ReMoV)X2 (X = S, Se) Ternary Alloy Nanosheets for Enhanced Electrocatalytic Hydrogen Evolution Reaction

Affiliations

(ReMoV)X2 (X = S, Se) Ternary Alloy Nanosheets for Enhanced Electrocatalytic Hydrogen Evolution Reaction

Junaid Ihsan et al. Small. 2025 Jun.

Abstract

Modulating the electronic structure of 2D transition metal dichalcogenides via alloying can extend their potential applications. In this study, composition-tuned ternary alloy nanosheets of (ReMoV)X2 (X = S and Se) are synthesized using solvothermal and colloidal reactions, respectively. Ternary alloying occurred with homogeneous atomic mixing over a wide range of compositions (xV = 0.16-0.80). Compared to (ReV)X2 binary alloying, ternary alloying produces a more metallic phase with less oxidation. Increasing xV induces a phase change into a more metallic 1T phase. The (ReMoV)S2 nanosheets demonstrate enhanced electrocatalytic activity toward the acidic hydrogen evolution reaction (HER) compared to (ReV)S2. Density functional theory calculations predict that ternary alloying increases the metallicity of the nanosheets. In addition, the Gibbs free energy calculation for hydrogen adsorption (ΔGH*) shows that ternary alloying effectively activates the basal S atoms for the HER, supporting the enhanced catalytic performance observed experimentally.

Keywords: ReMoV ternary alloys; first‐principles calculations; hydrogen evolution reaction; metallic nanosheets; transition metal dichalcogenide.


Conflict of interest statement

The authors declare no conflict of interest.

Figures
Scheme 1
Scheme 1
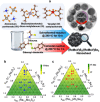
a) Schematic diagram for the synthesis of (ReMoV)S2 and (ReMoV)Se2 alloy nanosheets, respectively, using solvothermal and colloidal reactions. Ternary plot for the composition (x Re, x Mo, x V) of b) (ReMoV)S2 and c) (ReMoV)Se2 alloy nanosheets synthesized in the present work. For (ReMoV)S2, 1S: (0.42, 0.42, 0.16), 2S: (0.25, 0.5, 0.25), 3S: (0.50, 0.25, 0.25), 4S: (0.33, 0.33, 0.33), 5S: (0.16, 0.42, 0.42), 6S: (0.42, 0.16, 0.42), 7S: (0.25, 0.25, 0.5), 8S: (0.167, 0.167, 0.67), 9S: (0.125, 0.125, 0.75), and 10S: (0.10, 0.10, 0.80). For (ReMoV)Se2, 1Se: (0.25, 0.5, 0.25), 2Se: (0.50, 0.25, 0.25), 3Se: (0.33, 0.33, 0.33), 4Se: (0.25, 0.25, 0.5), 5Se: (0.4, 0.1, 0.5), 6Se: (0.3, 0.1, 0.6), 7Se: (0.167, 0.167, 0.67), and 8Se: (0.125,0.125, 0.75).
Figure 1
Figure 1
a) SEM and HRTEM images of Re0.33Mo0.33V0.33S2 (sulfide sample 4S) and Re0.33Mo0.33V0.33Se2 (selenide sample 3Se). b) HAADF STEM image and EDX elemental mapping of Re (M shell), Mo (L shell), V (K shell), and S (K shell) or Se (L shell) for 4S and 3Se. Insets: EDX spectra showing composition tuning in the 10 samples of (ReMoV)S2 and 8 samples of (ReMoV)Se2. For sulfides, the inset corresponds to the enlarged edge part of overlapped Mo L/S K shell, showing the composition tuning of Mo. c) Atomic‐resolution HAADF STEM images and corresponding FFT images for 1S (x V = 0.16), 4S (x V = 0.33), 8S (x V = 0.67), 3Se (x V = 0.33), and 7Se (x V = 0.67). The [011¯0] spots (FFT) matched to d 010 = 0.28 nm for sulfide and 0.29 nm for selenide. Darker regions of VS2 become dominant as x V increases. Line profile along the marked area, showing the random distribution of Re, Mo, and V atoms that were identified by comparing the intensity of adjacent atoms.
Figure 2
Figure 2
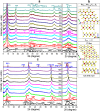
a) Left: full‐range XRD patterns of ReS2, MoS2, VS2, and (ReMoV)S2 samples, together with the reference peaks generated using the calculated lattice constants of 1T′′ ReS2, 1T′ MoS2, 3R‐1T VS2, and Re0.31Mo0.38V0.31S2 (for sample 4S). Right: magnified XRD peak at 2θ = 54°–62° for (2 4¯ 1)1T′′ of ReS2, (2¯ 05)1T′ of MoS2, (110)3R‐1T/(113)3R‐1T of VS2, and (110)1T of 4S. b) Crystal structures (ball‐and‐stick models) of the two‐layered (4 × 4 × 1) supercell and relative energy (Erel) for 2H and 1T‐like phase of Re0.31Mo0.38V0.31S2, projected along the basal plane (c axis, top) and b‐axis (bottom). Gray, violet, red, and yellow balls represent Re, Mo, V, and S atoms, respectively. c) Left: full‐range XRD patterns of ReSe2, MoSe2, VSe2, and (ReMoV)Se2 samples, together with the reference peaks calculated using the lattice constants of 1T′′ ReSe2, 2H MoSe2, and 1T VSe2. Right: magnified XRD peak at 2θ = 52°–60°.
Figure 3
Figure 3
a) Fine‐scan XPS peaks of Re 4f (4f 7/2 and 4f 5/2 separated by 2.43 eV), Mo 3d (3d 5/2 and 3d 3/2 separated by 3.13 eV), V 2p (2p 3/2 and 2p 1/2 separated by 7.64 eV), and VBS for ReS2, MoS2, VS2, and sulfide samples (1S–10S). Positions of neutral Re0 (4f 7/2 at 40.3 eV), Mo0 (3d 5/2 at 228.0 eV), and V0 (2p 3/2 at 512.2 eV) are marked by dotted vertical lines. The experimental data (open circles) are fitted by a Voigt function after a Shirley‐type baseline correction. The sum of the resolved bands is represented by a black line. In VBS, the Fermi level (EF) is marked by a dotted vertical line. The d‐band center (ɛd) value is also labeled with a dotted line arrow to emphasize the redshift with increasing x V. b) XANES and (non‐phase‐corrected) k 2‐weighted FT EXAFS above the Re L3‐edge (10.53 keV), Mo K‐edge (20.01 keV), and V K‐edge (5.46 keV), and their corresponding WT EXAFS (k‐space vs R‐space) for sulfide samples 1S, 4S, 7S, 8S, and 10S.
Figure 4
Figure 4
a) LSV curves (scan rate: 2 mV s−1) versus RHE for (ReMoV)S2 samples, and Pt/C toward HER in H2‐saturated 0.5 m H2SO4. The values in parenthesis correspond to η J = 10. b) Tafel plots (η vs log J) derived from the LSV curves, based on the equation η = b log(J/J 0), where b is the Tafel slope, and J 0 is the exchange current density (extrapolated value at η = 0). Linear fit provides the b values (in parenthesis). c) CA responses of x V = 0.67 (sample 8S) and Pt/C at ηJ = 10 (104 mV) for 5 days and d) comparison of 1st and 2000th cycled LSV curves. e) ηJ = 10 versus x V for (ReMo)1‐ x V x S2 (sphere symbols) and Re1‐ x V x S2 samples (columns, ref. [20]). f) LSV curves and g) Tafel plots for (ReMoV)Se2 samples. The corresponding ηJ = 10 and b values are listed in the parentheses. h) ηJ = 10 versus x V for (ReMo)1‐ x V x Se2 (sphere symbols), Re1‐ x V x Se2 ref. [19]/Mo1‐ x V x Se2 ref. [14] samples (columns). i) Ex situ XANES above the Re L3‐edge (10.53 keV), Mo K‐edge (20.01 keV), and V K‐edge (5.46 keV) for x V = 0.67 (sample 8S) after applying an overpotential (𝜂 = 0–100 mV vs RHE) under HER conditions (H2‐saturated 0.5 m H2SO4).
Figure 5
Figure 5
a) TDOS near the Fermi level for 2H and 1T‐like phases of Re0.31Mo0.38V0.31S2, Re0.75V0.25S2, Re0.5V0.5S2, and Re0.25V0.75S2 ref. [20]. The Fermi level (black line) is set to zero. b) Geometry of H adsorption on Re0.31Mo0.38V0.31S2. The ΔGH* value is given for each site. Gray, violet, red, and yellow balls represent Re, Mo, V, and S atoms, respectively. The small blue ball represents the adsorbed H atom. c) Histograms representing ΔGH* for various S sites of Re1‐ x V x S2 ref. [20] and Re0.31Mo0.38V0.31S2 models.

References

    1. Jaramillo T. F., Jørgensen K. P., Bonde J., Nielsen J. H., Horch S., Chorkendorff I., Science 2007, 317, 100. - PubMed
    1. Kibsgaard J., Chen Z., Reinecke B. N., Jaramillo T. F., Nat. Mater. 2012, 11, 963. - PubMed
    1. Voiry D., Yamaguchi H., Li J., Silva R., Alves D. C. B., Fujita T., Chen M., Asefa T., Shenoy V. B., Eda G., Chhowalla M., Nat. Mater. 2013, 12, 850. - PubMed
    1. Jin H., Guo C., Liu X., Liu J., Vasileff A., Jiao Y., Zheng Y., Qiao S. Z., Chem. Rev. 2018, 118, 6337. - PubMed
    1. Zhang X., Lai Z., Ma Q., Zhang H., Chem. Soc. Rev. 2018, 47, 3301. - PubMed

LinkOut - more resources