. 2025 Jul;12(26):e2504054.
doi: 10.1002/advs.202504054. Epub 2025 Apr 24.

SNORA74A Drives Self-Renewal of Liver Cancer Stem Cells and Hepatocarcinogenesis Through Activation of Notch3 Signaling

Affiliations

SNORA74A Drives Self-Renewal of Liver Cancer Stem Cells and Hepatocarcinogenesis Through Activation of Notch3 Signaling

Ziheng Zhou et al. Adv Sci (Weinh). 2025 Jul.

Abstract

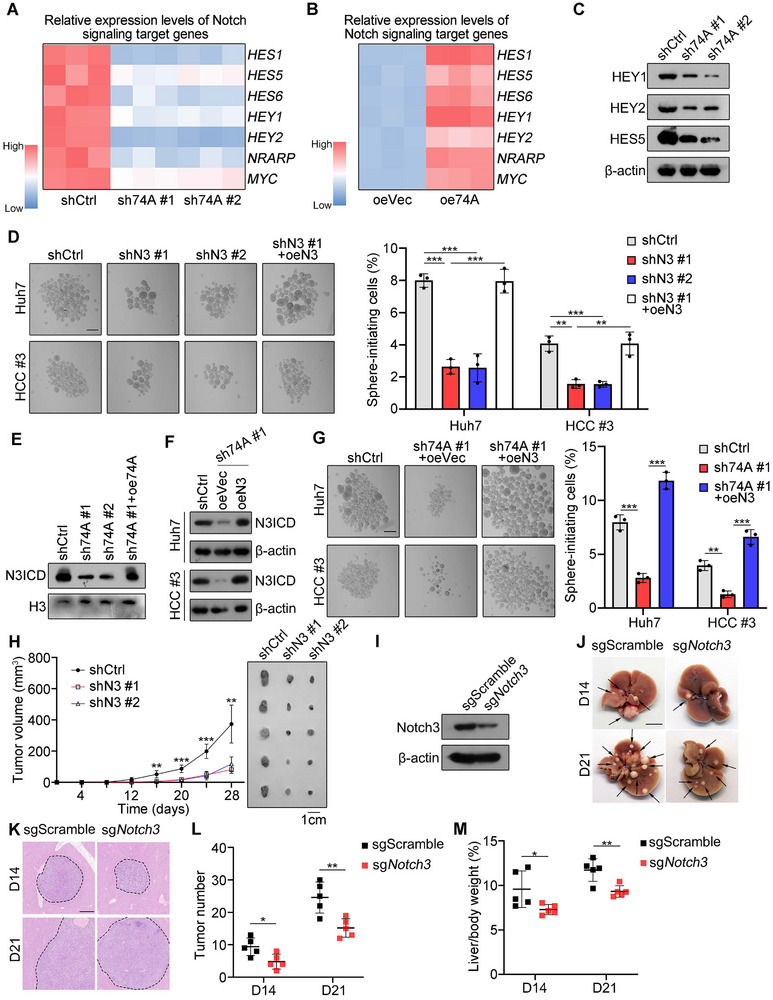
Liver cancer stem cells (CSCs) account for tumor initiation, heterogeneity and therapy resistance. However, the role of small nucleolar RNAs (snoRNAs) in the regulation of liver CSCs remains largely unclear. Here, this work identifies a conserved H/ACA box snoRNA SNORA74A which is highly expressed in liver CSCs. SNORA74A deletion impaired the self-renewal of liver CSCs and suppressed hepatocarcinogenesis. Mechanistically, highly expressed SNORA74A in liver CSCs bound DCAF13 to prevent K48 linked ubiquitination of E2F2 for degradation. E2F2 induced NOTCH3 transcription to initiate Notch3 signaling activation, leading to self-renewal of liver CSCs and hepatocarcinogenesis. Moreover, expression levels of SNORA74A and NOTCH3 are positively related with severity and poor prognosis of hepatocellular carcinoma (HCC) patients. Of note, antisense oligonucleotides (ASOs) against SNORA74A showed effective efficacy for HCC tumors, suggesting SNORA74A might be a potential therapeutic target for HCC therapy by eliminating liver CSCs.

Keywords: DCAF13; SNORA74A; liver cancer stem cells; notch3 signaling; self‐renewal.


Conflict of interest statement

The authors declare no conflict of interest.

Figures

Figure 1
Figure 1
SNORA74A is highly expressed in HCC tumor tissues and liver CSCs. A) Volcano plot of upregulated and downregulated snoRNAs (p < 0.05 and fold change > 2) in liver CSCs. B) snoRNAs screening via sphere‐formation assay. Spheres with a diameter exceeding 100 µm were counted. HCC #1 and HCC #2 denote the ID of primary HCC samples. sh#1 and sh#2 indicate two effective shRNAs targeting snoRNAs. Data are presented as means ± SD. n = 3 for each group. C) Schematic representation of human SNORA74A. Arrow indicates the position of SNORA74A in the linear gene locus. SNORA74A marks with a red square. E1, exon #1. D–F) Expression levels of SNORA74A in HCC tumors and peri‐tumors (D), in CD13+CD133+ CSCs and CD13CD133 non‐CSCs (E), and in oncospheres and non‐spheres (F). Northern blot assays were performed to detect size and expression levels of SNORA74A, with 18S rRNA serving as a loading control. G) Copy numbers of SNORA74A was analyzed by qRT‐PCR. Left panel: black dots represent known copy numbers of SNORA74A from pcDNA3 plasmids containing SNORA74A sequence. Gray and red dots denote copy numbers of SNORA74A in non‐spheres and oncospheres, respectively, while blue and white dots represent copy numbers in non‐CSCs and CSCs. Right panel: Average copy numbers of SNORA74A per cell were calculated. Data are presented as means ± SD. n = 3 for each group. H) Nuclear‐cytoplasmic separation assays were performed using liver CSCs lysates, followed by qRT‐PCR analysis (left panel) and Western blot analysis (right panel). U1 RNA was used as a positive control for nuclear localization. EEA1, early endosome antigen 1; H3, histone 3. Data are presented as means ± SD. I) Nucleolus‐nucleoplasm separation assays were performed using liver CSCs nuclear lysates, followed by qRT‐PCR analysis (left panel) and Western blotting (right panel). LAMIN A/C, prelamin‐A/C; NPM1, nucleophosmin. Data are presented as means ± SD. n = 3 for each group. J) Representative immunofluorescence staining of SNORA74A and nucleolar marker NPM1 in liver CSCs sorted from Huh7 and primary HCC cells. NPM1 was used as a positive control of nucleolar staining. Scale bar, 10 µm. * p < 0.05; ** p < 0.01; *** p < 0.001 by two‐tailed Student's t‐test. Data are representative of at least three independent experiments.
Figure 2
Figure 2
SNORA74A deletion inhibits self‐renewal of liver CSCs and tumorigenesis. A,B) SNORA74A depletion reduced oncosphere formation of Huh7 and HCC primary cells. Overexpression of SNORA74A (oe74A) restored oncosphere formation (A). shCtrl, shRNA scramble; sh74A, depletion of SNORA74A. Scale bar, 500 µm. Oncosphere formation rates were assessed through serial oncosphere formation assay (B). Data are presented as means ± SD. n = 3 for each group. C) Limited dilutions of SNORA74A depleted or control HCC cells were subcutaneously injected into BALB/c nude mice (8 W) and maintained for 3 months to assess tumor incidence. Representative images of tumors are shown (left panel) and numbers of tumor‐free mice were calculated (right panel). n = 8 for each group. D) 1 × 10⁶ SNORA74A depleted or control HCC cells were subcutaneously injected into BALB/c nude mice (8 W), followed by measurement of tumor progression every 4 days. Representative images of tumors are shown (right panel). Results are presented as means ± SD. n = 5 for each group. E) Orthotopic liver tumors of SNORA74A depleted or control Huh7‐Luc cells were imaged via luciferase signals. Representative images are shown (left panel), and statistical results are shown as means ± SD (right panel). n = 5 for each group. Cohen's d = 2.25 (sh74A #1) and 2.47 (sh74A #2). F) Representative images of clone formation capability in SNORA74A depleted or control HCC cells. G,H) ASO‐h (25 mg kg body weight) against SNORA74A was injected around HCC primary tumors in BALB/c nude mice on days 24, 26, 28, 30 and 32. Mice were sacrificed at the 40th day after injection, and tumors were excised and weighed. Representative images were shown. Scale bar, 1 cm. Data are shown as means ± SD. n = 5 for each group. Cohen's d = 3.64. I) Northern blot analysis for Snora74a expression in Snora74a +/+ and Snora74a −/− mouse livers, with 18S rRNA serving as a loading control. J) Liver tumors from Snora74a +/+ and Snora74a −/− mice induced by hydrodynamic tail‐vein injection for 14 days (D14) and 21 days (D21). Black arrows indicate liver tumors. n = 5 for each group. Scale bars, 1 cm. K) Representative HE images of liver sections from Snora74a +/+ and Snora74a −/− mice via hydrodynamic tail‐vein injection. Scale bar, 500 µm. L,M) Numbers of tumors in liver (L) and ratios of liver weight versus body weight (M) were presented after hydrodynamic tail‐vein injection. n = 5 for each group. * p < 0.05; ** p < 0.01; *** p < 0.001 by two‐tailed Student's t‐test. Data are representative of at least three independent experiments.
Figure 3
Figure 3
SNORA74A overexpression enhances self‐renewal of liver CSCs and development of HCC. A,B) SNORA74A overexpression enhanced oncosphere formation capability of Huh7 and HCC primary cells (A). Scale bar, 500 µm. Oncosphere formation rates were assessed through serial oncosphere formation experiments (B). Data are presented as means ± SD. n = 3 for each group. C) Limited dilutions of SNORA74A overexpression or control HCC cells were subcutaneously injected into BALB/c nude mice (8 W) and observed for 3 months to assess tumor incidence. Representative images of tumors are shown (left panel) and numbers of tumor‐free mice were calculated (right panel). n = 8 for each group. D) 1 × 10⁶ SNORA74A overexpression or control HCC cells were subcutaneously injected into BALB/c nude mice (8 W), followed by measurement of tumor progression every 4 days. Representative images of tumors are shown (right panel). Results are presented as means ± SD. n = 5 for each group. E) Orthotopic liver tumor of SNORA74A overexpression or control Huh7‐Luc cells were imaged via luciferase signals. Representative images are shown (left panel), and statistical results are shown as means ± SD (right panel). n = 5 for each group. Cohen's d = ‐1.49. F) Representative images of clone formation in SNORA74A overexpression or control HCC cells. G) Schematic diagram illustrating induction of liver tumors in Snora74a overexpression or control mice. H) Northern blot analysis for Snora74a expression in liver tissues from control and Snora74a overexpression mice, with 18S rRNA serving as a loading control. I) Liver tumor images of control and Snora74a overexpression mice after hydrodynamic tail‐vein injection. n = 5 for each group. Scale bars, 1 cm. J) Representative HE images of control and Snora74a overexpression mice liver sections after hydrodynamic tail‐vein injection. Scale bar, 500 µm. K,L) Numbers of tumors in liver (K) and ratios of liver weight versus body weight (L) were presented. n = 5 for each group. * p < 0.05; ** p < 0.01; *** p < 0.001 by two‐tailed Student's t‐test. Data are representative of at least three independent experiments.
Figure 4
Figure 4
SNORA74A binds DCAF13 to prevent interaction with E2F2 for its ubiquitination. A) Relative pseudouridine modification levels at U3741 and U3743 of 28S rRNA in SNORA74A depletion, SNORA74A rescued, and SNORA74A binding region deletion (oe△74A) rescued conditions. Data are shown as means ± SD. n = 3 for each group. B,C) Oncosphere formation assays in control, SNORA74A depletion, SNORA74A rescued, or oe△74A (B). Scale bar, 100 µm. Oncosphere formation rates were assessed (C). Data are presented as means ± SD. n = 3 for each group. D) RNA pulldown assays were conducted using biotin‐labeled probes of SNORA74A sequence in liver CSC lysates, with its antisense sequence as a control, followed by mass spectrometry. Differential bands were confirmed to be DCAF13 (black arrow). E) Interaction between SNORA74A and DCAF13 was detected in liver CSCs by Western blot. β‐actin was used as a loading control. Control probes with similar length as SNORA74A probes but non‐specific sequences. F) Liver CSCs were used for RIP assay, followed by qRT‐PCR. SNORA6 and SNORD118 were used as controls. Results are shown as means ± SD. n = 3 for each group. G) Biotin‐labeled SNORA74A RNA probe was incubated with DCAF13 for RNA EMSA. H) Representative immunofluorescence staining of SNORA74A, DCAF13 and NPM1 in liver CSCs. Scale bar, 10 µm. I) Domain mapping of DCAF13 protein with a biotinylated SNORA74A probe, followed by RNA pulldown assay and Western blot. J) Co‐IP experiment was performed using DCAF13 and IgG antibodies in lysates of SNORA74A depleted liver CSCs to identify DCAF13 interacting proteins, followed by mass spectrometry. Black arrows indicate DDB1 and E2F2. K) Co‐IP experiments detected interaction between endogenous DCAF13 and E2F2 in liver CSCs. L) Myc‐tagged DCAF13 and Flag‐tagged E2F2 were co‐transfected into control, SNORA74A depleted or SNORA74A rescued liver CSCs for 48 h. Cell lysates were immunoprecipitated with anti‐Flag antibody, followed by Western blotting with anti‐Flag or anti‐Myc antibodies. M) Myc‐tagged DCAF13, Flag‐tagged E2F2, HA‐tagged DDB1, and His‐tagged ubiquitin were co‐transfected into control or SNORA74A depleted liver CSCs for 48 h. Cell lysates were incubated with anti‐Flag antibody for immunoprecipitation, followed by Western blotting. N) 1 × 10⁶ SNORA74A depleted or control liver CSCs lysates were incubated with anti‐E2F2 antibody for immunoprecipitation, followed by Western blotting with K48‐linked specific ubiquitination antibody or E2F2 antibody. * p < 0.05; ** p < 0.01; *** p < 0.001 by two‐tailed Student's t‐test. Data are representative of at least three independent experiments.
Figure 5
Figure 5
E2F2 binds to the promoter region of NOTCH3 gene to initiate its transcription. A) GSEA analysis indicated that differentially expressed genes between SNORA74A depleted and control liver CSCs and Notch signaling pathway was enriched. NES, normalized enrichment score; FDR, false discovery rate; FWER, familywise error rate. B,C) Expression levels (normalized to 18S rRNA) of NOTCH1‐4 in SNORA74A depleted (B) or overexpressed (C) liver CSCs were detected by qRT‐PCR. n = 3 for each group. D) ChIP‐qPCR analysis of E2F2 enrichment on the ‐2800 to ‐2600 bp region of NOTCH3 promoter in SNORA74A‐overexpressed, depleted or control liver CSCs. n = 3 for each group. Results are shown as means ± SD. E) Luciferase reporter assay was performed in SNORA74A depleted or control liver CSCs. Results are shown as means ± SD. n = 3 for each group. F) Luciferase reporter assay was performed in E2F2 depleted or control liver CSCs. Results are shown as means ± SD. n = 3 for each group. G) Expression levels of NOTCH3 were assessed in control, E2F2 depleted and E2F2 rescued liver CSCs using qRT‐PCR (left panel) and Western blotting (right panel). Results are shown as means ± SD. n = 3 for each group. H) Kaplan‐Meier survival curves for HCC samples from GEPIA. Patients were divided into two groups based on expression levels of E2F2.Log‐rank P = 7.8E‐05 by Log‐rank (Mantel‐Cox) test I) Immunohistochemical staining of E2F2 was performed in human HCC samples (left panel). Scale bar, 50 µm. Protein expression intensity was assessed (right panel). 10 visual fields were counted using ImageJ. Data are presented as means ± SD. ** p < 0.01; *** p < 0.001 by two‐tailed Student's t‐test. Data are representative of at least three independent experiments.
Figure 6
Figure 6
SNORA74A mediated Notch3 signaling initiates self‐renewal of liver CSCs and hepatocarcinogenesis. A,B) Notch signaling target genes were tested in SNORA74A depleted (A) or overexpressed (B) liver CSCs by qRT‐PCR. n = 3 for each group. C) Protein levels of target genes in the Notch signaling pathway were detected by Western blot with HEY1, HEY2 and HES5 antibodies in SNORA74A depleted and control liver CSCs. Results are shown as means ± SD. D) NOTCH3 depletion reduced oncosphere formation capability in HCC cells. Overexpression of N3CID restored oncosphere formation that was reduced by NOTCH3 depletion (left panel). Scale bar, 200 µm. Oncosphere formation rates were assessed (right panel). Data are presented as mean ± SD. n = 3 for each group. E) Protein levels of N3CID in the nucleus of control, SNORA74A depleted, and SNORA74A rescued liver CSCs were assessed via Western blotting, with H3 serving as a loading control. F) Western blotting was performed to assess overexpression of N3ICD in SNORA74A depleted cells. G) N3ICD overexpression restored oncosphere formation capability reduced by SNORA74A depletion (left panel). Scale bar, 200 µm. Oncosphere formation rates were assessed (right panel). Data are presented as mean ± SD. n = 3 for each group. H) 1 × 10⁶ NOTCH3 depleted or control HCC cells were subcutaneously injected into BALB/c nude mice (8 W), followed by measurement of tumor progression every 4 days. Representative images of tumors are shown (right panel). Results are presented as means ± SD. n = 5 for each group. I) Western blotting of Notch3 expression in liver tissues from sgScramble and sgNotch3 mice. J) Liver tumor images of sgScramble and sgNotch3 mice after hydrodynamic tail‐vein injection for D14 and D21. n = 5 for each group. Scale bars, 1 cm. K) Representative HE images of liver sections from sgScramble and sgNotch3 mice at D14 and D21 after hydrodynamic tail‐vein injection. Scale bar, 500 µm. L,M) Numbers of tumors in liver (L) and ratios of liver weight versus body weight (M) were presented at D14 and D21 after hydrodynamic tail‐vein injection. n = 5 for each group. * p < 0.05; ** p < 0.01; *** p < 0.001 by two‐tailed Student's t‐test. Data are representative of at least three independent experiments.
Figure 7
Figure 7
Expression levels of SNORA74A and NOTCH3 are positively correlated with severity of HCC patients and poor prognosis. A,B) Expression levels of SNORA74A (A) and SNORA74B (B) in HCC samples derived from TCGA. Data are presented as means ± SD. C,D) Kaplan‐Meier survival curves for HCC samples from TCGA. Patients were divided into two groups based on SNORA74A (C) or SNORA74B (D) expression levels. Log‐rank P by Log‐rank (Mantel‐Cox) test. E–G) Expression levels of NOTCH3 in HCC tumor and peri‐tumor tissues (E), liver CSCs and non‐CSCs (F), and oncospheres and non‐sphere cells (G) were detected by qRT‐PCR (upper panel) and Western blotting (lower panel). Results are presented as means ± SD. n = 3 for each group. H) Immunohistochemical staining of PCNA, NOTCH3, HEY1, and HES5 in human primary HCC samples (left panel). Scale bar, 50 µm. Protein expression intensities were assessed (right panel). 10 visual fields were counted using ImageJ. Data are presented as means ± SD. I–K) Expression levels of NOTCH3 in HCC samples from TCGA dataset (I), HCC samples (J) and HCC metastatic patients (K) provided by Wang's cohort (GSE14520). Data are presented as means ± SD. L) Kaplan–Meier survival curves of HCC samples from Wang's cohort. Based on NOTCH3 expression levels, patients were divided into two groups. Log‐rank P = 0.0370 by Log‐rank (Mantel‐Cox) test. ** p < 0.01; *** p < 0.001 by two‐tailed Student's t‐test. Data are representative of at least three independent experiments.
Figure 8
Figure 8
Combination of NOTCH3 inhibitor DAPT with SNORA74A ASOs has a synergistic antitumor effect. A) Oncosphere formation assays for DAPT treatment in HCC cells. Representative images (left panel) and statistical results (right panel) are shown. Scale bars, 500 µm. n = 3 for each group. Data are presented as means ± SD. B) Expression profiles of Notch signaling target genes with DAPT treatment. n = 3 for each group. C) Schematic representation of DAPT therapy method in Snora74a +/+ and Snora74a −/− mice. D) Liver tumors from Snora74a +/+ and Snora74a −/− mice treated with DAPT (10 mg kg−1) and vehicle at day 14 and 21. Black arrows indicate liver tumors. n = 6 for each group. Scale bar, 1 cm. E) Representative HE images of liver sections from Snora74a +/+ and Snora74a −/− mice via DAPT and vehicle treatment. Scale bar, 500 µm. F) Survival curve of Snora74a +/+ and Snora74a −/− mice after treatment with DAPT or vehicle. n = 6 for each group. Log‐rank P = 0.0042 by Log‐rank (Mantel‐Cox) test. G) Schematic representation of ASO plus DAPT treatment timeline in mice. H–J) ASOs combined with DAPT treatment in tumor‐bearing mice after hydrodynamic injection. Representative liver images (H), representative HE images (I), and survival analysis (J) are shown. n = 6 for each group. Log‐rank P = 0.0043 by Log‐rank (Mantel‐Cox) test. Scale bars, 1 cm. K) Schematic representation of ASO‐h/DAPT therapy method. L,M) Orthotopic human liver tumor growth was imaged via luciferase signals. Representative images are shown (L), and statistical results are shown as means ± SD (M). n = 6 for each group. Cohen's d = 1.93 (ASO‐h), 2.34 (DAPT), and 3.77 (ASO‐h+DAPT). * p < 0.05; ** p < 0.01; *** p < 0.001 by two‐tailed Student's t test or Log‐rank (Mantel‐Cox) test. Data are representative of at least three independent experiments.

References

    1. Llovet J. M., Pinyol R., Yarchoan M., Singal A. G., Marron T. U., Schwartz M., Pikarsky E., Kudo M., Finn R. S., Nat. Rev. Clin. Oncol. 2024, 21, 294. - PMC - PubMed
    1. Visvader J. E., Nature 2011, 469, 314. - PubMed
    1. Huang A., Yang X. R., Chung W. Y., Dennison A. R., Zhou J., Signal Transduction Targeted Ther. 2020, 5, 146. - PMC - PubMed
    1. Meacham C. E., Morrison S. J., Nature 2013, 501, 328. - PMC - PubMed
    1. Saw P. E., Liu Q., Wong P.‐P., Song E., Cell Stem Cell 2024, 31, 1101. - PubMed

MeSH terms

LinkOut - more resources