Review
. 2025 Apr 22;16(18):7637-7658.
doi: 10.1039/d5sc00270b. eCollection 2025 May 7.

A review of machine learning methods for imbalanced data challenges in chemistry

Affiliations
Review

A review of machine learning methods for imbalanced data challenges in chemistry

Jian Jiang et al. Chem Sci. .

Abstract

Imbalanced data, where certain classes are significantly underrepresented in a dataset, is a widespread machine learning (ML) challenge across various fields of chemistry, yet it remains inadequately addressed. This data imbalance can lead to biased ML or deep learning (DL) models, which fail to accurately predict the underrepresented classes, thus limiting the robustness and applicability of these models. With the rapid advancement of ML and DL algorithms, several promising solutions to this issue have emerged, prompting the need for a comprehensive review of current methodologies. In this review, we examine the prominent ML approaches used to tackle the imbalanced data challenge in different areas of chemistry, including resampling techniques, data augmentation techniques, algorithmic approaches, and feature engineering strategies. Each of these methods is evaluated in the context of its application across various aspects of chemistry, such as drug discovery, materials science, cheminformatics, and catalysis. We also explore future directions for overcoming the imbalanced data challenge and emphasize data augmentation via physical models, large language models (LLMs), and advanced mathematics. The benefit of balanced data in new material design and production and the persistent challenges are discussed. Overall, this review aims to elucidate the prevalent ML techniques applied to mitigate the impacts of imbalanced data within the field of chemistry and offer insights into future directions for research and application.


Conflict of interest statement

There are no conflicts to declare.

Figures

Fig. 1
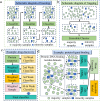
Fig. 1. (a) A schematic diagram of an oversampling method, demonstrating the approach of the oversampling technique to balance the dataset. (b) This example demonstrates the application of Borderline-SMOTE method in properties prediction of polymer materials. Firstly, experimental data of 23 rubber materials were collected, and the nearest neighbor interpolation (NNI) algorithm was used to expand the dataset, resulting in a total of 483 datasets. Then, the K-means algorithm was used to cluster these datasets into two categories. Finally, based on the clustering results, Borderline-SMOTE was used to interpolate along the boundaries of the minority samples, generating two clusters with sample sizes of 314 and 396, respectively. (c) This illustration showcases the utilization of the SMOTE technique in the domain of catalyst development. 126 heteroatoms doped arsenenes were collected as the original dataset, and the absolute value of Gibbs free energy changes (|ΔGH|) of 0.2 eV was selected as the threshold to divide the original data into two categories (88 with |ΔGH| > 0.2 eV and 38 with |ΔGH| < 0.2 eV). Then, SMOTE was applied to solve the problem of data imbalance and obtain two types of evenly distributed data.
Fig. 2
Fig. 2. (a) A schematic diagram of undersampling method, demonstrating the approach of undersampling technique to balance the dataset. (b) This example demonstrates the application of a new method based on RUS technology in the realm of drug discovery. The majority samples in the drug target dataset are clustered using K-means clustering method and divided into different clusters. After that, the RUS method is used to randomly select a cluster from these clusters, repeat multiple times, and combine the selected cluster with minority samples in the original dataset to form a new balanced set. (c) This instance illustrates the use of the Tomek-Links approach for addressing imbalance in data within the realm of materials design. Initially, SMOTE is used to generate minority samples, making the dataset roughly balanced. Then, Tomek Links is used to identify and remove the majority samples in Tomek-Links (samples near the classification boundary) to clean the data, thereby refining the roughly balanced dataset into a finer one. (d) This example uses the NearMiss-2 method to address data imbalance within the domain of protein-ligand binding. Firstly, a training dataset of peptide sequences is constructed, containing 4242 minority samples with malonylation sites and 71 809 majority samples without malonylation sites. Next, the NearMiss-2 method is used to calculate the distance between each majority sample and each minority sample, and then the k farthest minority samples are selected to calculate the average distance to these k minority samples. Finally, the majority sample with the smallest average distance is retained to achieve data balance.
Fig. 3
Fig. 3. (a) The schematic diagram of DBSM algorithm flow. The process of DBSM includes two parts: undersampling and oversampling. For the undersampling part, apply DBSCAN to create clusters from all training sets. Then a portion of the majority samples is deleted from each cluster. The output of the undersampling technique is only majority samples. For the oversampling part, SMOTE is used to add synthetic sampless of minority samples to the training set. Therefore, the final output of the DBSM algorithm is a new training set consisting only of the majority samples from the undersampling part and the minority samples from the oversampling part. (b) This example demonstrates the application of the K-means SMOTE method in predicting bioluminescent proteins to address imbalanced data. Firstly, K-means is used to cluster the majority and minority samples separately to solve the problem of intra-class imbalance. Secondly, SMOTE is used for oversampling a small number of samples (luminescent proteins) to increase the number of minority samples and form a new balanced dataset with the majority samples.
Fig. 4
Fig. 4. (a) This example demonstrates the application of generative adversarial network (GAN) in identifying antiviral peptide activity. Firstly, an imbalanced dataset was constructed, consisting of 2934 antiviral peptides (AVPs) and 17 184 non-antiviral peptides. The AVPs were used as input data to train the GAN model and then many AVP-like data were generated. Finally, the generated data were added to the original AVP data to achieve balance between the majority and minority samples. (b) The illustration of the variational autoencoder (VAE) algorithm for balancing data. It is divided into two parts: encoder and decoder. The former compresses the input into probabilistic latent representations, while the latter reconstructs data from latent space, the part between the encoder and the decoder. When applied to imbalanced data, VAE achieves balance between majority and minority classes by generating new samples for the minority class.
Fig. 5
Fig. 5. (a) A schematic diagram of the boosting algorithm. This method constructs a powerful classifier by connecting multiple weak classifiers. It uses an iterative process to make each subsequent classifier focus more on the misclassified minority class samples in the previous classifier's classification results, thus balancing the attention to minority and majority classes. (b) A schematic diagram of the bagging algorithm. It creates multiple subsets through random sampling and substitution, and it improves the recognition of minority classes by increasing the presence of minority samples in the subsets. (c) This example demonstrates the application of boosting in drug discovery. Firstly, an imbalanced dataset was constructed including proteins that can interact with drugs and proteins that cannot interact with drugs. The model then randomly selects samples with the same weight and chance from the dataset to train the first classifier model. Then, each classifier is tested on all samples in the dataset, and the weights of misclassified samples are updated iteratively to generate the final classification model from several individual weak classifiers. (d) This example demonstrates the application of bagging methods in the field of protein–ligand binding. Firstly, the majority samples and minority samples are separated from the original training set. Then, a certain number of samples are randomly selected from the majority samples and merged with the minority samples to form a new subset, which is repeated multiple times. Using the two-dimensional convolutional neural network (2D-CNN) framework to learn on each subset, an ensemble model is finally formed according to the mean ensemble strategy.
Fig. 6
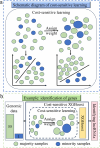
Fig. 6. (a) A schematic diagram of the cost-sensitive learning (CSL) method. It assigns different weights to differently misclassified samples, focusing the model more on high-cost minority sample errors, thereby reducing the likelihood of misclassification. (b) This example demonstrates the application of the cost-sensitive XGBoost method in genomics and transcriptomics. The imbalanced genomic data (minority : majority = 1 : 55) is input into the cost-sensitive XGBoost framework for processing, using the CSL method to assign weights to the samples. Then, the XGBoost classifier is used for processing to obtain a balanced dataset for subsequent analysis or modeling processes.
Fig. 7
Fig. 7. (a) The filter method sorts the six input samples (each with four features, different colors represent different features) directly based on different performance evaluation indicators and selects the feature with the highest score. (b) This example demonstrates the application of the wrapper feature selection method in the field of drug discovery. Firstly, through evaluating the extracted features, different weights are assigned for features. Then, a subset is selected from the feature set, and the wrapper method is used to choose the features that are most beneficial for model performance. (c) The schematic diagram of the embedded method, which combines feature selection with model training to ultimately obtain an optimal feature subset. (d) The workflow diagram of the random feature selection method, which randomly selects a subset of features from the entire feature set as the final feature subset.
None
Jian Jiang
None
Chunhuan Zhang
None
Lu Ke
None
Nicole Hayes
None
Yueying Zhu
None
Huahai Qiu
None
Bengong Zhang
None
Tianshou Zhou
None
Guo-Wei Wei

References

    1. Jiang J. Ke L. Chen L. Dou B. Zhu Y. Liu J. et al., Transformer technology in molecular science. Wiley Interdiscip. Rev.: Comput. Mol. Sci. 2024;14(4):e1725.
    1. Korkmaz S. Deep learning-based imbalanced data classification for drug discovery. J. Chem. Inf. Model. 2020;60(9):4180–4190. doi: 10.1021/acs.jcim.9b01162. - DOI - PubMed
    1. Gunturi S. B. Ramamurthi N. A novel approach to generate robust classification models to predict developmental toxicity from imbalanced datasets. SAR QSAR Environ. Res. 2014;25(9):711–727. doi: 10.1080/1062936X.2014.942357. - DOI - PubMed
    1. Deng A. Zhang H. Wang W. Zhang J. Fan D. Chen P. et al., Developing computational model to predict protein-protein interaction sites based on the XGBoost algorithm. Int. J. Mol. Sci. 2020;21(7):2274. doi: 10.3390/ijms21072274. - DOI - PMC - PubMed
    1. Pisner D. A. and Schnyer D. M., Support vector machine, in Machine learning, Elsevier, 2020, pp. 101–121

LinkOut - more resources