Review
. 2025 Apr 9:12:1541054.
doi: 10.3389/fnut.2025.1541054. eCollection 2025.

Thiamine, gastrointestinal beriberi and acetylcholine signaling

Affiliations
Review

Thiamine, gastrointestinal beriberi and acetylcholine signaling

Elliot Overton et al. Front Nutr. .

Abstract

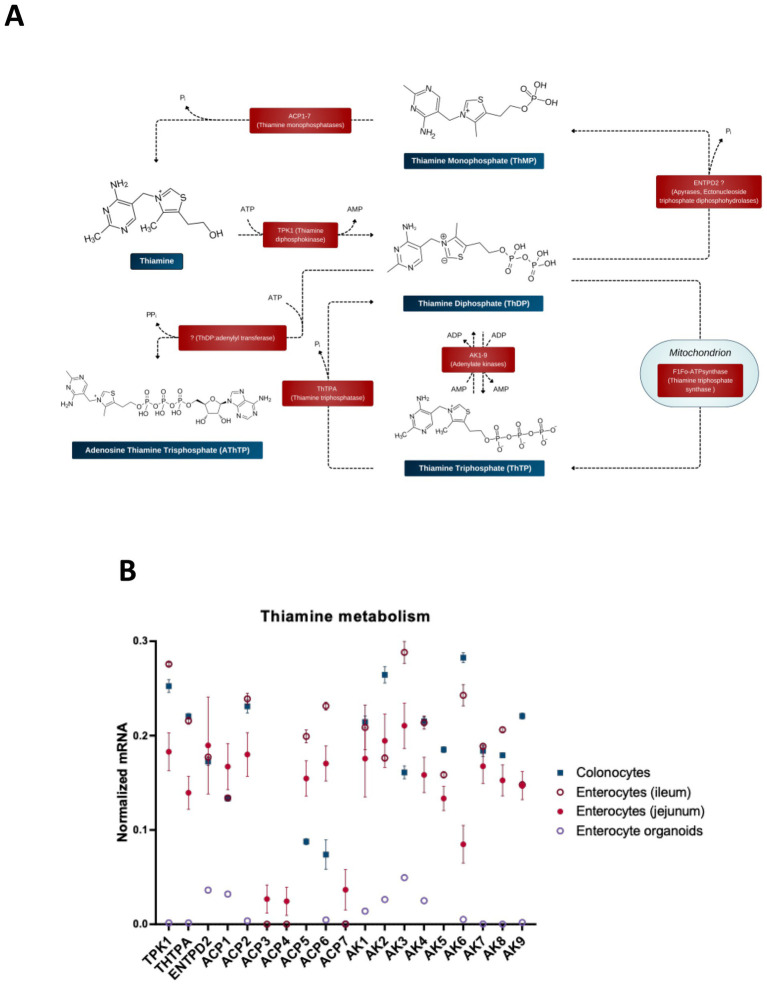
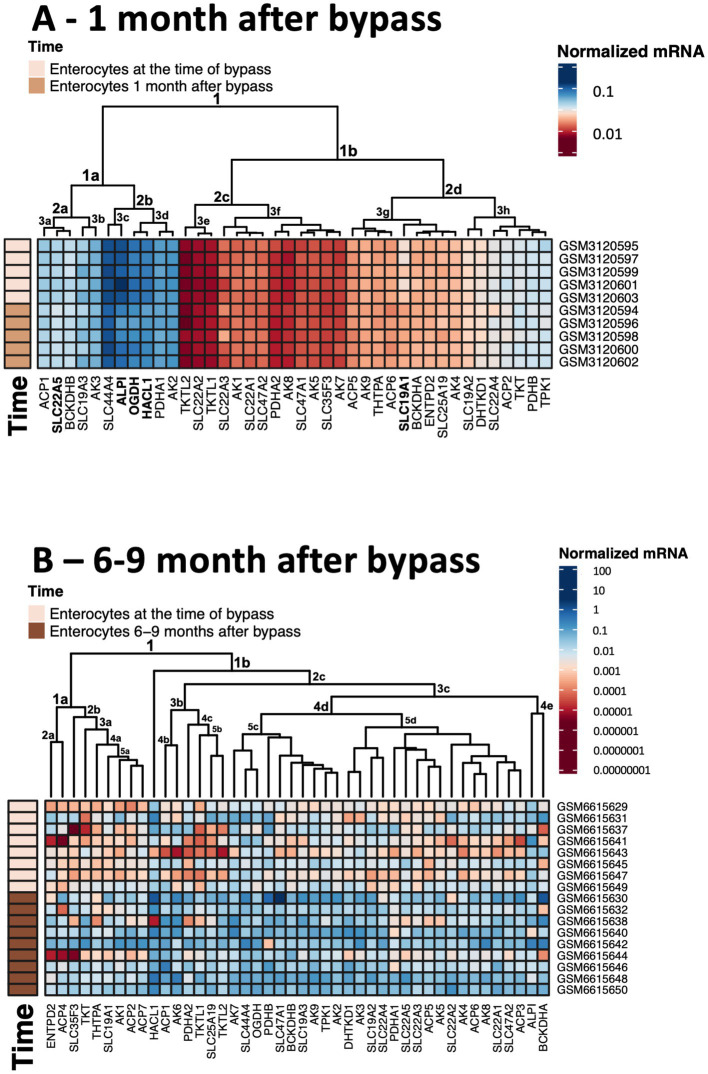
Research has highlighted numerous detrimental consequences of thiamine deficiency on digestive function. These range from impaired gastric and intestinal motility to aberrant changes in pancreatic exocrine function, gastric acidity and disturbances in gut barrier integrity and inflammation. Thiamine and its pharmacological forms, as a primary or adjunctive therapy, have been shown to improve symptoms such as nausea, constipation, dysphagia and intestinal dysmotility, in both humans and animals. This review aims to explore molecular mechanisms underlying the therapeutic action of thiamine in gastrointestinal dysfunction. Our analysis demonstrates that thiamine insufficiency restricted to the gastrointestinal system, i.e., lacking well-known symptoms of dry and wet beriberi, may arise through (i) a disbalance between the nutrient influx and efflux in the gastrointestinal system due to increased demands of thiamine by the organism; (ii) direct exposure of the gastrointestinal system to oral drugs and gut microbiome, targeting thiamine-dependent metabolism in the gastrointestinal system in the first line; (iii) the involvement of thiamine in acetylcholine (ACh) signaling and cholinergic activity in the enteric nervous system and non-neuronal cells of the gut and pancreas, employing both the coenzyme and non-coenzyme actions of thiamine. The coenzyme action relies on the requirement of the thiamine coenzyme form - thiamine diphosphate - for the production of energy and acetylcholine (ACh). The non-coenzyme action involves participation of thiamine and/or derivatives, including thiamine triphosphate, in the regulation of ACh synaptic function, consistent with the early data on thiamine as a co-mediator of ACh in neuromuscular synapses, and in allosteric action on metabolic enzymes. By examining the available evidence with a focus on the gastrointestinal system, we deepen the understanding of thiamine's contribution to overall gastrointestinal health, highlighting important implications of thiamine-dependent mechanisms in functional gastrointestinal disorders.

Keywords: acetylcholine; functional gastrointestinal disorder; gastrointestinal beriberi; intestinal ThDP-dependent enzymes; intestinal metabolism of thiamine; intestinal transport of thiamine; thiamine.


Conflict of interest statement

EO is an owner of a nutraceutical company that sells vitamin supplements including thiamine. The remaining authors declare that the research was conducted in the absence of any commercial or financial relationships that could be construed as a potential conflict of interest. The author(s) declared that they were an editorial board member of Frontiers, at the time of submission. This had no impact on the peer review process and the final decision.

Figures

Figure 1
Figure 1
Coenzyme role of ThDP in metabolism of the gut cells. (A) Metabolic pathways involving enzymes that use the coenzyme derivative of thiamine, thiamine diphosphate (ThDP). (B) The relative abundance of mRNAs for the ThDP-dependent enzymes in different cells of intestine (colonocytes, enterocytes of ileum, enterocytes of jejunum) and in enterocyte organoids. The transcript signals for the genes of interest are normalized to the sum of the average mRNA signals of GAPDH, ACTB and TUBA1A as described earlier (149). The signals of these mRNAs for the three transcripts used for the normalization, are comparable, producing similar normalization ratios of the transcripts of interest across the different GEO datasets used. Transcriptomics data is taken from the GEO database. Identificators of the assessed experiments are: colonocytes experiments GSE13367 [Platform GPL570, (HG-U133_Plus_2) Affymetrix Human Genome U133 Plus 2.0 Array, 10 datasets: GSM337520, GSM337526, GSM337529, GSM337530, GSM337532, GSM337533, GSM337537, GSM337539, GSM337540, GSM337544] and GSE30292 [Platform GPL570, (HG-U133_Plus_2) Affymetrix Human Genome U133 Plus 2.0 Array, 3 datasets: GSM750882, GSM750883, GSM750884]; jejunum enterocytes experiments GSE214758 [Platform GPL20795, HiSeq X Ten (Homo sapiens), 9 datasets: GSM6615629, GSM6615631, GSM6615633, GSM6615637, GSM6615641, GSM6615643, GSM6615645, GSM6615647, GSM6615649], GSE113819 {Platform GPL17586 (HTA-2_0) Affymetrix Human Transcriptome Array 2.0 [transcript (gene) version], 5 datasets: GSM3120595, GSM3120597, GSM3120599, GSM3120601, GSM3120603} and GSE30292 [Platform GPL570, (HG-U133_Plus_2) Affymetrix Human Genome U133 Plus 2.0 Array, 2 datasets: GSM750891, GSM750892]; ileum enterocytes experiment GSE30292 [Platform GPL570, (HG-U133_Plus_2) Affymetrix Human Genome U133 Plus 2.0 Array, 3 datasets: SM750888, GSM750889, GSM750890]; enterocyte organoid experiment GSE242765 [Platform GPL18573, Illumina NextSeq 500 (Homo sapiens), 1 dataset GSM7770156]. Normalized mRNA levels from all the datasets for the same cell type are averaged, and the data are shown as mean ± SEM.
Figure 2
Figure 2
Transporters of thiamine and its derivatives in the gut cells. (A) Schematic presentation of the transport processes through transporters expressed in the gut cells. (B) The relative abundance of mRNAs for the transporters of thiamine and its derivatives in different intestinal cells (colonocytes, enterocytes of ileum, enterocytes of jejunum) and in enterocyte organoids. The normalized mRNA signals are calculated as described in the legend to Figure 1 using the same datasets. The data are shown as mean ± SEM.
Figure 3
Figure 3
Enzymatic transformations of thiamine and its derivatives in the gut cells. (A) Schematic presentation of the reactions and available information on their catalysts. (B) The relative abundance of mRNAs for the enzymes of thiamine metabolism in different intestinal cells (colonocytes, enterocytes of ileum, enterocytes of jejunum) and in enterocyte organoids. The normalized mRNA signals are calculated as described in the legend to Figure 1 using the same datasets. The data are shown as mean ± SEM.
Figure 4
Figure 4
Changes in the averaged levels of mRNA for proteins of thiamine-dependent metabolism after gastric bypass. The relative abundance of mRNAs for the ThDP-dependent enzymes, thiamine transporters and enzymes of thiamine metabolism in jejunum enterocytes before and after gastric bypass is shown. The normalized mRNA signals are calculated as described in the legend to Figure 1. The data are shown as mean ± SEM. (A) Experiment GSE113819 {Platform GPL17586 (HTA-2_0) Affymetrix Human Transcriptome Array 2.0 [transcript (gene) version], 5 datasets for enterocytes before bypass: GSM3120595, GSM3120597, GSM3120599, GSM3120601, GSM3120603 - and 5 datasets for enterocytes 1 month after bypass: GSM3120594, GSM3120596, GSM3120598, GSM3120600, GSM3120602}. (B) Experiment GSE214758 [Platform GPL20795, HiSeq X Ten (Homo sapiens), 9 datasets for enterocytes before bypass: GSM6615629, GSM6615631, GSM6615633, GSM6615637, GSM6615641, GSM6615643, GSM6615645, GSM6615647, GSM6615649 - and 9 datasets for enterocytes 6–9 months after bypass: GSM6615630, GSM6615632, GSM6615638, GSM6615640, GSM6615642, GSM6615644, GSM6615646, GSM6615648, GSM6615650].
Figure 5
Figure 5
Heatmaps showing transcriptomics changes in the thiamine-dependent metabolism after gastric bypass. The transcriptomics experiments are identified in Figure 4. The normalized mRNA signals for the enzymes of thiamine-dependent metabolism in jejunum enterocytes before and after gastric bypass are shown in decimal logarithm scale according to the color code legend accompanying each heatmap. The heatmaps are produced using R program. (A) The normalized mRNA signals before and 1 month after gastric bypass. (B) The normalized mRNA signals before and 6–9 months after gastric bypass. The dataset GSM6615633 is excluded, as many transcripts are not identified in this experiment.

Similar articles

Cited by

References

    1. Wang Y, Huang Y, Chase RC, Li T, Ramai D, Li S, et al. . Global burden of digestive diseases: A systematic analysis of the global burden of diseases study, 1990 to 2019. Gastroenterology. (2023) 165:773–783.e15. doi: 10.1053/j.gastro.2023.05.050, PMID: - DOI - PubMed
    1. Peery AF, Crockett SD, Murphy CC, Jensen ET, Kim HP, Egberg MD, et al. . Burden and cost of gastrointestinal, liver, and pancreatic diseases in the United States: update 2021. Gastroenterology. (2022) 162:621–44. doi: 10.1053/j.gastro.2021.10.017, PMID: - DOI - PMC - PubMed
    1. Huang Z, Li Y, Park H, Ho M, Bhardwaj K, Sugimura N, et al. . Unveiling and harnessing the human gut microbiome in the rising burden of non-communicable diseases during urbanization. Gut Microbes. (2023) 15:2237645. doi: 10.1080/19490976.2023.2237645, PMID: - DOI - PMC - PubMed
    1. Rome IV. Criteria. Rome Found Available at: https://theromefoundation.org/rome-iv/rome-iv-criteria/ (Accessed October 31, 2024).
    1. Drossman DA. Functional gastrointestinal disorders: history, pathophysiology, clinical features, and Rome IV. Gastroenterology. (2016) 150:1262–1279.e2. doi: 10.1053/j.gastro.2016.02.032, PMID: - DOI - PubMed

LinkOut - more resources