

Dietary supplementation with Chinese herbal mixture extracts enhances growth performance, immunity, antioxidant capacity, and intestinal microbiota function in calves
- PMID: 40271489
- PMCID: PMC12015676
- DOI: 10.3389/fvets.2025.1530124
Dietary supplementation with Chinese herbal mixture extracts enhances growth performance, immunity, antioxidant capacity, and intestinal microbiota function in calves
Abstract
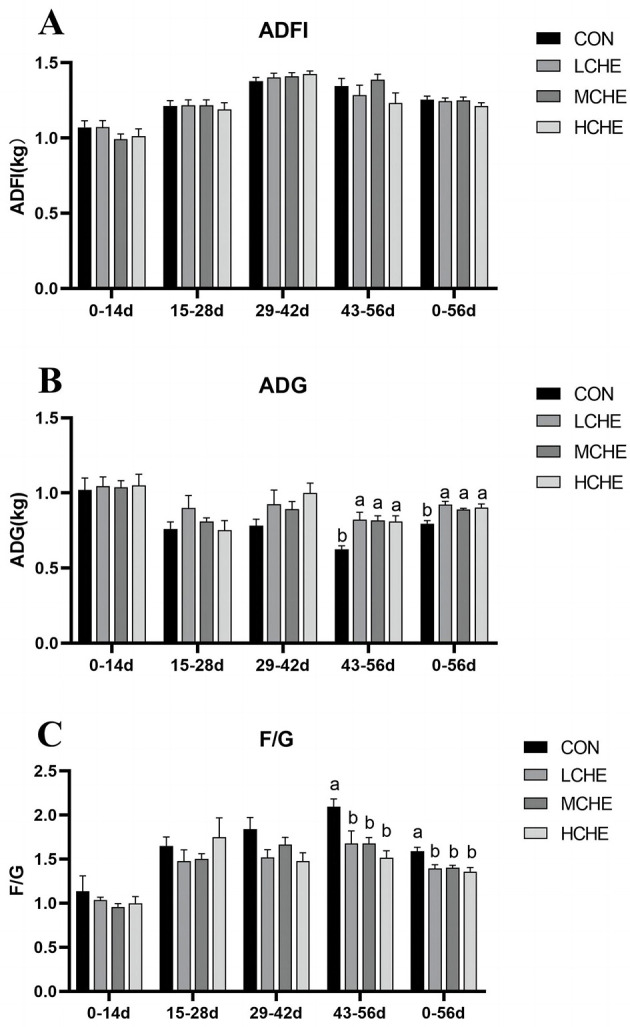
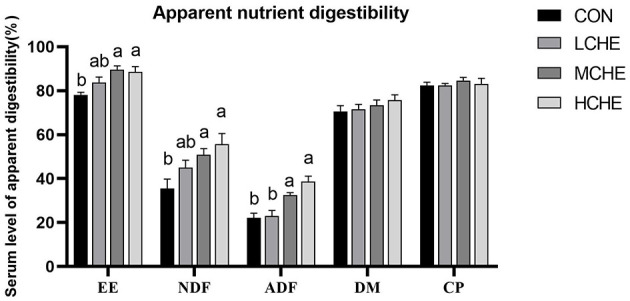
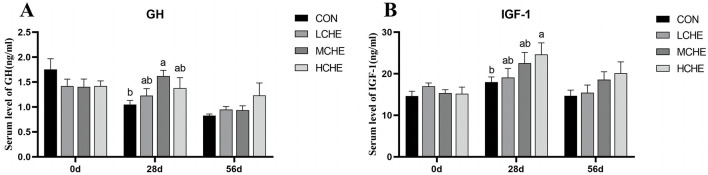
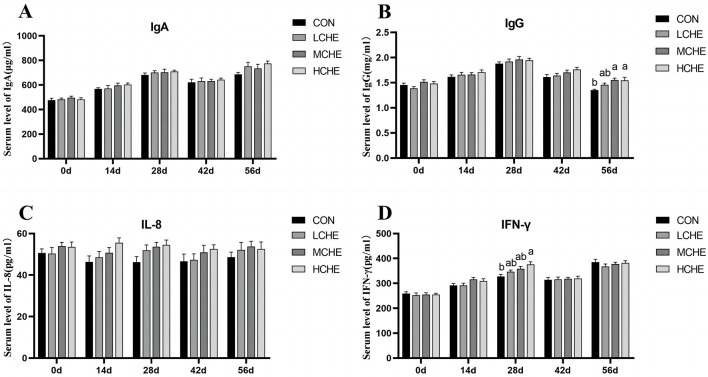
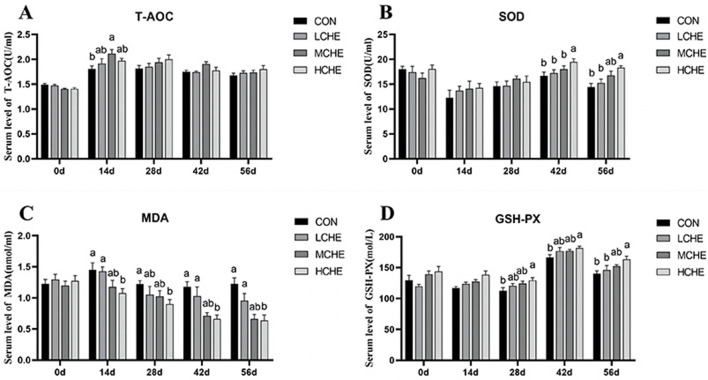
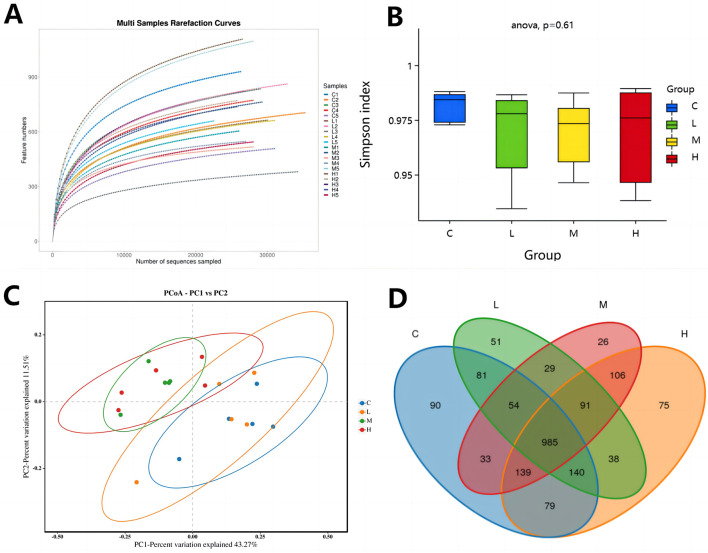
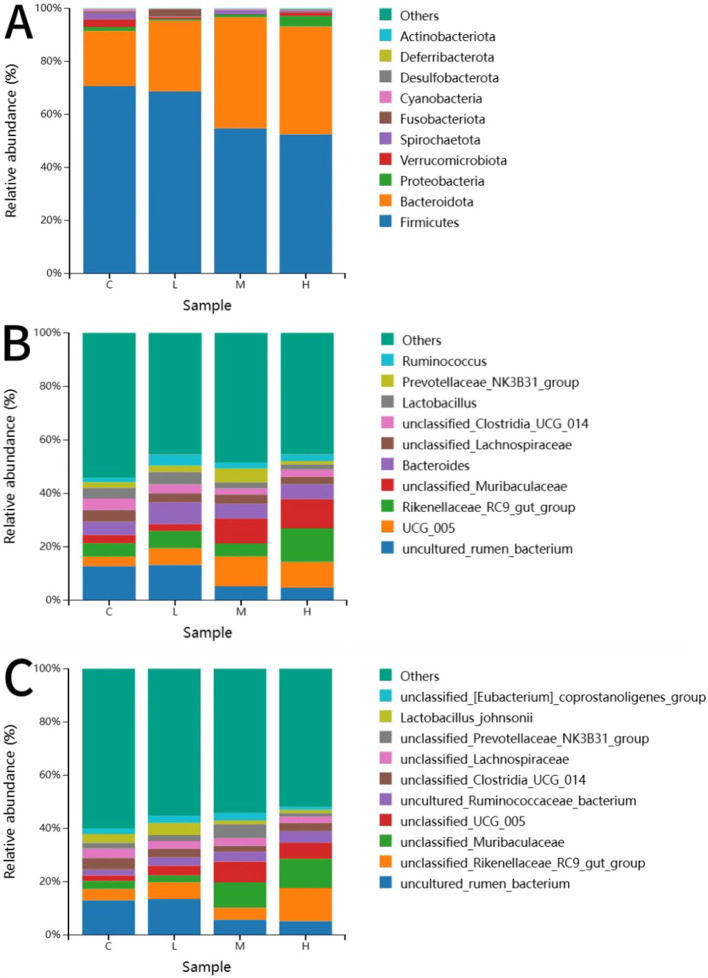
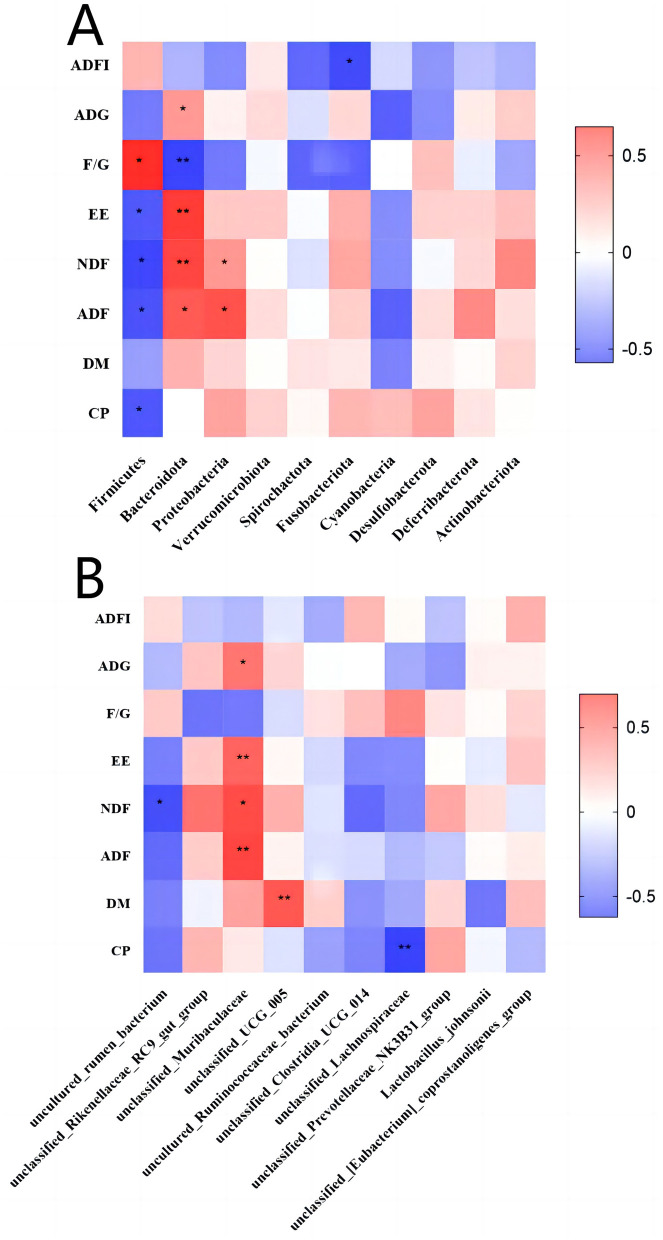
This study examined the effects of dietary supplementation with Chinese herbal mixture extracts (CHE) on growth performance, Immunity, antioxidant capacity, and gut microbiota composition in dairy calves. CHE is a compound extracts powder composed of Honeysuckle, Astragalus, Officinal magnolia bark, and Tangerine peel. Forty calves were randomly assigned to four groups: basal diet (CON), basal diet + 0.1% CHE (LCHE), basal diet + 0.2% CHE (MCHE), and basal diet + 0.4% CHE (HCHE). The experiment was conducted for 56 days with daily observations, bi-weekly weighing, blood sampling, and fecal collection toward the end. The addition of the CHE group significantly increased the average daily weight gain (ADG) and decreased the feed/gain ratio (F/G) compared to the CON group (p < 0.05). The apparent digestibility of crude fat, neutral detergent fiber, and acid detergent fiber was higher in HCHE and MCHE groups (p < 0.05). Serum GH and IGF-1 levels increased in MCHE and HCHE groups (p < 0.05). The blood biochemical analysis revealed that the levels of CA and GLU in the MCHE group were higher than those in the CON group, while remaining within the normal physiological range. Both the IgG and IFN-γ levels and the serum antioxidant levels were significantly increased in the CHE supplementation group compared with the control group (p < 0.05). High-throughput 16S rRNA sequencing revealed changes in gut microbiota, with increased unclassified Muribaculaceae and UCG-005 species in MCHE and HCHE groups (p < 0.05). In conclusion, CHE supplementation enhanced digestion, growth performance, immunity, and gut microbiota balance in calves without toxic side effects.Considering both the economic benefits and the effects of the additive, a clinical dosage of 0.2% CHE additive may be recommended.
Keywords: Chinese herbal mixture extracts; antioxidant capacity; calves; growth performance; immunity; intestinal microbiota.
Copyright © 2025 Zhang, Shen, Wu, Dang, Dong and Zhang.
Conflict of interest statement
DS was employed Gansu Qingliang Yuan Biological Medicine Co., Ltd. YW and DD were employed by Xian Caotan Animal Husbandry Co., Ltd. The remaining authors declare that the research was conducted in the absence of any commercial or financial relationships that could be construed as a potential conflict of interest.
Figures
Similar articles
-
Effects of dietary supplement with a Chinese herbal mixture on growth performance, antioxidant capacity, and gut microbiota in weaned pigs.Front Vet Sci. 2022 Aug 22;9:971647. doi: 10.3389/fvets.2022.971647. eCollection 2022. Front Vet Sci. 2022. PMID: 36072392 Free PMC article.
-
Dietary Chinese herbal mixture supplementation improves production performance by regulating reproductive hormones, antioxidant capacity, immunity, and intestinal health of broiler breeders.Poult Sci. 2024 Jan;103(1):103201. doi: 10.1016/j.psj.2023.103201. Epub 2023 Oct 21. Poult Sci. 2024. PMID: 37980727 Free PMC article.
-
Effect of a Multispecies Probiotic Mixture on the Growth and Incidence of Diarrhea, Immune Function, and Fecal Microbiota of Pre-weaning Dairy Calves.Front Microbiol. 2021 Jul 14;12:681014. doi: 10.3389/fmicb.2021.681014. eCollection 2021. Front Microbiol. 2021. PMID: 34335503 Free PMC article.
-
Effect of Dietary Benzoic Acid Supplementation on Growth Performance, Rumen Fermentation, and Rumen Microbiota in Weaned Holstein Dairy Calves.Animals (Basel). 2024 Sep 30;14(19):2823. doi: 10.3390/ani14192823. Animals (Basel). 2024. PMID: 39409772 Free PMC article.
-
Yupingfeng polysaccharide promote the growth of chickens via regulating gut microbiota.Front Vet Sci. 2024 Feb 23;11:1337698. doi: 10.3389/fvets.2024.1337698. eCollection 2024. Front Vet Sci. 2024. PMID: 38464700 Free PMC article.
References
-
- Terler G, Velik M, Poier G, Sener-Aydemir A, Klevenhusen F, Zebeli Q. Feeding concentrate with hay of different qualities modulates rumen histology, development of digestive tract as well as slaughter performance and meat quality of young dairy calves. Arch Anim Nutr. (2023) 773:171–86. 10.1080/1745039X.2023.2197633 - DOI - PubMed
-
- Shehata AA, El-Emam MMA, Gouda H, El-Said BM, Salman MB, Abd-Elfatah EB. Molecular characterization of Cryptosporidium parvum infections and analysis of hemological and biochemical changes in diarrheic pre-weaned calves in Egypt. Pak Vet J. (2024) 44:135–40. 10.29261/pakvetj/2023.071 - DOI
-
- Park S, Sun S, Kovanda L, Sokale AO, Barri A, Kim K, et al. . Effects of monoglyceride blend on systemic and intestinal immune responses, and gut health of weaned pigs experimentally infected with a pathogenic Escherichia coli. J Animal Sci Biotechnol. (2024) 151:7. 10.1186/s40104-024-01103-7 - DOI - PMC - PubMed
LinkOut - more resources
Full Text Sources
Miscellaneous