. 2025 Dec;16(1):2494039.
doi: 10.1080/21505594.2025.2494039. Epub 2025 Apr 24.

Burkholderia cenocepacia and Pseudomonas aeruginosa in dual-species models: Insights into population distribution, antibiotic susceptibility, and virulence

Affiliations

Burkholderia cenocepacia and Pseudomonas aeruginosa in dual-species models: Insights into population distribution, antibiotic susceptibility, and virulence

Júlia Alcàcer-Almansa et al. Virulence. 2025 Dec.

Abstract

Multispecies biofilms are communities composed of different microorganisms embedded in an auto-synthesized polymeric matrix. Pseudomonas aeruginosa and Burkholderia cenocepacia are two multidrug-resistant and biofilm-forming opportunistic pathogens often found in the lungs of people living with cystic fibrosis. In this context, planktonic, static, and dynamic biofilms and in vivo models of both species were optimized in this work to understand their population dynamics, disposition, virulence, and antibiotic susceptibility. From the coculture models optimized in this work, we determined that B. cenocepacia grows in a clustered, aggregative manner at the bottom layers of biofilms, in close contact with P. aeruginosa, that tends to occupy the top layers. Their coexistence increases virulence-related gene expression in both species at early stages of coinfection and in in vivo models, while there was a general downregulation of virulence-related genes after longer coexistence periods as they eventually reach a non-competitive stage during chronic infections. When evaluating antimicrobial susceptibility, a decrease of antimicrobial tolerance was observed in both species when co-cultured. These findings shed light on the differential behavior of P. aeruginosa and B. cenocepacia in dual-species systems, stressing the relevance of multispecies studies in the clinical context.

Keywords: Polymicrobial biofilm; antibiotic; biofilm spatial distribution; coinfection; gene expression; virulence.


Conflict of interest statement

No potential conflict of interest was reported by the author(s).

Figures

Figure 1.
Figure 1.
Optimization of P. aeruginosa (PA) and B. cenocepacia (BC) dual-species static biofilms. (a) Inoculum ratio effects on the resulting CFU/mL of both species in a 48 h single- (PA in green and BC in blue) and dual-species (CoPA, CoBC) biofilm. (b) Impact of different media supplements on the viability (CFU/mL) of each strain P. aeruginosa (CoPA) and B. cenocepacia (CoBC) in a 48 h dual-species biofilm. (c) Evaluation of the bacterial viability after 24, 48, 72, and 96 h of dual-species biofilm incubation in the presence or absence of 5% BSA. Asterisks show significant differences between coculture groups in (a) (one-way ANOVA), between groups vs. the control in (b) (Student’s t-test), and between each bacterium grown with and without 5% BSA at the same time point in (c) (Student’s t-test). In all cases, non-significant differences are not shown (n = 6).
Figure 2.
Figure 2.
Planktonic growth dynamics in coculture of P. aeruginosa (PA) and B. cenocepacia (BC). (a) and (b): CFU/mL obtained from each species at six different time points (0, 2, 4, 6, 8, 24, 48, and 72 h) in the absence (a) or presence (b) of 5% BSA in the media. (c) Competitive index values at 8 and 24 h of coculture with and without 5% BSA. Fluorescence microscopy images taken after 4, 6, 8, 24, 48, and 72 h of coculture in the absence (d) or presence (e) of 5% BSA in the culture media (P. aeruginosa in green and B. cenocepacia in blue). Representative images of all the experiments are displayed. Significant differences between groups with and without BSA of each species at each time point were evaluated through Student’s t-test (n = 9).
Figure 3.
Figure 3.
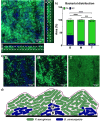
P. aeruginosa and B. cenocepacia dual-species biofilms in a dynamic system. P. aeruginosa (PA, green) and B. cenocepacia (BC, blue) were grown simultaneously in a continuous flow BiofilmChip system for 96 h, and an analysis of the bottom (B), middle (M), and top (T) sections of the biofilm was performed. (a) Composite of image slices (sum of Z stacks), with their orthogonal views. (b) Quantification of the area occupied by P. aeruginosa or B. cenocepacia at different biofilm widths. Values are indicated inside bars (PA, black and BC, white). Statistical significances were established through two-way ANOVA (n = 5). (c) Set of single representative stack images from B, M, and T of the biofilm. (d) Diagram of the bacterial distribution in a dynamic biofilm created with Biorender.
Figure 4.
Figure 4.
Bacterial distribution on a dynamic BiofilmChip over time. CLSM images were taken at the indicated time points, where P. aeruginosa (PA) is shown in green, and B. cenocepacia (BC) is shown in blue. (a) The “full image view” row shows the sum of stacks at each time point. (b) The “aggregate zoom-in” row contains a magnified image of the red square in (a). (c) The “3D aggregate” row contains the 3D surface representations of aggregate zoom-ins, where the red line represents the cutting line to create the “3D sections” shown on the fourth row (d). (e) The “%” row represents the percentage of biomass of each species at each time point.
Figure 5.
Figure 5.
Quantitative analysis of P. aeruginosa and B. cenocepacia ciprofloxacin and tobramycin susceptibility in single- vs. dual-species biofilms. Data are represented as the log Fold change of the CFU/mL after 14 h treatment compared to the untreated group. Low doses (LD) (solid bars) and high doses (HD) (striped bars) were used for each antibiotic. (a) and (b) Ciprofloxacin and tobramycin susceptibility quantification. LD corresponds to 10 and 30 μg/mL, and HD corresponds to 200 and 1000 μg/mL, respectively. (c) Antibiotic concentration standardized by the MIC for each antibiotic at low dose (RatioLD) and high dose (RatioHD). Significant differences between monoculture (P. aeruginosa, PA and B. cenocepacia, BC) vs. coculture (CoPA and CoBC for P. aeruginosa in coculture and B. cenocepacia in coculture, respectively) of each species and for each treatment were evaluated through Student’s t-test, and differences between control and treated groups were evaluated through one-way ANOVA (n = 6). Non-significant differences are not shown.
Figure 6.
Figure 6.
Kaplan−Meier survival curves after infection with B. cenocepacia (BC), P. aeruginosa (PA), and their coinfection (Co). Infection doses (CFU/larvae) for the shown graph are PA: <10, BC: 106, and in the coinfection group: CoPA: <10, CoBC: 106. The median survival time (MST) is indicated with a grey dashed line, and the corresponding MST for each group is indicated in the top right table. Statistical significances were established through a log-rank test (Mantel−Cox survival test) comparing each single-infected group with the coinfected group (n = 10).
Figure 7.
Figure 7.
Bacterial virulence gene expression in planktonic cultures after 15 h (a and b), static biofilms after 15 and 48 h (c and d), dynamic biofilms after 96 h (e and f), and G. mellonella 15 h post-infection (g and h). Data are represented as mean ± SD of the Fold change expression of coculture groups compared to single-culture groups. P. aeruginosa and B. cenocepacia virulence-related genes are shown in green or blue, respectively. Statistical significances were evaluated through a one-way ANOVA by comparing the ∆CT of cocultures vs. single cultures.

References

    1. Ciofu O, Tolker-Nielsen T.. Tolerance and resistance of Pseudomonas aeruginosa biofilms to antimicrobial agents- how P. aeruginosa can escape antibiotics. Front Microbiol. 2019;10:913. doi: 10.3389/fmicb.2019.00913 - DOI - PMC - PubMed
    1. Liang Z, Nilsson M, Kragh KN, et al. The role of individual exopolysaccharides in antibiotic tolerance of Pseudomonas aeruginosa aggregates [original research]. Front Microbiol. 2023;14:14. doi: 10.3389/fmicb.2023.1187708 - DOI - PMC - PubMed
    1. Yan J, Bassler BL.. Surviving as a community: antibiotic tolerance and persistence in bacterial biofilms. Cell Host Microbe. 2019;26(1):15–16. doi: 10.1016/j.chom.2019.06.002 - DOI - PMC - PubMed
    1. Burmølle M, Thomsen TR, Fazli M, et al. Biofilms in chronic infections - a matter of opportunity - monospecies biofilms in multispecies infections. FEMS Immunol Med Microbiol. 2010;59(3):324–336. doi: 10.1111/j.1574-695X.2010.00714.x - DOI - PubMed
    1. Scotet V, L’Hostis C, Férec C. The changing epidemiology of cystic fibrosis: incidence, survival and impact of the CFTR gene discovery. Genes (Basel). 2020;11(6):589. doi: 10.3390/genes11060589 - DOI - PMC - PubMed

Publication types

MeSH terms

Substances