

A human-ACE2 knock-in mouse model for SARS-CoV-2 infection recapitulates respiratory disorders but avoids neurological disease associated with the transgenic K18-hACE2 model
- PMID: 40272151
- PMCID: PMC12077128
- DOI: 10.1128/mbio.00720-25
A human-ACE2 knock-in mouse model for SARS-CoV-2 infection recapitulates respiratory disorders but avoids neurological disease associated with the transgenic K18-hACE2 model
Abstract
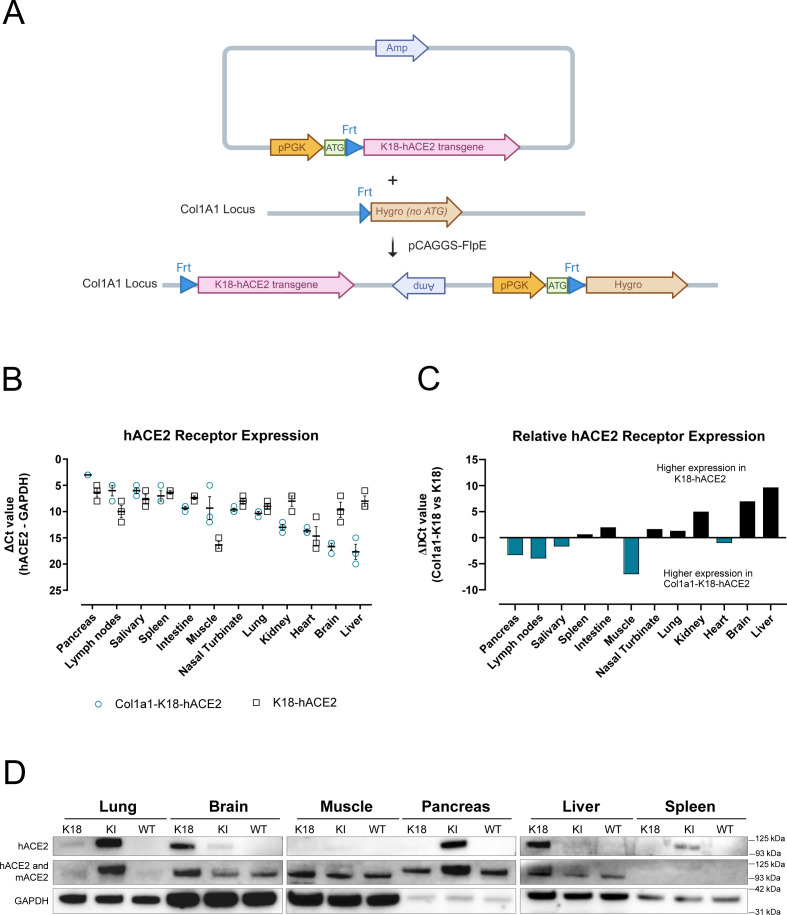
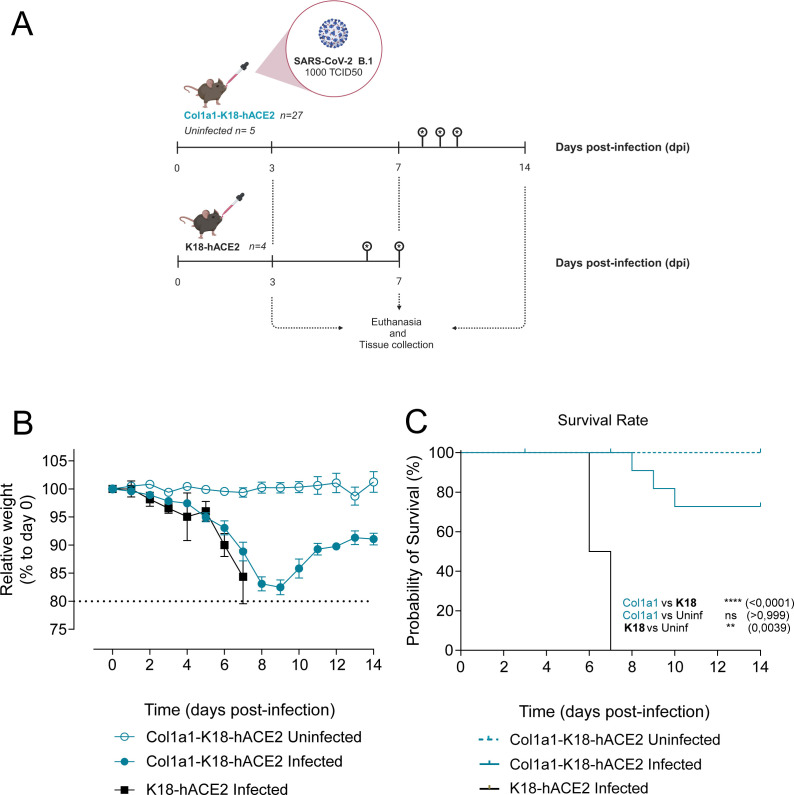
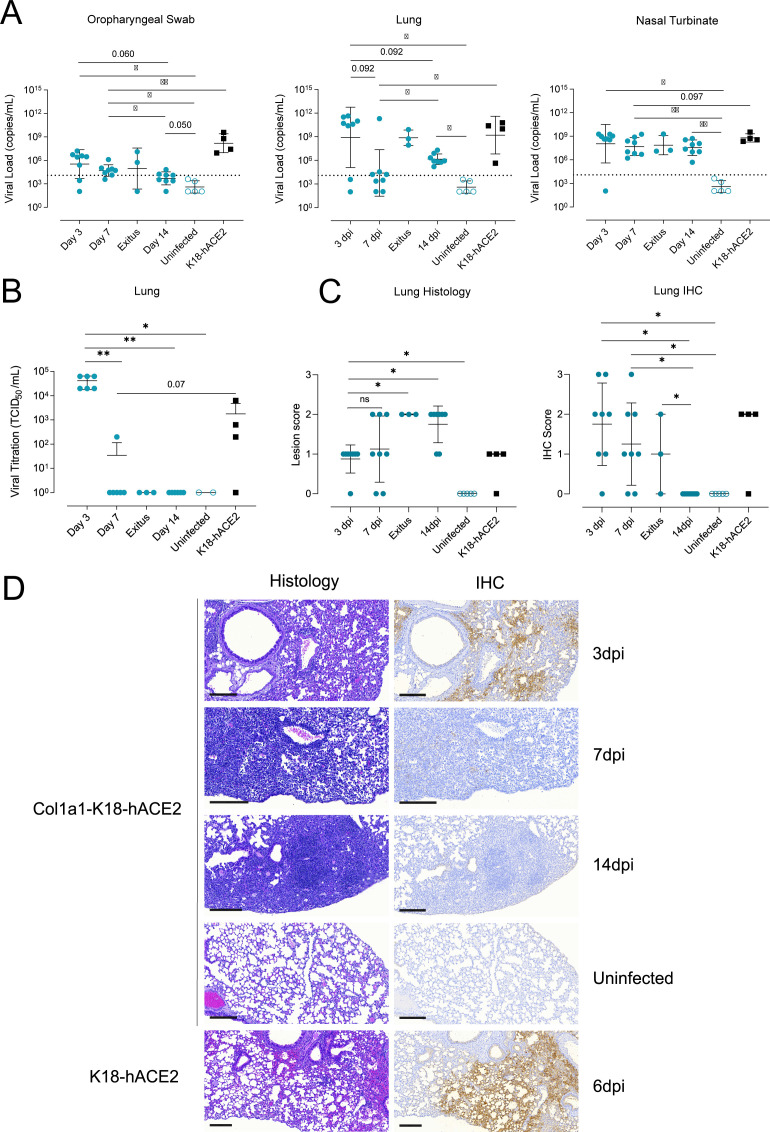
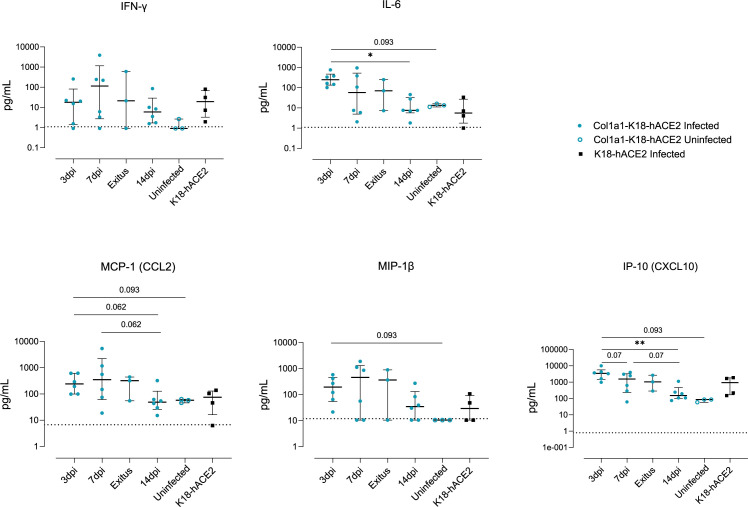
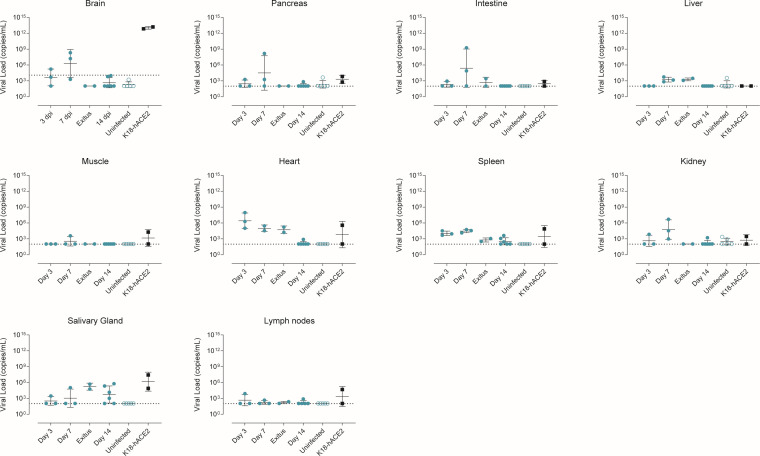
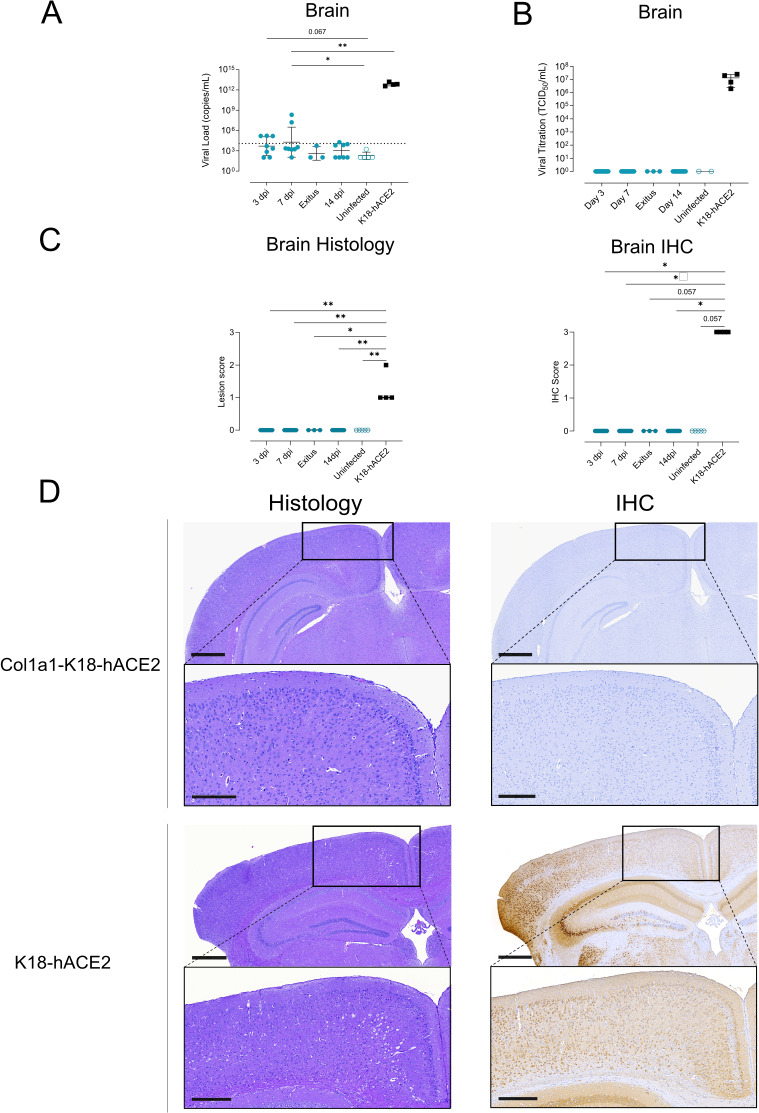
Animal models have been instrumental in elucidating the pathogenesis of severe acute respiratory syndrome coronavirus 2 (SARS-CoV-2) infection and in testing coronavirus disease 2019 (COVID-19) vaccines and therapeutics. Wild-type (WT) mice are not susceptible to many SARS-CoV-2 variants, and therefore, transgenic K18-hACE2 mice have emerged as a standard model system. However, this model is characterized by a severe disease, particularly associated with neuroinfection, which leads to early humane endpoint euthanasia. Here, we established a novel knock-in (KI) mouse model by inserting the original K18-hACE2 transgene into the collagen type I alpha chain (COL1A1) locus using a recombinase-mediated cassette exchange (RMCE) system. Once the Col1a1-K18-hACE2 mouse colony was established, animals were challenged with a B.1 SARS-CoV-2 (D614G) isolate and were monitored for up to 14 days. Col1a1-K18-hACE2 mice exhibited an initial weight loss similar to the K18-hACE2 transgenic model but did not develop evident neurologic clinical signs. The majority of Col1a1-K18-hACE2 mice did not reach the pre-established humane endpoint, showing a progressive weight gain 9 days postinfection (dpi). Importantly, despite this apparent milder pathogenicity of the virus in this mouse model compared to the K18-hACE2 transgenic model, high levels of viral RNA were detected in the lungs, oropharyngeal swab, and nasal turbinates. Moreover, the remaining lesions and inflammation in the lungs were still observed 14 dpi. In contrast, although low-level viral RNA could be detected in a minority of Col1a1-K18-hACE2 animals, no brain lesions were observed at any timepoint. Overall, Col1a1-K18-hACE2 mice constitute a new model for investigating SARS-CoV-2 pathogenesis and treatments, with potential implications for studying long-term COVID-19 sequelae.IMPORTANCEK18-hACE2 mice express high levels of the human protein angiotensin-converting enzyme 2 (ACE2), the receptor for severe acute respiratory syndrome coronavirus 2 (SARS-CoV-2), and are therefore susceptible to infection by this virus. These animals have been crucial to understanding viral pathogenesis and to testing coronavirus disease 2019 (COVID-19) vaccines and antiviral drugs. However, K18-hACE2 often dies after infection with initial SARS-CoV-2 variants, likely due to a massive brain infection that does not occur in humans. Here, we used a technology known as knock-in (KI) that allows for the targeted insertion of a gene into a mouse, and we have generated a new human ACE2 (hACE2) mouse. We have characterized this new animal model demonstrating that, upon challenge with SARS-CoV-2, the virus replicates in the respiratory tract, damaging lung tissue and causing inflammation. In contrast to K18-hACE2 mice, only limited or no brain infection could be detected in this new model. After 14 days, most animals recovered from the infection, although lung tissue lesions were still observed. This new model could be instrumental for the study of specific disease aspects such as post-COVID-19 condition, sequelae, and susceptibility to reinfection.
Keywords: animal model; lung damage; lung inflammation; neuroinvasion; post-COVID condition.
Conflict of interest statement
J.B. has received institutional funding from Grífols, Nesapor Europe, HIPRA, and MSD. Unrelated to the submitted work, J.B. and J.C. are founders and shareholders of AlbaJuna Therapeutics, SL. B.C. is founder and shareholder of AlbaJuna Therapeutics, SL, and AELIX Therapeutics, SL.
Figures
Similar articles
-
SARS-CoV-2 Causes Lung Infection without Severe Disease in Human ACE2 Knock-In Mice.J Virol. 2022 Jan 12;96(1):e0151121. doi: 10.1128/JVI.01511-21. Epub 2021 Oct 20. J Virol. 2022. PMID: 34668780 Free PMC article.
-
Severe Acute Respiratory Syndrome Coronavirus 2 Variant Infection Dynamics and Pathogenesis in Transgenic K18-hACE2 and Inbred Immunocompetent C57BL/6J Mice.Viruses. 2025 Mar 30;17(4):500. doi: 10.3390/v17040500. Viruses. 2025. PMID: 40284943 Free PMC article.
-
The K18-Human ACE2 Transgenic Mouse Model Recapitulates Non-severe and Severe COVID-19 in Response to an Infectious Dose of the SARS-CoV-2 Virus.J Virol. 2022 Jan 12;96(1):e0096421. doi: 10.1128/JVI.00964-21. Epub 2021 Oct 20. J Virol. 2022. PMID: 34668775 Free PMC article.
-
K18- and CAG-hACE2 Transgenic Mouse Models and SARS-CoV-2: Implications for Neurodegeneration Research.Molecules. 2022 Jun 28;27(13):4142. doi: 10.3390/molecules27134142. Molecules. 2022. PMID: 35807384 Free PMC article. Review.
-
SARS-CoV replication and pathogenesis in an in vitro model of the human conducting airway epithelium.Virus Res. 2008 Apr;133(1):33-44. doi: 10.1016/j.virusres.2007.03.013. Epub 2007 Apr 23. Virus Res. 2008. PMID: 17451829 Free PMC article. Review.
Cited by
-
Spatiotemporal Characterization of Changes in the Respiratory Tract and the Nervous System, Including the Eyes in SARS-CoV-2-Infected K18-hACE2 Mice.Viruses. 2025 Jul 9;17(7):963. doi: 10.3390/v17070963. Viruses. 2025. PMID: 40733579 Free PMC article.
References
-
- Hassan AO, Case JB, Winkler ES, Thackray LB, Kafai NM, Bailey AL, McCune BT, Fox JM, Chen RE, Alsoussi WB, Turner JS, Schmitz AJ, Lei T, Shrihari S, Keeler SP, Fremont DH, Greco S, McCray PB, Perlman S, Holtzman MJ, Ellebedy AH, Diamond MS. 2020. A SARS-CoV-2 infection model in mice demonstrates protection by neutralizing antibodies. Cell 182:744–753. doi:10.1016/j.cell.2020.06.011 - DOI - PMC - PubMed
-
- Tseng C-TK, Huang C, Newman P, Wang N, Narayanan K, Watts DM, Makino S, Packard MM, Zaki SR, Chan T-S, Peters CJ. 2007. Severe acute respiratory syndrome coronavirus infection of mice transgenic for the human angiotensin-converting enzyme 2 virus receptor. J Virol 81:1162–1173. doi:10.1128/JVI.01702-06 - DOI - PMC - PubMed
-
- Jiang R-D, Liu M-Q, Chen Y, Shan C, Zhou Y-W, Shen X-R, Li Q, Zhang L, Zhu Y, Si H-R, Wang Q, Min J, Wang X, Zhang W, Li B, Zhang H-J, Baric RS, Zhou P, Yang X-L, Shi Z-L. 2020. Pathogenesis of SARS-CoV-2 in transgenic mice expressing human angiotensin-converting enzyme 2. Cell 182:50–58. doi:10.1016/j.cell.2020.05.027 - DOI - PMC - PubMed
MeSH terms
Substances
Grants and funding
LinkOut - more resources
Full Text Sources
Medical
Molecular Biology Databases
Miscellaneous
