. 2025 May;45(5):e70110.
doi: 10.1111/liv.70110.

Anti-Tumour Immunity Relies on Targeting Tissue Homeostasis Through Monocyte-Driven Responses Rather Than Direct Tumour Cytotoxicity

Affiliations

Anti-Tumour Immunity Relies on Targeting Tissue Homeostasis Through Monocyte-Driven Responses Rather Than Direct Tumour Cytotoxicity

Nicholas Koelsch et al. Liver Int. 2025 May.

Abstract

Background: Metabolic dysfunction-associated fatty liver disease (MAFLD) can progress to hepatocellular carcinoma (HCC), yet the immune mechanisms driving this transition remain unclear.

Methods: In a chronic Western diet (WD) mouse model, we performed single-nuclei RNA sequencing to track MAFLD progression into HCC and subsequent tumour inhibition upon dietary correction.

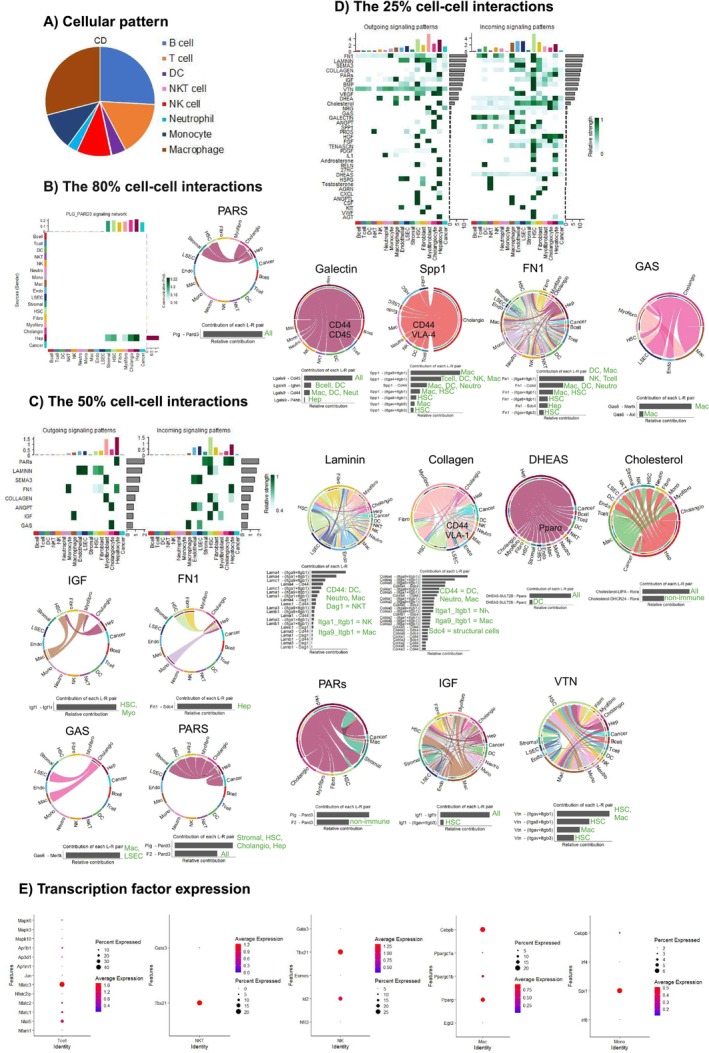
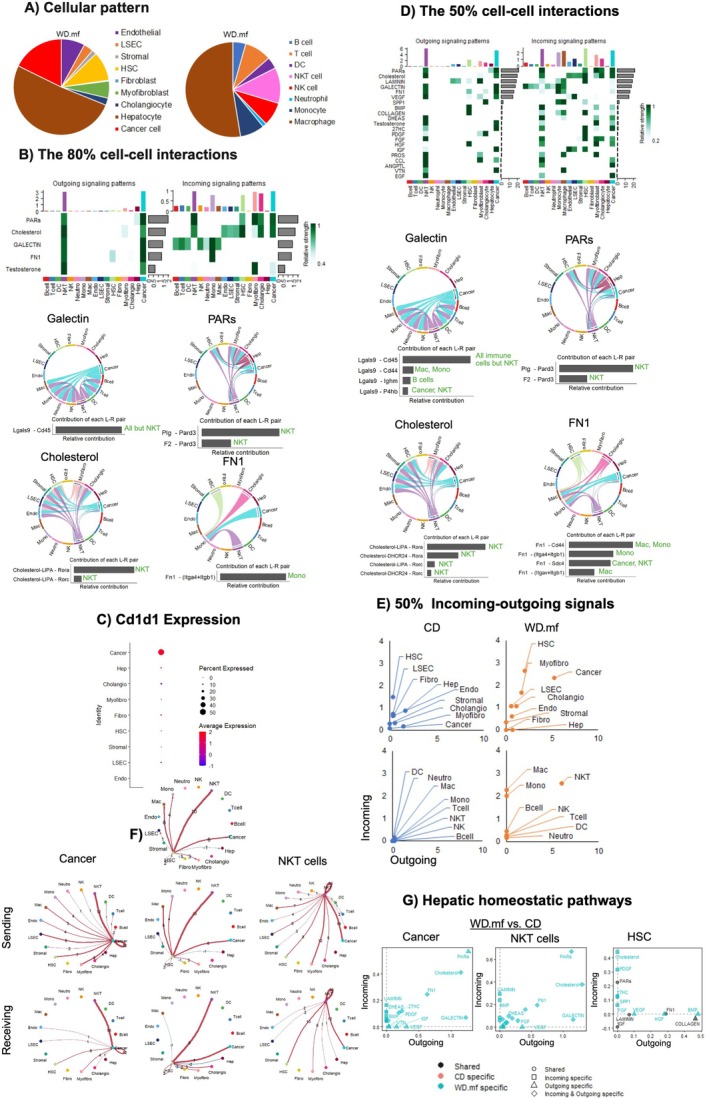
Results: Carcinogenesis begins during MAFLD, with tumour cells entering dormancy when HCC is mitigated. Rather than purely tolerogenic, the liver actively engages immune responses targeting myofibroblasts, fibroblasts and hepatocytes to maintain tissue homeostasis. Cytotoxic cells contribute to the turnover of liver cells but do not primarily target the tumour. NKT cells predominate under chronic WD, while monocytes join them in HCC progression on a WD. Upon dietary correction, monocyte-driven immunity confers protection against HCC through targeting tissue homeostatic pathways and antioxidant mechanisms. Crucially, liver tissue response-not merely immune activation-dictates whether tumours grow or regress, emphasising the importance of restoring liver tissue integrity. Also, protection against HCC is linked to a distinct immunological pattern, differing from healthy controls, underscoring the need for immune reprogramming.

Conclusion: These findings reveal the dual roles of similar pathways, where immune patterns targeting different cells shape distinct outcomes. Restoring tissue homeostasis and regeneration creates a tumour-hostile microenvironment, whereas tumour-directed approaches fail to remodel the TME. This underscores the need for tissue remodelling strategies in cancer prevention and treatment.

Keywords: cancer dormancy; hepatocellular carcinoma; inflammation; network medicine; nonalcoholic fatty liver disease; stromal cells; systems immunology.


Conflict of interest statement

A.J.S. and F.M. hold a patent on the DIAMOND mouse model, PCT/US2016/056506. All other authors do not have any competing interest.

Figures

FIGURE 1
FIGURE 1
Carcinogenic events take place prior to HCC and remain dormant during recovery from HCC. (A) Representative liver images and histological Haematoxylin and Eosin (H&E) staining from mice with MAFLD (WD.mf; n = 2), WD‐induced HCC tumours (WD.t; n = 3) and those that underwent dietary intervention and showed HCC tumours (RD.t; n = 2) or those that did not (RD.n; n = 3). (B) UMAP of hepatic immune and nonimmune cells (upper) annotated by scSorter after removing all cells classified as “Unknown”, and quantified nonimmune cell proportions (lower); legend abbreviations include dendritic cell (DC), Neutrophil (Neutro), Monocyte (Mono), Macrophage (Mac), Endothelial cell (Endo), Liver sinusoid endothelial cell (LSEC), hepatic stellate cell (HSC), Fibroblast (Fibro), Myofibroblast (Myofibro), Cholangiocyte (Cholangio) and Hepatocyte (Hep). (C) Violin Plots showing log‐transformed average transcript expression of marker genes in cancer cell and hepatocyte populations such as Hnf4α, Rb1, Afp and Gpc3. (D) Violin Plot showing log‐transformed average transcript expression in the Gpc3‐filtered fraction of hepatocyte and cancer cells for each group. (E) Quantification of the average transcript expression level of Hnf4α + cells in the cancer cell population in each group with standard error mean calculated and applied as error bars across replicates. (F) DotPlots showing the average expression level and percentage of cell populations expressing Mki67 (Ki67) (upper) in cancer cell (left) and hepatocyte (right) populations for the CD, WD.mf and RD.n groups, along with the average transcript expression in both cell populations after filtering for cells expressing Ki67 > 0 (lower) with standard error mean calculated and applied as error bars across replicates.
FIGURE 2
FIGURE 2
Hepatic cells induce macrophage and monocyte‐dominated immune responses through integrins for liver tissue integrity and homeostasis. (A) Immune cell proportions quantified and normalised to 100% in the CD group (n = 2). (B) CellChat analysis heatmap showing results from 80% threshold analysis for Ligand (L) and Receptor (R) interactions in the CD group and representative chord diagram showing signalling directionality in the PARs pathway and the L‐R contributions. (C) CellChat analysis heatmap portraying results from 50% threshold analysis for L‐R interactions in the CD group (upper), and representative chord diagrams showing signalling directionality in the IGF, FN1, GAS and PARs dominant pathways and their L‐R contributions (lower). (D) CellChat analysis heatmap portraying results from 25% threshold analysis of L‐R interactions in the CD group (upper), and the representative subdominant signalling chord diagrams detected for Galectin, Spp1, FN1, GAS, Laminin, Collagen, DHEAS, Cholesterol, PARs, IGF and VTN pathways and their L‐R contributions (lower). (E) DotPlots showing the percent expression in cell populations and log‐normalised average transcript expression of transcription factors involved in activation of T cells (left), NKT cells (middle left), NK cells (middle), Macrophages (middle right) and Monocytes (right). Green text in L‐R contributions denotes the cell type expressing receptors and Itga4+Itgb1 denotes VLA‐4.
FIGURE 3
FIGURE 3
The number and strength of ligand‐receptor interactions rather than cell‐type frequency determine the progression or inhibition of HCC. (A) Comparative 50% threshold CellChat analysis quantifying the number of inferred interactions and overall interaction strength in each group. (B) Cell‐specific frequency (left panels) and comparative analysis in each group (right panels) showing overall incoming and outgoing interaction strength values for each cell type to evaluate major contributors to signalling networks. Cancer, cancer cell; Cholangio, cholangiocytes; DC, dendritic cell; Endo, endothelial cell; Fibro, fibroblasts; Hep, hepatocytes; HSC, hepatic stellate cell; LSEC, liver sinusoidal endothelial cell; Mac, macrophage; Mono, monocytes; Myofibro, myofibroblasts; Neutro, neutrophils; Stromal, stromal cell.
FIGURE 4
FIGURE 4
NKT cells orchestrate homeostatic immune responses over cytotoxicity in cancer‐dominated networks during WD‐induced MAFLD progression. (A) Immune and nonimmune cell proportions quantified and normalised to 100% in the WD.mf group (n = 2). (B) CellChat analysis heatmap from 80% threshold results (upper) and representative chord diagrams showing signalling directionality in Cholesterol, PARs, Galectin and FN1 pathways and their L‐R contributions (lower). (C) DotPlot showing the percentage of cell population expression and log‐normalised average transcript expression of Cd1d1 in structural cells in the WD.mf group. (D) CellChat heatmap analysis of 50% cell–cell interactions portraying all detected L‐R signalling pathways (upper), and representative chord diagrams of signalling directionality in Cholesterol, PARs, Galectin and FN1 pathways and their L‐R contributions (lower). (E) Quantification of cell‐specific incoming and outgoing interaction strength in 50% CellChat analyses for nonimmune (upper panel) and immune cells (lower panel) in the CD and WD.mf groups. (F) The differential number of signalling events sent (upper row) and received (lower row) detected in HSCs, cancer cells and NKT cells encompassing 50% of cell–cell interactions during MAFLD (WD.mf) compared to the CD group, where red arrows show increased number of signalling events in WD.mf and blue arrows show decreased events compared to CD, and thicker red or blue arrows show higher increases or lower decreases in signalling events across groups. (G) Signalling pathway changes in 50% of cell–cell interactions in the WD.mf group compared to the CD group for HSCs, cancer and NKT cells. Cancer, cancer cell; Cholangio, cholangiocytes; DC, dendritic cell; Endo, endothelial cell; Fibro, fibroblasts; Hep, hepatocytes; HSC, hepatic stellate cell; LSEC, liver sinusoidal endothelial cell; Mac, macrophage; Mono, monocytes; Myofibro, myofibroblasts; Neutro, neutrophils; Stromal, stromal cell. Green text in L‐R contributions denotes the cell type expressing receptors focused mainly on immune cells, and Itga4+Itgb1 denotes VLA‐4.
FIGURE 5
FIGURE 5
Cancer cells, hepatocytes and myofibroblasts drive NKT and monocyte‐led immune responses via homeostatic pathways in HCC on a WD. (A) Immune and nonimmune cell proportions quantified and normalised to 100% in the WD.t group (n = 3). (B) 80% CellChat analysis heatmap showing all L‐R interactions in the WD.t group (upper), and representative chord diagrams showing signalling directionality in PARs, FN1, DHEAS, 27HC and FGF pathways and their L‐R contributions (lower). (C) 50% CellChat analysis heatmap portraying all detected L‐R pathway interactions in the WD.t group (upper panel), quantified incoming and outgoing interaction strength in nonimmune and immune cell populations (middle panel), and chord diagrams of signalling directionality in PARs, FN1, DHEAS, 27HC and FGF pathways and their L‐R contributions (lower panels). (D) Dominant nonimmune cell differential number of interactions sent (left column), and received (right column) in cancer, hepatocytes, myofibroblasts and fibroblasts in WD.t compared to WD.mf in 50% analyses, showing increased signalling events in red and decreased events in blue in the WD.t group compared to WD.mf, and thicker red or blue arrows show higher increases or lower decreases in signalling events across groups. (E) Dominant immune cell differential number of interactions sent (left column) and received (right column) in NKT cells and monocytes in 50% analyses, showing increased number of signalling events in red and decreased in blue for the WD.t group compared to WD.mf, and thicker red or blue arrows show higher increases or lower decreases in signalling events across groups. (F) The 50% threshold analysis of signalling pathway changes in cancer, NKT, hepatocyte, myofibroblast, fibroblast and monocyte cell populations in WD.t compared to WD.mf. Green text in L‐R contributions denotes the cell type expressing receptors focused mainly on immune cells, and Itga4+Itgb1 denotes VLA‐4.
FIGURE 6
FIGURE 6
Stromal and cancer cell interactions along with inefficient homeostatic immune responses fuel HCC progression, while myofibroblast and monocyte networks prevent HCC through homeostatic immune pathways after dietary correction. (A) Immune (right panel) and nonimmune (left panel) cell proportions quantified and normalised to 100% in the RD.t (n = 2) and RD.n (n = 3) groups. (B) 80% CellChat analysis heatmap in the RD.t and RD.n groups (upper) and the representative chord diagram of PARs in the RD.t group and PARs, DHEAS, NRG and PROS in the RD.n group signalling directionality and the L‐R contributions (lower). (C) 50% CellChat analysis quantified incoming and outgoing interaction strength for nonimmune and immune cell populations (upper panel), heatmap of detected L‐R pathways (middle panel) and chord diagrams of signalling directionality for PARs, DHEAS, PROS and NRG pathways and their L‐R contributions (lower panel) in the RD.t (left) and RD.n (right) groups. Green text in L‐R contributions denotes the cell type expressing receptors and focused mainly on immune cells and Itga4+Itgb1 denotes VLA‐4. Green text in L‐R contributions denotes the cell type expressing receptors and focused mainly on immune cells and Itga4+Itgb1 denotes VLA‐4.
FIGURE 7
FIGURE 7
Hepatic homeostatic pathways associated with immune responses during the diet reversal‐induced protection against HCC. (A) Differential number of interactions sent (upper rows) and received (lower rows) in Monocytes, myofibroblasts and fibroblasts in RD.t compared to CD (CD vs. RD.t; left columns), RD.n compared to CD (CD vs. RD.n; middle columns) and RD.n compared to RD.t (RD.t vs. RD.n; right columns) in 50% analyses; showing increased signalling events in red and decreased events in blue for RD.t compared to CD, RD.n compared to CD and RD.n compared to RD.t; thicker red or blue arrows show higher increases or lower decreases in signalling events across comparisons. (B) Chord diagrams depicting signalling directionality of pathways detected in 50% CellChat analyses for RD.t (upper row) and RD.n (lower row) groups. Ligand‐receptor (LR) contributions are shown below, with the green text indicating the cell types receiving signals in 50% threshold signalling pathways from the chord diagrams.
FIGURE 8
FIGURE 8
Monocytes function during HCC progression or inhibition. DotPlots showing percentage of monocyte population expression and log‐normalised average transcript expression for antioxidant enzymes (A) and scavenger receptors (B) during HCC on a WD (WD.t), HCC on a reverse diet (RD.t) and protected against HCC following diet reversal (RD.n). (C–E) A LIgand‐receptor ANalysis frAmework (LIANA) was used to confirm key interactions detected in the HCC tumour‐bearing mice (C) and mice that underwent diet reversal and did not show HCC tumours (D) and those that did (E). The LIANA Rank Aggregate method was applied to each dataset individually and represents a consensus by integrating the predictions of individual methods from multiple programs LR detection methods (CellPhoneDB, Connectome, log2FC, NATMI, SingleCellSignalR, Geometric Mean, scSeqComm and CellChat). The results were filtered to show LR interactions detected in 50% CellChat analyses that were also present in the LIANA consensus database (Plg‐Pard3, Pros1‐Mertk, Vtn‐Itgav_Itgb1, Vtn‐Itgav_Itgb5, Angptl4‐Sdc2, Angptl4‐Sdc4 and Hgf‐Met). Specificity rank shows how specific an interaction is to a pair of cell types, in which larger the dot size, the more specific to a pair of cell types it is. Magnitude rank shows the corresponding strength of that detected LR interaction, with yellow being stronger and blue being weaker.

Update of

Similar articles

Cited by

References

    1. Tacke F., “Targeting Hepatic Macrophages to Treat Liver Diseases,” Journal of Hepatology 66 (2017): 1300–1312. - PubMed
    1. Robinson M. W., Harmon C., and O'Farrelly C., “Liver Immunology and Its Role in Inflammation and Homeostasis,” Cellular & Molecular Immunology 13 (2016): 267–276. - PMC - PubMed
    1. Nakashima H., Inui T., Habu Y., et al., “Activation of Mouse Natural Killer T Cells Accelerates Liver Regeneration After Partial Hepatectomy,” Gastroenterology 131 (2006): 1573–1583. - PubMed
    1. Rao R., Graffeo C. S., Gulati R., et al., “Interleukin 17‐Producing γδT Cells Promote Hepatic Regeneration in Mice,” Gastroenterology 147 (2014): 473–484.e2. - PMC - PubMed
    1. Anders R. A., Subudhi S. K., Wang J., Pfeffer K., and Fu Y.‐X., “Contribution of the Lymphotoxin Beta Receptor to Liver Regeneration,” Journal of Immunology 175 (2005): 1295–1300. - PubMed