

TERT Amplification a Risk Stratification Marker in Papillary Thyroid Carcinoma, Significantly Correlated with Tumor Recurrence and Survival
- PMID: 40272676
- PMCID: PMC12021720
- DOI: 10.1007/s12022-025-09853-4
TERT Amplification a Risk Stratification Marker in Papillary Thyroid Carcinoma, Significantly Correlated with Tumor Recurrence and Survival
Erratum in
-
Correction to: TERT Amplification a Risk Stratification Marker in Papillary Thyroid Carcinoma, Significantly Correlated with Tumor Recurrence and Survival.Endocr Pathol. 2025 Oct 30;36(1):41. doi: 10.1007/s12022-025-09881-0. Endocr Pathol. 2025. PMID: 41162733 Free PMC article. No abstract available.
Abstract
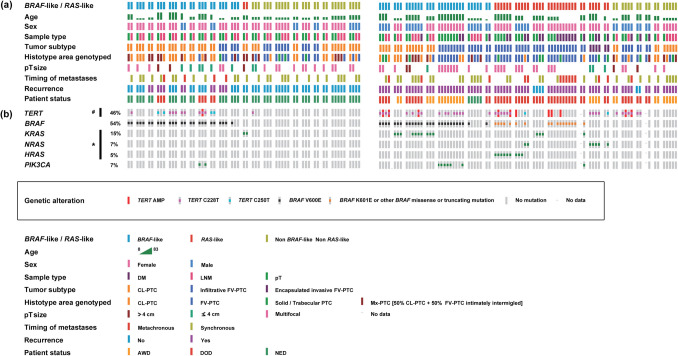
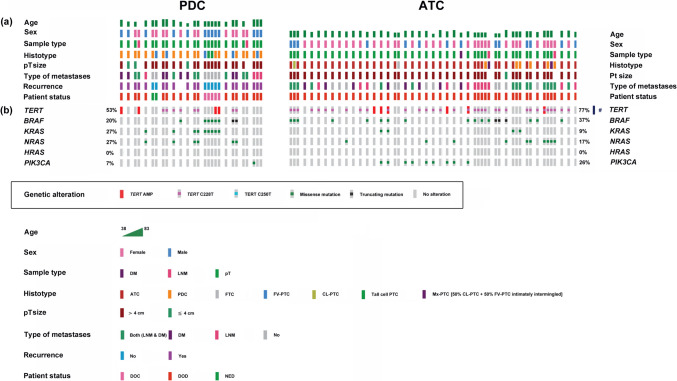
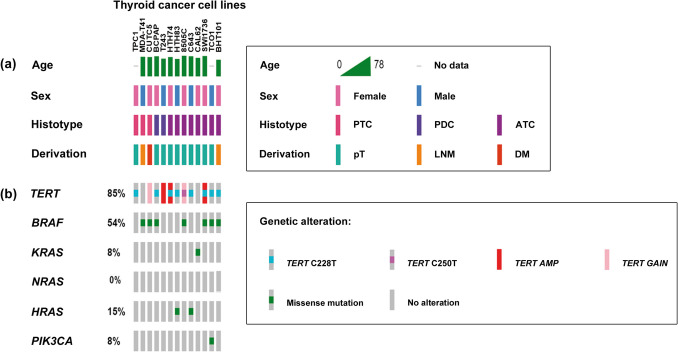
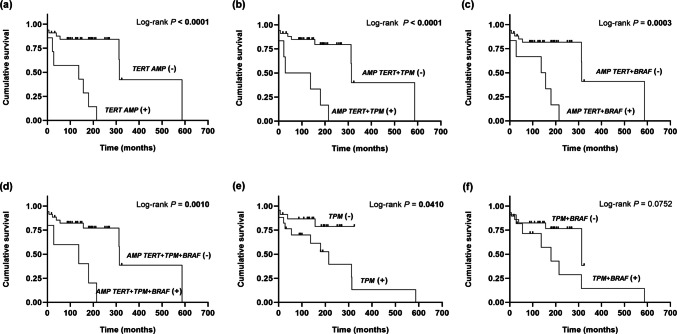
Few studies have analyzed the prevalence of TERT amplification in thyroid cancer, showing discrepancies in various topics. The impact on tumor recurrence and patient survival in papillary thyroid carcinoma (PTC) remains unknown. Thirteen cancer cell lines and 215 tumor samples from 91 patients, who underwent surgery for PTC (41), poorly differentiated thyroid carcinoma (PDC = 15), or anaplastic thyroid carcinoma (ATC = 35), were analyzed. Clonality, spread with tumor dedifferentiation or metastatic PTC cells, and coexistence with TERTp, BRAF, RAS, and PIK3CA mutations were also investigated. TERT amplification was found in 17%, 20%, and 17% of the PTC, PDC, and ATC, respectively. It was more frequent in follicular variant PTC and PTC with distant metastases (86%, P = 0.0448). The cell lines HTh74, SW1736, and T242 had amplification. In PTC, TERT amplification was a subclonal event. The increase in TERT copy number spread in all cases with metastatic PTC cells. In 67% of the PDC and 100% of the ATC, TERT activation segregated with tumor dedifferentiation. TERT amplification correlated with TERTp mutations in PTC (P = 0.0313) and PIK3CA mutations in ATC (P = 0.0272). TERT amplification significantly correlated with vascular invasion (P = 0.03637), distant metastases at diagnosis and/or follow-up (P = 0.04482), metachronous distant metastases (P = 0.03131), death patient status (P = 0.000829), stage at diagnosis (P = 0.01995), and stage III/IV at last follow-up (P = 0.01552). TERT amplification associated independently with tumor-related recurrence and death. Our study shows that PTC can be stratified into clinically prognostic relevant categories based on the presence or not of TERT amplification in the cells.
Keywords: TERT amplification; Metastases; Prognosis; Survival; Thyroid cancer; Tumor recurrence.
© 2025. The Author(s).
Conflict of interest statement
Declarations. Competing Interests: The authors declare no competing interests.
Figures

References
-
- Beroukhim R, Mermel CH, Porter D, Wei G, Raychaudhuri S, Donovan J, Barretina J, Boehm JS, Dobson J, Urashima M, Mc Henry KT, Pinchback RM, Ligon AH, Cho YJ, Haery L, Greulich H, Reich M, Winckler W, Lawrence MS, Weir BA, Tanaka KE, Chiang DY, Bass AJ, Loo A, Hoffman C, Prensner J, Liefeld T, Gao Q, Yecies D, Signoretti S, Maher E, Kaye FJ, Sasaki H, Tepper JE, Fletcher JA, Tabernero J, Baselga J, Tsao MS, Demichelis F, Rubin MA, Janne PA, Daly MJ, Nucera C, Levine RL, Ebert BL, Gabriel S, Rustgi AK, Antonescu CR, Ladanyi M, Letai A, Garraway LA, Loda M, Beer DG, True LD, Okamoto A, Pomeroy SL, Singer S, Golub TR, Lander ES, Getz G, Sellers WR, Meyerson M. (2010) The landscape of somatic copy-number alteration across human cancers. Nature, 463(7283):899-905. 10.1038/nature08822 - PMC - PubMed
-
- Zhang A, Zheng C, Lindvall C, Hou M, Ekedahl J, Lewensohn R, Yan Z, Yang X, Henriksson M, Blennow E, Nordenskjöld M, Zetterberg A, Björkholm M, Gruber A, Xu D. (2000) Frequent amplification of the telomerase reverse transcriptase gene in human tumors. Cancer Res, 60(22):6230-6235 - PubMed
MeSH terms
Substances
Grants and funding
- GRS 1927/A/19/Gerencia Regional de Salud de Castilla y León - Consejería de Sanidad del Gobierno de Castilla y León
- GRS 1731/A/18/Gerencia Regional de Salud de Castilla y León - Consejería de Sanidad del Gobierno de Castilla y León
- GRS 1927/A/19/Gerencia Regional de Salud de Castilla y León - Consejería de Sanidad del Gobierno de Castilla y León
- GRS 1927/A/19/Gerencia Regional de Salud de Castilla y León - Consejería de Sanidad del Gobierno de Castilla y León
LinkOut - more resources
Full Text Sources
Medical
Research Materials
Miscellaneous
