. 2025 Jul;64(29):e202505991.
doi: 10.1002/anie.202505991. Epub 2025 May 9.

Enhancing Cold Adaptation of Bidomain Amylases by High-Throughput Computational Engineering

Affiliations

Enhancing Cold Adaptation of Bidomain Amylases by High-Throughput Computational Engineering

Ning Ding et al. Angew Chem Int Ed Engl. 2025 Jul.

Abstract

Cold-adapted bidomain enzymes have the potential to foster industrial sustainability by reducing energy consumption and greenhouse gas emissions. Despite their allure, these benefits are unattainable, as the molecular basis of cold adaptation remains elusive, and there are no strategies to guide the acquisition of this behavior. To uncover principles of cold adaptation, we selected the cold-adapted Saccharophagus degradans amylase (sdA) and mesophilic Pseudomonas saccharophila amylase (psA) as model systems. Through molecular dynamics (MD) simulations and biochemical assays, we found that sdA exhibits significantly greater interdomain separation between its catalytic domain (CD) and carbohydrate-binding module (CBM) at low temperatures. Therefore, we introduce the domain separation index metric to guide the in silico screening of 120 psA variants using high-throughput enzyme modeling. The highest-ranked variant, psA121, shows a 3-fold increase in relative activity over the wild type at 0 °C. MD simulations suggest that psA121 achieves cold adaptation via helical linkers, which induce interdomain separation and enhance flexibility of the active site and binding loops via dynamic allostery, promoting substrate recruitment, binding, and catalysis at lower temperatures. This study highlights how domain separation contributes to cold adaptation in bidomain amylases and offers strategies for introducing such cold adaptation to other systems.

Keywords: Bidomain amylase; Cold adaptation; EnzyHTP; Enzyme engineering; High‐throughput virtual screening; Linker engineering.


Conflict of interest statement

The authors declare no conflict of interest.

Figures

Figure 1
Figure 1
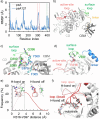
Comparative analysis of activity, RMSD, and DSI in sdA and psA. a) Relative activities of sdA and psA at temperatures ranging from 0 to 55 °C. Relative activity was quantified as the percentage ratio of enzymatic activity observed at 0 °C to that at the optimal temperature for the enzyme (45 °C). b) Box plot of RMSD for sdA and psA at 0 °C. RMSD values were calculated from MD simulations (200 ns × 5 replicas) using the respective averaged structures within each 200 ns trajectory. The data shown above the whiskers are presented as mean ± standard deviation. The red crosses within the boxes represent the mean values. c) Structural overlay of typical snapshots for sdA (blue) and psA (orange) at 0 °C. d) Schematic depicting the definition of DSI. e) Time evolution and distribution of DSI in a single 200 ns MD trajectory for sdA and psA at 0 °C. DSI was calculated from MD snapshots.
Figure 2
Figure 2
Identification of cold‐adapted psA variants through high‐throughput screening of the linkers. a) Workflow for identifying cold‐adapted psA variants by integrating computational and experimental methods. We created 3528 psA variants (psA1–psA3528) by replacing psA's native linker with sequences from the LinkDB and SynLinker databases. The structures of these variants were predicted using AlphaFold2, and the secondary structure within the linker region was analyzed using the DSSP method. The variants were categorized into four groups based on linker topology, focusing on linker length and the presence of a helix. We selected 30 variants from each group, totaling 120 variants, and performed MD simulations at 273.15 K. Variants with an average DSI exceeding 8.9 Å and a DSI standard deviation above 2.6 Å across two MD runs were selected for further experimental validation to confirm their cold adaptation. b) Average DSI and standard deviation for psA variants, calculated from the first round (top) and second round (bottom) of MD simulations. Variants are plotted as circles in a 12 × 10 matrix, with their corresponding coordinates, average DSI, and standard deviation values listed in Tables S9 and S10. The size of each circle represents the average DSI, with larger circles indicating higher DSI values. The darkness of each circle represents the standard deviation of the DSI, with darker circles indicating higher standard deviations. A circle of 8.9 ± 2.6 Å is shown as an example. c) Relative activities of psA and psA121 at temperatures ranging from 0 to 55 °C. d) Specific activities of psA and psA121 at 0 and 45 °C. Data are shown as mean ± standard deviation.
Figure 3
Figure 3
Effects of domain separation on active‐site loop dynamics in psA and psA121. a) RMSF of residues within the CD of psA and psA121. Two loop regions in psA121 involve significant increases in flexibility compared to psA, including Loop F289–R316 (active‐site loop, colored in red) and Loop L387–S403 (surface loop, colored in green). b) Structure of psA highlighting the active‐site loop (F289–R316, colored in red) and surface loop (L387–S403, colored in green). The catalytic residue D294 is shown as a red sphere. c) Conformation of a typical snapshot of psA, highlighting the residues (colored in blue) at the CD‐CBM interface interacting with surface loop (L387–S403, colored in green) via three H‐bonds (i.e., Y369‐Q396, S370‐S389, S370‐D390). d) Conformation of a typical snapshot of psA121, highlighting the interaction between the active‐site loop (F289–R316, colored in red) and surface loop (L387–S403, colored in green) via R316‐V397 H‐bond. e) The distribution of distances between the oxygen atom of residue V397 and the hydrogen atom of residue R319. Distances less than 3.5 Å are shown in pale red, indicating the possible formation of hydrogen bonds, while distances greater than 3.5 Å are shown in dark red, indicating no hydrogen bond formation. f) Conformations of typical snapshots of psA121 in complex with maltoheptaose analog as substrate. The open and closed conformation of the active‐site loop are shown in pale red and dark red, respectively. The ligand is localized by aligning the CD (D1–S418) of the psA121 structures with that of the psA crystal structure (PDB ID: 6JQB)[ 34 ] using the command “align” in PyMOL.
Figure 4
Figure 4
Effects of domain separation on binding loop dynamics in psA and psA121. a) RMSF of residues within the CBM of psA and psA121. Loop T445–S450 (binding loop, colored in orange) in psA121 involves a significant increase in flexibility compared to psA. b) Structure of psA highlighting the binding loop (T445–S450, colored in orange), and residues N500 and E501 (shown as green sticks). The ligand is localized by aligning the CBM (V434–F530) of the psA structure with that of the crystal structure of Bacillus circulans cyclodextrin glycosyltransferase (PDB ID: 1CDG)[ 54 ] using the command “align” in PyMOL. c) Conformation of a typical snapshot of psA, highlighting residue R470 (colored in blue) at the CD–CBM interface interacting with residue E501 (colored in green). Residues E501 and N500 (colored in green) interact with the binding loop (T445–S450, colored in orange) via two H‐bonds (i.e., E501‐G448 and N500‐D449). d) Conformation of a typical snapshot of psA121, highlighting the destruction of H‐bonding networks within the CBM.
Figure 5
Figure 5
Illustration showing how a greater magnitude of domain separation between CD and CBM enhances cold adaptation in a bidomain enzyme by influencing the conformational flexibility and dynamic allostery of the individual domains.
Figure 6
Figure 6
Effects of linker length and the presence of helical motifs on interdomain separation. a) Box plot of DSI for psA variants with short and long linkers. Linkers longer than nine amino acids are categorized as “long” and the rest as “short.” b) Box plot of DSI for psA variants with and without helical motifs. Linkers with a secondary structure featuring a 3–10 helix, α‐helix, or π‐helix are categorized as “helical,” and the rest as “non‐helical.” The red crosses within the boxes represent the mean values.

Similar articles

Cited by

References

    1. Feller G., Gerday C., Nat. Rev. Microbiol. 2003, 1, 200–208. - PubMed
    1. Liu Y., Jia K., Chen H., Wang Z., Zhao W., Zhu L., Bioprocess Biosyst. Eng. 2023, 46, 1399–1410. - PubMed
    1. Nowak J. S., Otzen D. E., BBA Advances 2023, 5, 100104. - PMC - PubMed
    1. Kumar A., Mukhia S., Kumar R., 3 Biotech 2021, 11, 426. - PMC - PubMed
    1. Al‐Ghanayem A. A., Joseph B., Appl. Microbiol. Biotechnol. 2020, 104, 2871–2882. - PubMed

LinkOut - more resources