. 2025 Apr 24;21(4):e1013089.
doi: 10.1371/journal.ppat.1013089. eCollection 2025 Apr.

Vacuolar sterol β-glucosidase EGCrP2/Sgl1 deficiency in Cryptococcus neoformans: Dysfunctional autophagy and Mincle-dependent immune activation as targets of novel antifungal strategies

Affiliations

Vacuolar sterol β-glucosidase EGCrP2/Sgl1 deficiency in Cryptococcus neoformans: Dysfunctional autophagy and Mincle-dependent immune activation as targets of novel antifungal strategies

Takashi Watanabe et al. PLoS Pathog. .

Abstract

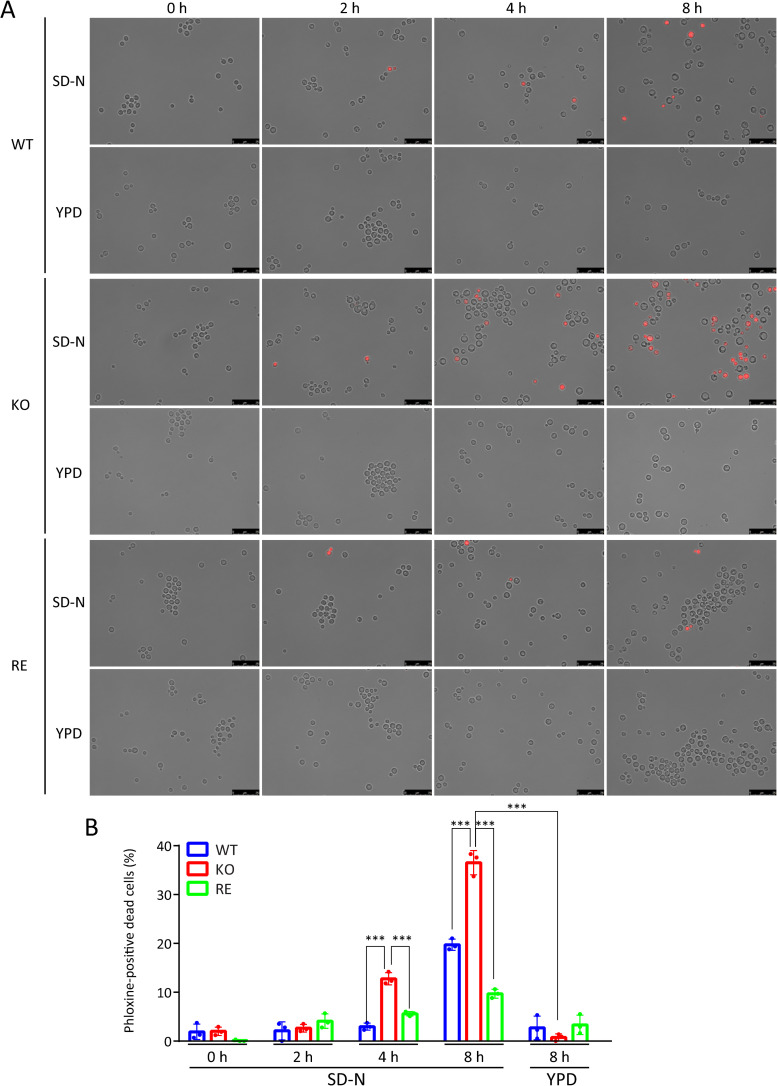
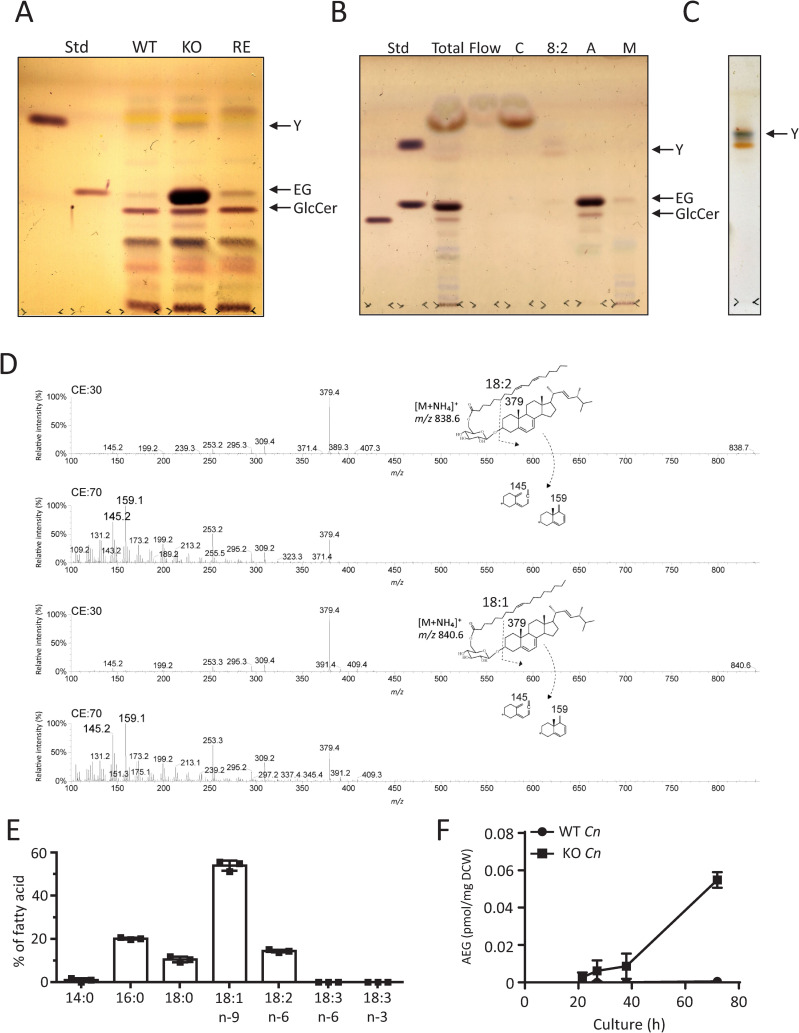
Cryptococcus neoformans (Cn) is a fungal pathogen responsible for cryptococcal meningitis, which accounts for 15% of AIDS-related deaths. Recent studies have shown that the absence of sterol β-glucosidase (EGCrP2, also known as Sgl1) in Cn significantly attenuates its virulence in a mouse infection model. However, the mechanisms underlying this virulence attenuation remain unclear. In this study, we observed a significant increase in dead cells after 3 days of culture of SGL1-deficient Cn (sgl1Δ, KO) at 37°C, compared with wild-type (WT) and SGL1-reconstituted Cn (sgl1Δ::SGL1, RE). qPCR analysis of WT, KO, and RE strains indicated that autophagy-related genes (ATGs) were significantly downregulated in KO strain. Atg8-dependent GFP translocation to the vacuole was significantly delayed in KO strain under starvation conditions. This autophagy dysfunction was identified as the primary cause of the increased cell death observed in KO strain under nitrogen starvation conditions at 37°C. EGCrP2/Sgl1 is predominantly localized in the vacuoles of Cn, and its deletion results in the accumulation of not only ergosterol β-glucoside (EG), as previously reported, but also acylated EGs (AEGs). AEGs were much more potent than EG in activating the C-type lectin receptor Mincle in mice, rats, and humans. AEGs were released from KO strain via extracellular vesicles (EVs). Chemically synthesized 18:1-EG and EVs derived from KO strain, but not WT or RE strains, enhanced cytokine production in murine and human dendritic cells. AEG-dependent cytokine production was markedly reduced in dendritic cells from Mincle-deficient mice, and the number of KO strain in lung tissue from Mincle-deficient mice was substantially higher than wild-type mice on day 3 after infection. Intranasal administration of acylated sitosterol β-glucoside increased Mincle expression and cytokine production and reduced the Cn burden in lung tissue of Cn-infected mice. These findings suggest that autophagy dysfunction in KO strain and the host innate immune response via the AEG-dependent Mincle activation are critical in reducing Cn virulence in mice.


Conflict of interest statement

The authors have declared that no competing interests exist.

Figures

Fig 1
Fig 1. Virulence of C. neoformans (Cn) in a mouse infection model.
A, Survival of mice infected with Cn WT, sgl1Δ (KO), and sgl1Δ::SGL1 (RE) strains. Mice were intranasally administered 5 × 105 Cn cells. Each group consisted of 6 mice. B, Colony-forming units (CFU) in the lung on day 3 after infection and at the endpoint (WT, day 21-35; RE, day 22-28; KO, day 43). The values represent CFU per mg of lung tissue (n = 6). C, Appearance of the mouse lung at the endpoint after infection with WT, KO, and RE strains. D, Histology of mouse lung sections stained with hematoxylin and eosin at the endpoint after infection with WT, KO, and RE strains. Scale bar, 500 μm. Asterisks indicate cryptococcal lesions. Infection experiments were performed independently three times and data were reproducible.
Fig 2
Fig 2. Growth inhibition in KO strain at 37°C.
A, Cell growth curves of Cn at different temperatures. WT, KO, and RE strain were cultured in YPD medium at 25, 30, and 37°C with shaking at 150 rpm. Optical density at 600 nm (OD600) was measured by a spectrophotometer on the indicated days during cultivation. Each experiment was performed with 5-7 replicates (25°C WT, n = 7; 25°C KO, n = 5; 25°C RE, n = 5; 30°C WT, n = 7; 30°C KO, n = 6; 30°C RE, n = 6; 37°C WT, n = 7; 37°C KO, n = 5; 37°C RE, n = 5). B, Phloxine B staining of Cn cells. WT (upper), KO (middle), and RE (lower). Cn were cultured in YPD medium for 3 days at 37°C with shaking at 150 rpm. Dead cells (red) were stained with phloxine B and captured by a fluorescence microscope [21]. Scale bar, 5 μm. C, Quantification of phloxine B positive cells. Numbers of phloxine B-positive cells were counted under a fluorescence microscope. Each experiment analyzed at least 100 cells (n = 3). D, Flow cytometry of Cn cells stained with phloxine B. WT, KO, and RE strain were cultured in YPD medium for 3 days at 25, 30, and 37°C with shaking at 150 rpm. Cells were stained with phloxine B and analyzed by a flow cytometer using a BL2-H channel (574/26 nm BP filter).
Fig 3
Fig 3. The genes downregulated in KO strain at 37°C.
Relative mRNA expression levels were determined using ACT1 and GAPDH as reference genes with PCR amplification efficiency collection. Data are presented as Mean ± SD (n = 3).
Fig 4
Fig 4. Autophagy progression in WT, KO, and RE strains at 37°C in YPD medium.
A, Localization of GFP-Atg8 in WT, KO, and RE strains cultured at 37°C for different periods (from day 1 to day 4). Fluorescent images of GFP were obtained using the FITC filter set and merged with differential interference contrast (DIC) images. B, Ratio of the GFP signal within the vacuole. Numbers of cells showing GFP within the vacuole were counted under a fluorescence microscope. The percentage of cells with GFP within vacuoles was calculated as: Cells with GFP within vacuoles (%) = cells with GFP within vacuoles/ cells with GFP within vacuoles + cells with GFP but not in vacuoles x 100. Each experiment analyzed at least 100 cells (n = 3).
Fig 5
Fig 5. Autophagy progression in WT, KO, and RE strains at 37°C in SD-N medium.
A, Autophagy induction by translocation of GFP-Atg8 in WT, KO, and RE strains vacuoles after transfer to SD-N medium. Cn was cultured in YPD medium for 15 hours at 30°C, then collected by centrifugation (5,000 × g for 3 minutes). Cn cells were washed three times with PBS, transferred to SD-N medium, and incubated at 37°C for the indicated periods. GFP fluorescence images were captured using a fluorescence microscope with the FITC filter and merged with differential interference contrast (DIC) images. B, Ratio of the GFP signal within the vacuole. The number of cells showing GFP within the vacuole was counted under a fluorescence microscope. The percentage of cells with GFP within vacuoles was calculated as: Cells with GFP within vacuoles (%) = cells with GFP within vacuoles/ cells with GFP within vacuoles + cells with GFP but not in vacuoles × 100. Each experiment analyzed at least 100 cells (n = 3).
Fig 6
Fig 6. Autophagy progression in WT, KO, and RE strains at 37°C evaluated by cleaving GFP-Atg8.
Immunoblot analysis using an anti-GFP antibody evaluated the autophagy progression. During the normal autophagy process, GFP-Atg8 (ca. 42 kDa) is cleaved in vacuoles, generating free GFP (ca. 27 kDa) [24]. Cn cells were transferred to an SD-N medium and incubated at 37°C for the indicated periods. Experimental details are described in Materials and methods. The experiments were conducted twice, and the data were reproducible. Ponceau shows the proteins subjected to Western blotting before being treated with anti-GFP antibodies.
Fig 7
Fig 7. The impact of autophagy deficiency on the survival of the KO strain under nitrogen starvation at 37°C.
A. Detection of dead cells of WT, KO, and RE strains cells cultured under nitrogen-starved condition (SD-N) at 37oC. Dead cells were stained with phloxine B and observed under a fluorescence microscope at the time points indicated in the picture. Each strain cultured in nutrient rich YPD medium was used as a control. Scale bar, 25 μm. B, Quantification of phloxine B-positive cells. Numbers of phloxine B-positive cells were counted under a fluorescence microscope. Each experiment analyzed at least 150 cells (n = 3).
Fig 8
Fig 8. Subcellular localization of EGCrP2/Sgl1 in Cn and its optimum pH.
A, Subcellular localization of mRuby-EGCrP2/Sgl1 expressed in WT strain cultured at 25°C for 2 days. Fluorescence microscopy captured mRuby-derived fluorescence (red), showing EGCrP2/Sgl1 distribution (mRuby-EGCrP2/Sgl1) and free mRuby (mRuby). The vacuole was stained by quinacrine (green) that accumulates in fungal vacuoles [56]. Both signals were merged in mRuby-EGCrP2/Sgl1-expressing Cn, turning to yellow. B, Optimum pH of EGCrP2/Sgl1. The enzyme activity was measured using C6-NBD-GlcCer as a substrate and 150 mM GTA buffer varying pHs according to the method described in [7]. Data are presented as Mean ± SD (n = 3).
Fig 9
Fig 9. Isolation and characterization of AEGs in KO strain.
A, TLC analysis of the glycolipids from WT, KO, and RE strains. Glycolipids were extracted from Cn (20 mg of dry cells), cultured in YPD medium for 3 days at 30°C, using chloroform/methanol (2/1, v/v). TLC was developed with chloroform/methanol/water (65/16/2, v/v/v) and stained with orcinol sulfate. Glycolipid Y shows an unidentified glycolipid accumulated in KO strain. B, C, Isolation of glycolipid Y from the total lipids of KO strain. Total lipids were extracted from KO strain using chloroform/methanol (2/1, v/v), and glycolipid Y was isolated using a Sep-Pak plus silica cartridge. Glycolipid Y was eluted from the cartridge with chloroform/acetone (8/2, v/v). D, Tandem mass analysis of glycolipid Y. The top and third spectra show the MS/MS fragmentation ions generated from precursor ions m/z 838 and 840, respectively, at collision energy (CE) 30. The fragment ion m/z 379 was generated under this condition. Glycolipid Y was also applied to tandem mass using higher CE (CE70) to obtain more detailed structural information. The characteristic fragment ions m/z 145 and 159 derived from ergosterol were generated under this condition from precursor ions m/z 838 (second spectrum) and m/z 840 (bottom spectrum). The proposed structure of glycolipid Y (AEGs, 18:1-EG, and 18:2-EG) and its fragment pattern are shown above the spectrum. E, Fatty acid composition of AEGs. As described in Materials and methods, AEGs were subjected to gas chromatography after metanalysis. F, Time-course of AEG production in KO and WT strain. AEGs were extracted from Cn cells cultured at 30°C for the period indicated using chloroform/methanol (2/1, v/v) and quantified by LC-ESI MS/MS. Data are presented as Mean ± SD (n = 3). DCW, dry cell weight.
Fig 10
Fig 10. Accumulation of EG and AEGs in KO strain at different temperatures.
A, Quantification of EG amount. B, Quantification of AEG amount. WT, KO, and RE strains were cultured at 25, 30, and 37°C for 2 and 3 days with shaking at 150 rpm. EG and AEG contents were quantified by LC-ESI MS/MS. Data are presented as Mean ± SD (n = 4). White and gray bars represent the amounts of EG and AEGs on day 2 and day 3, respectively. DCW, dry cell weight.
Fig 11
Fig 11. Activation of Mincle by SGs and ASGs.
A, Experimental design for measuring SG and ASG activities on CLRs using NFAT-GFP reporter cells expressing CLRs. B, Activities of EG and AEGs on various CLRs. Reporter cells expressing CLRs were exposed to glycolipids (EG, 1.8 nmol/well; AEGs, 1.2 nmol/well) or 2-propanol (IPA, negative control) for 18 h on a 96-well plate. Flow cytometry was employed to analyze GFP expression in reporter cells. The percentage of NFAT-GFP was calculated as follows: NFAT-GFP (%) = GFP-positive cells/ total cells x 100. C, Experimental design for measuring SG and ASG activities for Mincle using secreted alkaline phosphatase (SEAP) reporter in HEK293 cells expressing Mincle. Activation of NF-κB was induced by Mincle stimulation, and secreted SEAP was quantified using QUANTI-Blue as a substrate. D, E, Activation of Mincle by SG, ASGs, and TDB (authentic Mincle ligand, 0.2 nmol/well). The activity was measured by SEAP reporter assay. -, IPA without TDB. SitoSG, sitosterol β-glucoside; StigmaSG, stigmasterol β-glucoside; CholeSG, cholesterol β-glucoside; Acyl-SitoSG, acylated sitosterol β-glucoside (ASiGs); Acyl-StigmaSG, acylated stigmasterol β-glucoside. F-I, Activation of various Mincle by EG, AEGs (16:0-EG and 18:1-EG), and TDB (0.2 nmol/well). The activity was measured by NFT-GFP reporter assay. EG and AEGs were chemically synthesized, and their structures are presented in S7 Fig. All data are presented as Mean ± SD (n = 3).
Fig 12
Fig 12. Significance of Ca2+ ion for binding of Mincle with AEG and EG.
A, AEG docking model (18:1-EG, colored in green); B, EG docking model (EG, colored in purple). Residues involved in calcium binding are highlighted in yellow. Residues directly interacting with AEG and EG are shown in blue. Calcium ions are represented as yellow spheres. We superimposed the mouse Mincle on the bovine Mincle structure (PDB ID: 5KTH) after truncating the first 62 N-terminal residues. Guided by the three Ca2+ -binding sites in the bovine Mincle [28], a Ca2+ -bound conformation for the mouse Mincle was proposed.
Fig 13
Fig 13. Extracellular transport of EG and AEGs by EVs.
A, Schematic depiction of EG and AEGs excluded from KO strain. EVs containing EG and AEGs are recovered in the sediment fraction when the culture supernatant of KO strain is subjected to ultracentrifugation at 100,000 x g [29]. B, Transmission electron microscopy (TEM, negative staining) photograph displaying EVs (indicated by red arrows) in the sediment at 100,000 x g. C and D indicate EG and AEG contents in the supernatants and sediments (EV fractions) of WT and KO strain [29]. WT and KO strain were cultured in YPD liquid medium at 30°C for 2 days with shaking. ND, not detected. E and F indicate EG and AEG contents in supernatant and sediments (EV fractions) of WT, KO, and RE strains [30]. WT, KO, and RE strains were cultured in YPD agar medium at 30°C for 1 day. The method for preparing EVs was described in Materials and methods. EG and AEG contents were quantified using LC-ESI MS/MS. Data are presented as Mean ± SD (n = 3).
Fig 14
Fig 14. AEG-dependent cytokine production, Mincle expression, and KO strain clearance from mice.
A, MIP-2 production in mouse BMDCs by EVs from WT, KO, and RE strains. BMDCs from WT mice were exposed to different concentrations (0, 4, 20, 100 ng sterol equivalent EVs per well) of EVs from WT, KO and RE strains for 40 h at 37°C. B, IL-8 production in human MoDCs by EVs from WT, KO and RE strains. Human MoDCs were exposed to different concentrations (0, 0.8, 4, 20 ng sterol equivalent EVs per well) of EVs from WT, KO, and RE strains for 40 h at 37°C. C, MIP-2, D, TNF-α productions in mouse BMDCs by chemically synthesized EG and AEG (18:1-EG). BMDCs from WT and Mincle KO mice were exposed to EG and 18:1-EG at different concentrations (0, 0.1, 1, 5 nmol per well) for 40 h at 37°C. E, IL-8 production in human MoDCs. Human MoDCs were stimulated with EG, 18:1-EG, and TDB (0, 0.008, 0.04, 0.2, 1 nmol per well). F, Mincle expression in mouse BMDCs following stimulation with 18:1-EG (0.1 nmol), TDB (0.1 nmol), and LPS (10 ng/ml) for 40 h at 37°C. Mincle expression was quantified by qPCR. G, MIP-2 production in BMDCs from WT, Mincle KO, and CARD9 KO mice. BMDCs were stimulated with 18:1-EG at various concentrations (0, 0.1, 1, 5 nmol per well). ELISA was conducted to determine MIP-2 (A, C, G), IL-8 (B, E), and TNF-α (D) productions. Data are presented as Mean ± SD (n = 3). H, CFU in the lung on day 3 after infection of KO strain. WT and Mincle KO mice were intranasally administered 5 × 105 KO strain cells. CFU was determined by lung Cn burden analysis, as shown in Materials and methods. The values represent CFU per mg of lung tissue. Data are presented as Mean ± SD (n = 4).
Fig 15
Fig 15. Cytokine production, Mincle activation, and CFU in mouse lung tissues after administration of ASiGs.
A, Experimental design. According to the experimental design, WT and Mincle KO mice (4 mice per group) were intranasally administered 100 ng of ASiGs in 50 μL of PBS containing 1% DMSO. PBS containing 1% DMSO without ASiGs was used for the control. B, TNF-α, C, MIP-2, and D, IL-17A productions in mouse lung homogenates. ELISA quantified cytokine concentrations in homogenates. E, Mincle expression in lung tissues. Mincle expression was assessed through qPCR using Actb (right) and Gapdh (left) as reference genes. F, CFU in lung tissues. CFU was determined by lung Cn burden analysis, as shown in Materials and methods. Data are presented as Mean ± SD (n = 4). The experiment was performed twice and yielded consistent results, with one dose of ASiG administered per experiment.
Fig 16
Fig 16. Visualization of the impact of EGCrP2/Sgl1 deficiency on Cn and mouse immunity.
In Cn, EG is usually degraded in vacuoles by EGCrP2/Sgl1. However, EG and its acylated derivatives, AEGs, accumulate in KO strain. This accumulation disrupts autophagy, leading to cell death of KO strain under nitrogen starvation conditions. AEGs are trafficked via EVs, whereas EG is transported through EVs and non-EVs pathways. EVs derived from KO strain enhance cytokine production through Mincle activation. EG promotes GXM-mediated TLR2 signaling in γδ T cells, producing cytokine and activating immune cells [42]. Ultimately, the activated host immune system eliminates KO strain from the mouse. The dotted squares in the figure are not the results of this study but a summary of the report by Normile et al [42]. Yellow circles, EVs; green circles, EG; red circles, AEGs; dark blue hexagons, glucuronoxylomannan (GXM).

Similar articles

References

    1. WHO fungal priority pathogens list to guide research, development and public health action [Internet]. n.d. [cited 2023 May 28]. Available from: https://www.who.int/publications/i/item/9789240060241
    1. Fisher MC, Denning DW. The WHO fungal priority pathogens list as a game-changer. Nature Reviews Microbiology. 2023. Feb 6 [cited 2023 Aug 30]; 21(4):211–2. https://www.nature.com/articles/s41579-023-00861-x - PMC - PubMed
    1. Mitchell TG, Perfect JR. Cryptococcosis in the era of AIDS--100 years after the discovery of Cryptococcus neoformans. Clin Microbiol Rev. 1995;8(4):515–48. doi: 10.1128/CMR.8.4.515 - DOI - PMC - PubMed
    1. Zaragoza O. Basic principles of the virulence of Cryptococcus. Virulence. 2019;10:490–501. doi: 10.1080/21505594.2019.1614383 - DOI - PMC - PubMed
    1. Rajasingham R, Smith RM, Park BJ, Jarvis JN, Govender NP, Chiller TM, et al.. Global burden of disease of HIV-associated cryptococcal meningitis: an updated analysis. Lancet Infect Dis. 2017. [cited 2024 Sep 10];17(8):873–81. https://pubmed.ncbi.nlm.nih.gov/28483415/ - PMC - PubMed

MeSH terms

LinkOut - more resources