. 2025 Apr 25;388(6745):eadr3026.
doi: 10.1126/science.adr3026. Epub 2025 Apr 25.

Tumor-derived erythropoietin acts as an immunosuppressive switch in cancer immunity

Affiliations

Tumor-derived erythropoietin acts as an immunosuppressive switch in cancer immunity

David Kung-Chun Chiu et al. Science. .

Abstract

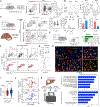
Successful cancer immunotherapy requires a patient to mount an effective immune response against tumors; however, many cancers evade the body's immune system. To investigate the basis for treatment failure, we examined spontaneous mouse models of hepatocellular carcinoma (HCC) with either an inflamed T cell-rich or a noninflamed T cell-deprived tumor microenvironment (TME). Our studies reveal that erythropoietin (EPO) secreted by tumor cells determines tumor immunotype. Tumor-derived EPO autonomously generates a noninflamed TME by interacting with its cognate receptor EPOR on tumor-associated macrophages (TAMs). EPO signaling prompts TAMs to become immunoregulatory through NRF2-mediated heme depletion. Removing either tumor-derived EPO or EPOR on TAMs leads to an inflamed TME and tumor regression independent of genotype, owing to augmented antitumor T cell immunity. Thus, the EPO/EPOR axis functions as an immunosuppressive switch for antitumor immunity.


Conflict of interest statement

Competing interests: D.K.-C.C. is a cofounder of ImmunEdge Inc. B.Y. is employed by and shareholder of ImmunEdge Inc. X.Z. is a cofounder of ImmunEdge Inc. E.G.E. is a founder, shareholder, and board member of ImmunEdge Inc. D.K.-C.C., B.Y., X.Y. and E.G.E. are Stanford-affiliated inventors of PCT/US2023/063997, entitled ‘EPO RECEPTOR AGONISTS AND ANTAGONISTS’. The remaining authors declare no competing interests.

Figures

Fig. 1.
Fig. 1.. Tumor-secreted EPO autonomously establishes a non-inflamed tumor microenvironment.
(A) Generation of a spontaneous HCC model by in vivo delivery of plasmids pCMV-SB13, pT3-EF1a-Myc and pX330-sgRNA targeting Trp53, Pten, Keap1 to mouse liver via HDTV. 5 weeks after HDTV, HCC tumors were harvested and the immune cell compositions were determined by flow cytometry (normal control, n = 5; experimental groups, n = 10–12/group of 2 independent experiments). (B) 2 weeks after HDTV, C57BL/6 WT mice were injected intraperitoneally (IP) with 2 mg/kg of αPD-1 (RMP1–14) or IgG Isotype control every 3 days (total 5 doses). Overall survival was measured (n = 7–8/group). (C) 5 weeks after HDTV, spleen weight and plasma EPO concentration of tumor-bearing mice were analyzed (normal control, n = 5; experimental groups, n = 6–19/group of 2 independent experiments). (D) 4 weeks after HDTV, blood samples were collected from tumor-bearing mice with comparable tumor burdens and analyzed for complete blood count (n = 5/group). The levels of RBC, HGB, and HCT are presented. (E-F) Correlation of EPO mRNA expression (EPOhigh, upper quartile; EPOlow, lower quartile) with (E) 5-year overall survival and (F) immune composition in HCC patients (TCGA and LIRI-JR). (G-I) pX333 vector has two independent U6 promoters, which allow for the expression of two sgRNAs. pX333-sgTrp53-sgEpo was generated to render Trp53KO tumors unable to secrete Epo. (G) 4 weeks after HDTV, blood samples were collected from tumor-bearing mice with comparable tumor burdens and measured for plasma EPO concentration (n = 6/group). 5 weeks after HDTV, Trp53KO/MycOE and Trp53KO/EpoKO/MycOE HCC tumors were harvested for (H) size measurement and (I) intratumoral immune cell profiling (n = 6–7/group). (J-M) Regressive HCC model: C57BL/6 mice were orthotopically implanted with 3 × 10⁶ allogeneic Hepa1–6 cells. The tumors grew continuously for two weeks, and then spontaneously regressed, resulting in either complete or partial regression. Hepa1–6_EV (empty vector) and Hepa1–6_EpoOE (EPO-overexpressing) tumors were harvested on Day 14 and Day 21 (normal control, n = 5; experimental groups, n = 8–11/group of 2 independent experiments) for (J) determination of tumor size and regression rate (CR: complete regression; PR: partial regression; NR: no regression), and (K-M) intratumoral immune cell profiling. (N) On days 14, 17 and 20 after orthotopic implantation (Hepa1–6_EpoOE), mice were injected IP with 2 mg/kg of αCD25, αCTLA-4, αCCR8 or IgG control. Tumors were harvested on day 21 (n = 5/group). One-way ANOVA with Tukey’s multiple comparison test for (A), (C), (L right), (M right), (N); Log-rank (Mantel-Cox) test for (B), (E); Two-way ANOVA with Tukey’s multiple comparison test for (D); Unpaired t test for (G), (H), (I), (J left), (K), (L left), (M left); Fisher’s exact test for (J right); Mann-Whitney test for (F). In all panels, data are presented as violin plot with median and quartiles, or as mean ± SD. *P ≤ 0.05; **P ≤ 0.01; ***P ≤ 0.001, ****P ≤ 0.0001. Comparisons with P > 0.05 (ns, not significant) are not displayed.
Fig. 2.
Fig. 2.. Kupffer cells and monocyte-derived macrophages are the dominant EPOR+ populations in hepatocellular carcinoma.
(A-B) 5 weeks after HDTV, Trp53KO/MycOE tumors in EPOR-tdTomato reporter mice were harvested and subjected to flow cytometry analysis. (A) F4/80+EPOR+ macrophages, which consisted of CD11bhi MDMs, CD11blo MDMs and TIM-4+ KCs, are the major EPOR+ populations in tumors, (B) and their EPOR and MHCII levels were examined (n = 4/group). (C-D) 2 weeks after orthotopic implantation (Hepa1–6_EV or -_EpoOE), liver tissues of EPOR-tdTomato reporter mice were harvested and subjected to flow cytometry analysis. (C) The percentage of each F4/80+EPOR+ macrophage subset, and their expression levels of (D) EPOR and MHCII, were examined (n = 9/group of 2 independent experiments). (E) 2 weeks after orthotopic implantation (Hepa1–6_EV or -_EpoOE), liver tissues of Ms4a3-EGFP reporter mice were harvested and the proportion of EGFP+ cells in KCs was determined (n = 3/group). (F-G) Fresh normal liver tissues were procured from deceased organ donors, while fresh tumors (T) and adjacent non-tumor liver tissues (NT) were obtained from surgical resection of HCC patients. Within 24 hours post-collection, samples were dissociated into single-cell suspensions. (F) Percentage of EPOR+CD68+ human macrophages and their CD14/CD163 levels in each tissue were determined by flow cytometry analysis. (G) The EPOR expression of EPOR+CD68+ human macrophages in T/NT pairs were examined. (H) Representative immunofluorescent images showing overlapping staining pattern of EPOR and CD68 in human HCC. (I) Correlation of EPO and EPOR mRNA expression in HCC patients (TCGA). (J) Correlation of the signature enrichment (SE) scores of two liver macrophage subsets (identified by MacParland et al.) with EPOR mRNA expression, in human HCC-NT (TCGA). (K) Fresh human liver tumors were obtained and dissociated into single cell suspensions. EPOR+ and EPOR macrophages (CD11b+CD14+) were isolated by FACS and subjected to bulk-RNA sequencing. (Left) The top five upregulated pathways (from 72 genes) enriched in EPOR+ macrophages relative to EPOR macrophages. (Right) Correlation between EPOR+ macrophage signature enrichment and cell type signature for five KC subsets (identified by Aizarani et al.). One-way ANOVA with Tukey’s multiple comparison test for (A), (B); Unpaired t test for (C), (D); Ratio paired t test for (G); Mann-Whitney test for (I). In all panels, data are presented as violin plot with median and quartiles, or as mean ± SD. *P ≤ 0.05; **P ≤ 0.01; ***P ≤ 0.001, ****P ≤ 0.0001. Comparisons with P > 0.05 (ns, not significant) are not displayed.
Fig. 3.
Fig. 3.. Removal of EPOR in macrophages promotes anti-tumor immunity and results in tumor regression.
(A-B) LysMCre;Eporfl/fl (EporΔLysM) mice, which develops Epor-deficiency in the mature myeloid cells (mainly macrophages), were generated. Spontaneous HCC with different tumor suppressor mutations were induced by HDTV. (A) Survival of HCC-bearing WT and EporΔLysM mice (n = 7–10/group), and (B) tumor growth kinetics measured by luciferin-based bioluminescence imaging (n = 7–8/group). (C) 2 weeks after HDTV (Keap1KO/MycOE-Luc+), mice were injected (IP) with either PBS or 50 IU of rHuEPO daily for 3 weeks and tumor growth kinetics were measured (n = 7–8/group). (D) Overall survival in WT mice and EporΔLysM mice after HDTV (Trp53KO/MycOE-Luc+; EpoWT) or (Trp53KO/EpoKO/MycOE-Luc+; EpoKO) (n = 8–9/group). (E) Orthotopically implanted Hepa1–6_EpoOE tumors in WT and EporΔLysM mice were harvested on day 21 for tumor size and CR rate measurement (n = 8–12/group of 2 independent experiments). (F-G) Liposomes containing 50 μg of siEpor or siNTC (non-targeted control) were administered intravenously (IV) to (F) Hepa1–6_EpoOE (n = 6/group) or (G) Trp53KO/MycOE (n = 8/group) HCC bearing mice, and tumor burden was measured. Log-rank (Mantel-Cox) test for (A), (D); Unpaired t test for (C), (E left), (F), (G); Fisher’s exact test for (E right). In all panels, data are presented as violin plot with median and quartiles. *P ≤ 0.05; **P ≤ 0.01; ***P ≤ 0.001, ****P ≤ 0.0001. Comparisons with P > 0.05 (ns, not significant) are not displayed.
Fig. 4.
Fig. 4.. Removal of EPOR in macrophages promotes T cell activation and augments the response to anti-PD-1 immunotherapy.
(A) Trp53KO/MycOE tumors of WT and EporΔLysM mice were harvested 5 weeks after HDTV. Total leukocyte infiltration per gram of tumor, frequency of different immune populations and functional status of TAMs (CD11b+F4/80+CD64+) were analyzed (n = 5/group). (B) 2 weeks after HDTV (Trp53KO/MycOE), C57BL/6 WT or EporΔLysM mice were injected (IP) with 4 mg/kg of an anti-CD8 mAb (YTS 169.4) or IgG control twice during the first week and then once weekly (total 6 doses). Overall survival was measured (n= 6–8/group). (C-D) Trp53KO/MycOE HCC tumors of WT and EporΔLysM mice were harvested 5 weeks after HDTV. Tumor-infiltrating CD8+ T cells were profiled using spectral flow cytometry with 20 markers. PhenoGraph analysis of the CD8+ T cell population delineated 20 clusters (excluding the dead cell population), with 8 out of 20 differentially expressed markers (DEMs) contributing to the cluster definition. (C) UMAP plot displaying the distribution of CD8+ T cells in WT and EporΔLysM groups (n = 6/group; 2500 CD8+ T cells/sample). (D) Distribution percentage of each cluster along with the expression levels of 8 DEMs. (E) 2 weeks after HDTV (Trp53KO/MycOE-Luc+), C57BL/6 WT and EporΔLysM mice were injected (IP) with 2 mg/kg of αPD-1 (RMP1–14) or IgG Isotype control every 3 days (total 5 doses). Tumor growth was monitored using luciferin-based bioluminescence imaging. Tumor growth kinetics and overall survival were measured (n = 7/group). Gray area refers to the threshold level of background noise. (F) 1.5 weeks after HDTV (Trp53KO/MycOE), C57BL/6 EporΔLysM-ERT2 mice were injected (IP) with 75 mg/kg tamoxifen or corn oil every 3 days (total 8 doses), in addition to the αPD-1 regimen. Overall survival was measured (n = 7–8/group) (G) 2 weeks after HDTV (Trp53KO/MycOE). C57BL/6 WT mice were injected (IP) with 20 mg/kg mEPOR-Fc or PBS weekly (total 4 doses), in addition to the αPD-1 regimen. Overall survival was measured (n = 5–6/group). Log-rank (Mantel-Cox) test for (B), (E), (F), (G); Unpaired t test for (A), (D). In all panels, data are presented as violin plot with median and quartiles. *P ≤ 0.05; **P ≤ 0.01; ***P ≤ 0.001, ****P ≤ 0.0001. Comparisons with P > 0.05 (ns, not significant) are not displayed.
Fig. 5.
Fig. 5.. Kupffer cells and monocyte-derived macrophages develop a regulatory phenotype upon activation of the EPO/EPOR axis.
(A-E) KCs were isolated by FACS from adjacent liver tissues of Hepa1–6_EV (KCEV) and Hepa1–6_EpoOE (KCEpo) tumors at day 18 post-implantation. KCEV and KCEpo were analyzed with flow cytometry and subjected to bulk-RNAseq (n = 3 independent replicates). (A) Protein levels of functional markers in KCEV and KCEpo (n = 6/groups of 2 independent experiments). Data are presented as mean ± SD. Unpaired t test, **P ≤ 0.01; ***P ≤ 0.001, ****P ≤ 0.0001. (B) Principal component analysis of gene expression profiles, (C) Geneset enrichment analysis for inflammatory response gene signature and heatmap for core proinflammatory cytokines enriched in KCEV, (D) volcano plots of differentially expressed genes in KCEV and KCEpo. (E) The top five upregulated and downregulated pathways enriched in KCEpo relative to KCEV. (F) Correlation between EPO and KCEpo signatures in human HCC (TCGA). (G-I) Gene set enrichment analysis to compare the gene expression profiles of KCEV and KCEPO. (G) KCEPO profile was enriched for the human LILRB5+ immunoregulatory KC gene signature (GenesetILIRB5_KCs). (H) Core genes enriched in KCEpo for the GenesetILIRB5_KCs and (I) potential transcriptional factors that regulate these core genes (analyzed by ChEA3).
Fig. 6.
Fig. 6.. NRF2 activation and heme deprivation are crucial for EPO-mediated immune suppression.
(A) The nucleus-to-cytoplasm ratio of NRF2 signal in KCEV and KCEpo (n = 6 independent replicates). (B-E) KCs and MDMs were isolated from Hepa1–6_EV and Hepa1–6_EpoOE HCC-bearing WT and Epor-deficient mice (n = 3 independent replicates). mRNA expression of iron metabolism-associated genes and antioxidant genes were examined in (B-C) KCEV and KCEpo, (D) MDMEV and MDMEpo, (E) KCEpo with Epor deficiency. (F-G) Intracellular heme level in (F) KCs isolated from Hepa1–6 tumors and (G) TAMs (both KCs and MDMs) isolated from cold HCC tumors of WT and EporΔLysM mice. (H-K) LysMCre;Nrf2fl/fl (Nrf2ΔLysM) mice, in which Nrf2-deficiency develops in mature myeloid cells, mainly macrophages, were generated. (H) Orthotopically implanted Hepa1–6_EpoOE tumors in WT and Nrf2ΔLysM mice were harvested on Day 18, and tumor size and CR rate were measured (n = 6/group). (I) Representative H&E and CD8-stained images of partially regressed tumors in Nrf2ΔLysM mice. (J) Survival of HCC bearing WT and Nrf2ΔLysM mice after HDTV (Trp53KO/MycOE) (n = 6–8/group). (K) 5 weeks after HDTV (Trp53KO/MycOE ), HCC tumors of WT and Nrf2ΔLysM mice were harvested, and the percentages of the indicated T cell populations were determined (n = 4/group). Log-rank (Mantel-Cox) test for (J); Unpaired t test for (A), (B), (C), (D), (E), (F), (H left), (K); Fisher’s exact test for (H right). In all panels, data are presented as violin plot with median and quartiles, or as mean ± SD. *P ≤ 0.05; **P ≤ 0.01; ***P ≤ 0.001, ****P ≤ 0.0001. Comparisons with P > 0.05 (ns, not significant) are not displayed.

References

    1. Galon J et al., Type, density, and location of immune cells within human colorectal tumors predict clinical outcome. Science 313, 1960–1964 (2006). - PubMed
    1. Galon J, Bruni D, Approaches to treat immune hot, altered and cold tumours with combination immunotherapies. Nat Rev Drug Discov 18, 197–218 (2019). - PubMed
    1. Kurtulus S et al., Checkpoint Blockade Immunotherapy Induces Dynamic Changes in PD-1(-)CD8(+) Tumor-Infiltrating T Cells. Immunity 50, 181–194 e186 (2019). - PMC - PubMed
    1. Spitzer MH et al., Systemic Immunity Is Required for Effective Cancer Immunotherapy. Cell 168, 487–502 e415 (2017). - PMC - PubMed
    1. Bonaventura P et al., Cold Tumors: A Therapeutic Challenge for Immunotherapy. Front Immunol 10, 168 (2019). - PMC - PubMed

MeSH terms