. 2025 Apr 25;388(6745):eadj0430.
doi: 10.1126/science.adj0430. Epub 2025 Apr 25.

Distinct adipose progenitor cells emerging with age drive active adipogenesis

Affiliations

Distinct adipose progenitor cells emerging with age drive active adipogenesis

Guan Wang et al. Science. .

Abstract

Starting at middle age, adults often suffer from visceral adiposity and associated adverse metabolic disorders. Lineage tracing in mice revealed that adipose progenitor cells (APCs) in visceral fat undergo extensive adipogenesis during middle age. Thus, despite the low turnover rate of adipocytes in young adults, adipogenesis is unlocked during middle age. Transplantations quantitatively showed that APCs in middle-aged mice exhibited high adipogenic capacity cell-autonomously. Single-cell RNA sequencing identified a distinct APC population, the committed preadipocyte, age-enriched (CP-A), emerging at this age. CP-As demonstrated elevated proliferation and adipogenesis activity. Pharmacological and genetic manipulations indicated that leukemia inhibitory factor receptor signaling was indispensable for CP-A adipogenesis and visceral fat expansion. These findings uncover a fundamental mechanism of age-dependent adipose remodeling, offering critical insights into age-related metabolic diseases.


Conflict of interest statement

Competing interests

Authors declare that they have no competing interests.

Figures
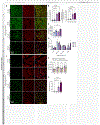
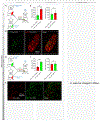
Fig. 1.
Fig. 1.. Adipogenesis increases in middle-aged mice and correlates with visceral adiposity.
(A) Representative GFP and perilipin immunofluorescence staining of gWAT samples from the AdipoChaser-mTmG male mice at the indicated ages. (White asterisks indicate perilipin+GFP adipocytes; yellow asterisks indicate perilipin+GFP+ adipocytes.) (B) Quantification of adipogenesis rate (left: percentage of GFP adipocytes in perilipin+ adipocytes; right: normalization to 3m) in gWAT at the indicated ages. (C to E) Quantification of mean adipocyte size (C), cell size distribution (D), and comparison between mean cell size of pre-existed adipocytes (GFP+ adipocytes) and all adipocytes (perilipin+ adipocytes) (E) in gWAT at the indicated ages. n=3, 3-month-old; n=4, 6-month-old; n=3, 9-month-old; n=5, 12-month-old. At least 2 representative images per mouse were quantified. Each dot represents one mouse. **p<0.01; ***p<0.001; ****p<0.0001; two-way ANOVA. All data represent the mean ± s.e.m. Dunnett’s Test was used to make corrections to multiple comparisons. (F) Representative GFP and perilipin immunofluorescence staining of gWAT samples from the PdgfrαChaser-mTmG male mice at the indicated ages. (White asterisks indicate perilipin+GFP adipocytes; yellow asterisks indicate perilipin+GFP+ adipocytes.) (G) Quantification of adipogenesis rate (percentage of GFP+ adipocytes in perilipin+ adipocytes) in gWAT at the indicated ages. n=3 per group. At least 2 representative images per mouse were quantified. Each dot represents one mouse. ***p<0.001; ****p<0.0001; two-way ANOVA. All data represent the mean ± s.e.m. Dunnett’s Test was used to make corrections to multiple comparisons.
Fig. 2.
Fig. 2.. High adipogenic rate of APCs in middle-aged mice.
(A) APCs (Lin, CD45CD31Ter119) were enriched from isolated SVFs from both 2.5-month-old male CAG-EGFP and 12-month-old Rosa26-mTmG mice. An equal number of GFP+ and Tomato+ cells (1 × 10⁵) were mixed and suspended in Matrigel. The cell mixture was transplanted into the sWAT of 2.5-month-old male WT mice. (B) Matrigel plugs of transplant of mixed APCs (Lin, CD45CD31Ter119) isolated from 2.5-month-old male CAG-EGFP and 12-month-old Rosa26-mTmG mice were dissected a month later and profiled for 3-dimensional Tomato and GFP signals. (C) Quantification of Tomato+ and GFP+ adipocyte number and mean cell size. n=3 transplantations from 3 independent experiments. *p<0.05; two-tailed Student’s t-test. All data represent the mean ± s.e.m. (D) APCs (Lin, CD45CD31Ter119) were enriched from isolated SVFs from both 2.5-month-old male Rosa26-mTmG and 12-month-old CAG-EGFP mice. An equal number of Tomato+ and GFP+ cells (1 × 10⁵) were mixed and suspended in Matrigel. The cell mixture was transplanted into the sWAT of 2.5-month-old male WT mice. (E) Matrigel plugs of transplant of mixed APCs (Lin, CD45CD31Ter119) isolated from 2.5-month-old male Rosa26-mTmG and 12-month-old CAG-EGFP mice were dissected a month later and profiled for 3-dimensional Tomato and GFP signals. (F) Quantification of Tomato+ and GFP+ adipocyte number and mean cell size. n=3 transplantations from 2 independent experiments. **p<0.01; two-tailed Student’s t-test. All data represent the mean ± s.e.m.
Fig. 3.
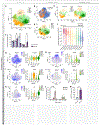
Fig. 3.. scRNA-seq analysis identifies an age-specific committed preadipocyte population (CP-A) in mice.
(A) Progenitor populations from each group (4,337 “2-month-old” and 10,757 “12-month-old” cells) were selected for t-distributed stochastic neighbor embedding (tSNE) plot. K-means clustering (k=25) was applied to the tSNE plot to identify five clusters, ASC, IAP, CP-1, CP-2, and CP-A. Data are from a single experiment. n=3 per group. (B and C) tSNE plot showing differences between APCs from the two age groups, indicating the CP-A cluster only existed in the middle-aged group. (D) Slingshot trajectory analysis of five clusters showing a new, age-specific trajectory from ASC to CP-A. (E) The percentage of each cluster of APCs from the two age groups. n=3 per group. **p<0.01; two-way ANOVA. All data represent the mean ± s.e.m. (F) Box plot showing median and distribution of CytoTRACE values (modified gene count measure) per APC subtypes in the two age groups. A Higher CytoTRACE value means less differentiated status. (G to K) Individual gene tSNE and violin plots showing the expression and distribution of representative marker genes: general APC marker Pdgfra (G), cluster-specific markers Cd55 for ASC (H), Apoe for CP-1 (I), Mfap4 for CP2 (J), and Lifr for CP-A (K). (L) Flow cytometry analysis shows the percentage of CP-As (GFP+ cells) in APCs in the gWAT and sWAT of male Thbs1-mGFP mice at indicated ages. n=3 per group. **p<0.01; ****p<0.0001; two-way ANOVA. All data represent the mean ± s.e.m. (M) FACS-isolated ASCs (PDGFRα+DPP4+ cells) from 2.5-month-old or 12-month-old Rosa26-mTmG male mice were suspended in Matrigel and transplanted into the sWAT of 2.5-month-old male WT mice (3×10⁵ per one sWAT). After 3 days, SVFs from the sWAT with transplanted Matrigel plug were analyzed for the percentage of CP-As (Tomato+PDGFRα+LIFRhigh) in all transplanted APCs (Tomato+PDGFRα+). n=3 per group. **p<0.01; two-tailed Student’s t-test. All data represent the mean ± s.e.m.
Fig. 4.
Fig. 4.. Enrichment of CP-As in human visceral WAT during early aging.
(A) The APCs from 5 human donors were selected for tSNE plot. (B) ASC and CP-A score of clusters in human APCs. The scores calculate the top 20 ASC and CP-A marker genes for each cell. (C to E) Individual gene tSNE plots showing the expression levels of the indicated genes: adipocyte stem cell/progenitor marker PDGFRA (C), ASC marker PI16 (D), and CP-A marker LIFR (E). (F) Flow cytometry analysis shows the correlation of LIFRhigh cell (CP-A) percentage within the PDGFRα+ population (APCs) in each peripancreatic WAT sample from male donors with different ages. r=0.8206, p=0.0454. (G) Immunofluorescence staining of CD29 and LIFR in peripancreatic WAT samples from male donors of different ages.
Fig. 5.
Fig. 5.. CP-As are highly proliferative and adipogenic in vitro.
(A) Top upregulated pathways in ASCs comparing the two age groups. (B) Top pathways in the age-specific CP-As. Enrichment score (A and B): Number of Overlapped genes/number of genes in our cell type-specific geneset × 20000/number of genes in the pathway. Pathway source: HALLMARK. Statistic cut-off: FDR<0.05 (C) Experimental design. ASCs and CP-1s were enriched from the SVFs isolated from the gWAT of 2.5-month-old male Rosa26-mTmG mice; ASCs and CP-As were enriched from the SVFs isolated from the gWAT of 12-month-old male Rosa26-mTmG mice. For each APC population, 1 × 10⁴ cells were suspended in Matrigel and seeded in tissue culture dishes. 16 hours later, the adipogenic cocktail was added to induce APC differentiation. Cells were imaged 6 days later with BODIPY labeling lipid droplets. (D) Representative confocal fluorescent images show Tomato+ cells and BODIPY+ adipocytes (green cells are positive for BODIPY staining) from ASCs from mice of the indicated ages. (E) Quantification of ASC adipogenesis, adipocyte number (BODIPY+ cells), and total cell number (Tomato+ cells), comparing between the two age groups. n=3 per group from 2 independent experiments. (F) Representative confocal fluorescent images show Tomato+ cells and BODIPY+ adipocytes (green cells are positive for BODIPY staining) from young CP-1s and CP-As. (G) Quantification of adipogenesis rate of CP-1s and CP-As, adipocyte number (BODIPY+ cells), and total cell number (Tomato+ cells). 2.5 months old, n=3; 12 months old, n=4; from 2 independent experiments.
Fig. 6.
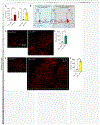
Fig. 6.. CP-As are highly proliferative and adipogenic in vivo.
(A) Flow cytometry analysis of EdU+ proliferating cell percentage in ASCs from both aged groups, CP-1s from 2.5-month-old mice, and CP-As from 12-month-old mice. (B) Experimental design. Young DPP4 (non-ASC) APCs and CP-1s were enriched from the SVFs isolated from the gWAT of 2.5-month-old male Rosa26-mTmG mice. Middle-aged DPP4 (non-ASC) APCs and CP-As were enriched from the SVFs isolated from the gWAT of 12-month-old male Rosa26-mTmG mice. For each APC population, 2 × 10⁴ cells were enriched. Each enriched APC population was suspended in Matrigel and transplanted into the sWAT of 2.5-month-old WT male mice. Young and middle-aged DPP4 APCs were transplanted into either side of the sWAT of the same 2.5-month-old male WT mice. Young CP-1s and middle-aged CP-As were transplanted into either side of the sWAT of the same 2.5-month-old male WT mice. (C) Dissected Matrigel plugs were profiled for 3-dimensional Tomato signals from DPP4 transplants. (D) Quantification of Tomato+ adipocyte number generated from young and middle-aged DPP4 APCs. n=3 transplantations from a single experiment. (E) Dissected Matrigel plugs were profiled for 3-dimensional Tomato signals from CP-1 and CP-A transplants. (F) Quantification of Tomato+ adipocyte number generated from young CP-1s and middle-aged CP-As. n=4 transplantations from 2 independent experiments. *p<0.05; **p<0.01; two-tailed Student’s t-test. All data represent the mean ± s.e.m.
Fig. 7.
Fig. 7.. Requirement of LIFR-STAT3 signaling for CP-A adipogenesis.
(A) Representative confocal fluorescent images show Tomato+ cells and BODIPY+ adipocytes (green cells are positive for BODIPY staining). CP-1s were isolated from gWAT of 2.5-month-old, and CP-As were isolated from the gWAT of 12-month-old male Rosa26-mTmG mice, respectively. 5 × 10³ cells were suspended in Matrigel and seeded in tissue culture dishes. 16 hours later, the adipogenic cocktail was added to induce differentiation with or without LIFR inhibitor EC359 (1nM). Cells were imaged 6 days later with BODIPY labeling lipid droplets. (B) Quantification of adipogenesis rate under EC359 treatment. n=3 per group. ****p<0.0001; two-way ANOVA. Data represent the mean ± s.e.m. (C) CP-As were isolated from the gWAT of 12-month-old male CAG-EGFP mice. 2 × 10⁴ cells were suspended in Matrigel and transplanted into the sWAT of 2.5-month-old WT male mice. Recipient mice were treated with vehicle or LIFR inhibitor EC359 at 5mg/kg s.c. for 3 times per week. Matrigel plugs were dissected and profiled for 3-dimensional GFP signal 2 weeks after transplantation. (D) Quantification of GFP+ adipocyte number generated from EC359-treated CP-A transplants. n=3 transplantations from 2 independent experiments. *p<0.05; two-tailed Student’s t-test. Data represent the mean ± s.e.m. (E) Representative confocal fluorescent images show Tomato+ cells and BODIPY+ adipocytes (green cells are positive for BODIPY staining). Lin (CD45CD31Ter119) SVFs isolated from the gWAT of 12-month-old male Rosa26-mTmG mice were transfected with ctrl or LIFR shRNA lentiviral particles. 5 × 10³ cells were suspended in Matrigel and seeded in tissue culture dishes. 16 hours later, the adipogenic cocktail was added to induce APC differentiation. Cells were imaged 6 days later with BODIPY labeling lipid droplets. (F) Quantification of adipogenesis rate, adipocyte number (BODIPY+ cells), and total cell number (Tomato+ cells) of LIFR-knockdown cells. n=3 per group. **p<0.01; ***p<0.001; ****p<0.0001; two-tailed Student’s t-test. All data represent the mean ± s.e.m. (G) Lin (CD45CD31Ter119) SVFs isolated from the gWAT of 12-month-old male Rosa26-mTmG mice were transfected with ctrl or LIFR shRNA lentiviral particles. 2 × 10⁴ cells were suspended in Matrigel and transplanted into the sWAT of 2.5-month-old WT male mice. Matrigel plugs were dissected 2 weeks after transplantation and profiled for 3-dimensional Tomato signal. (H) Quantification of Tomato+ adipocyte number generated from LIFR-knockdown transplants. n=3 transplants from 2 independent experiments. *p<0.05; two-tailed Student’s t-test. Data represent the mean ± s.e.m. (I) Representative confocal fluorescent images show Tomato+ cells and BODIPY+ adipocytes (green cells are positive for BODIPY staining). Lin (CD45CD31Ter119) SVFs isolated from the gWAT of 2.5-month-old male Rosa26-mTmG mice were transfected with ctrl or LIFR over-expression lentiviral particles. 2 × 10⁴ transfected cells were suspended in Matrigel and seeded in tissue culture dishes. 16 hours later, the adipogenic cocktail was added to induce APC differentiation. Cells were imaged 6 days later with BODIPY labeling lipid droplets. (J) Quantification of adipogenesis rate, adipocyte number (BODIPY+ cells), and total cell number (Tomato+ cells) of LIFR-overexpression cells. n=3 per group. *p<0.05; two-tailed Student’s t-test. All data represent the mean ± s.e.m. (K) Lin (CD45CD31Ter119) SVFs isolated from the gWAT of 2.5-month-old male CAG-EGFP mice were transfected with ctrl or LIFR over-expression lentiviral particles. 2 × 10⁴ transfected cells were suspended in Matrigel and transplanted into the sWAT of 2.5-month-old WT male mice. Matrigel plugs were dissected 2 weeks after transplantation and profiled for a 3-dimensional GFP signal. (L) Quantification of GFP+ adipocyte number generated from LIFR over-expression transplants. n=3 transplants from 2 independent experiments. *p<0.05; two-tailed Student’s t-test. All data represent the mean ± s.e.m. (M and N) 9-month-old WT male mice were treated with LIFR inhibitor EC359 (5mg/kg i.p.) or vehicle for 10 weeks. Tissue weight of gWAT (M) and sWAT (N) after treatment. n=7 per group. **p<0.01; two-tailed Student’s t-test. All data represent the mean ± s.e.m.

References

    1. Flegal KM, Kruszon-Moran D, Carroll MD, Fryar CD, Ogden CL, Trends in Obesity Among Adults in the United States, 2005 to 2014. JAMA 315, 2284–2291 (2016). - PMC - PubMed
    1. Gallagher D et al. , Healthy percentage body fat ranges: an approach for developing guidelines based on body mass index. Am J Clin Nutr 72, 694–701 (2000). - PubMed
    1. Flegal KM, Carroll MD, Ogden CL, Curtin LR, Prevalence and trends in obesity among US adults, 1999-2008. Jama 303, 235–241 (2010). - PubMed
    1. Stenholm S et al. , Sarcopenic obesity: definition, cause and consequences. Curr Opin Clin Nutr Metab Care 11, 693–700 (2008). - PMC - PubMed
    1. Roh E, Choi KM, Health Consequences of Sarcopenic Obesity: A Narrative Review. Frontiers in Endocrinology 11, (2020). - PMC - PubMed