. 2025 Jun 4;34(12):1040-1056.
doi: 10.1093/hmg/ddaf057.

Generation of a compound heterozygous ABCA4 rat model with pathological features of STGD1

Affiliations

Generation of a compound heterozygous ABCA4 rat model with pathological features of STGD1

Clément Morival et al. Hum Mol Genet. .

Abstract

The ABCA4 protein plays an essential role in mammalian vision, ensuring the correct localization of all-trans-retinal within the visual cycle. Mutations in the ABCA4 gene are responsible for the juvenile maculopathy, Stargardt disease (STGD1). We investigated the most common variant underlying STGD1 phenotype in a rat model carrying the ortholog to the human c.5882G > A/p.(Gly1961Glu) (G1961E) in ABCA4. While the pathogenicity of this variant has recently been questioned, we examine here whether the ortholog rat variant is associated with vitamin A toxicity in the retina. By crossing the rat line with a rat line deficient in ABCA4 protein, we reveal a more pathogenic phenotype in line with compound heterozygosity, making the model suitable for testing of gene, cell and pharmacological therapies.

Keywords: ATPase Binding Cassette Transporter 4; G1961E variant; Stargardt disease; genetically modified rat.


Figures

Figure 1
Figure 1
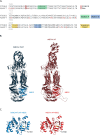
Abca4  E/E rat model design. (A) Protein sequence alignment of human (UniProt—P78363) and rat (UniProt—A6HVF7) ABCA4. Characteristic motifs of ABC transporters, Walker A, Walker B, and signature motifs are highlighted in green, blue, and yellow, respectively. The glycine residue at position 1961 in human ABCA4 (hABCA4) and its orthologous counterpart at position 1938 in rat ABCA4 (rABCA4) are highlighted in red. Amino-acids in rABCA4 that differ from hABCA4 are coloured in red. (B) Molecular structures of hABCA4 (PDB—7LKP) and AlphaFold (AF) predicted rABCA4, showing the location of NBD2. Comparison between structures reveals a high level of similarity between the two proteins. (C) Molecular structures of the NBD2 domain in hABCA4 (PDB—7LKP) and the AF predicted NBD2 domain in rABCA4. The G1961 site in hABCA4 and its orthologous G1938 site in rABCA4 are highlighted in yellow, with an asterisk.
Figure 2
Figure 2
Generation of the Abca4E/E rat model. (A) The gene editing strategy used to generate the Abca4E/E rat model. A single-guide RNA (bold, PAM in blue) was designed to target exon 42 of the rat Abca4 gene. The p.G1938E mutation was introduced by knock-in using a 112 nt ssODN. A portion of this sequence corresponding to exon42 is compared with the WT sequence including bases substitutions to modify the codon to introduce the expected mutation (red sequence) as well as additional synonymous mutations (in lowercase) to avoid cleavage after donor insertion and an AccI restriction site (gtagac, underlined sequence) to facilitate genotyping. The resulting mutated protein sequence is shown under the nucleotidic sequence. (B) The cDNA produced from RNA purified from the F1 rat pup retinas was PCR amplified as shown in the agarose gel. The 329 bp products were sequenced to identify the expected mutation of a G to a a nucleotide, within the shaded boxed region of the electropherogram. (C) Schema showing the genotype–phenotype penetrance reported in individuals carrying a G1961E allele. The Abca4E/E rats and Abca4−/− rats were each backcrossed onto a WT Sprague–Dawley background. The offspring were crossed to generate heterozygotes (Abca4WT/E and Abca4WT/−) as well as the compound heterozygote of interest (Abca4E/−) and the control wild-type rats (Abca4WT/WT) and. The rats from F2 were used in further crosses for subsequent experiments.
Figure 3
Figure 3
Protein expression levels of ABCA4 in the rat Abca4E/E. (A) A representative image from a western blot analysis of ABCA4 protein expression comparing WT/WT, −/−, E/E and E/− rats with 3F4 ABCA4 antibody. The ABCA4 protein banding at approximately 250 kDa is shown and compared to the level of α-tubulin. Membrane and cytosolic fractions were separated for blotting and loaded sequentially. Full length blots including replicates are available in Supplementary Fig. S2. (B) Artificial immunoblots reconstituted from the capillary electrophoresis immunoassay (‘simple western’) data are shown for the cytosolic fraction of ABCA4 in WT/WT, E/E and E/− eyes. The ABCA4 probed band is shown on top and the total protein to normalise the ABCA4 is shown on the bottom. Samples were either isolated retina (NR: Neural retina) or also contained sclera, choroid and RPE (EC: Eye-cup). (B) Quantification from capillary electrophoretic immunoassay of the mislocalised ABCA4 cytosolic protein. Extractions were from neural retinas (filled circle) or eye-cups (semi-filled circle). The ABCA4 protein is normalised to the total protein in the cytosolic fraction and compared between WT/WT (n = 8 rats), E/E (n = 4 rats) and E/− lines (n = 8 rats). Statistical analysis was carried out using the Kruskal-Wallis test and shown differences are not significant (P = 0.09 for NR, P = 0.86 for EC).
Figure 4
Figure 4
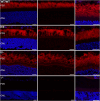
Immunohistochemistry on transgenic Abca4 rat retinas. Staining for ABCA4 was carried out on retinal cryosections from the WT/WT, E/E, −/− and E/− rats to evaluate ABCA4 localisation. ABCA4 is shown in red and the nuclear DAPI stain in blue in the left and right IHC panels. The middle panel shows the ABCA4 signal without DAPI while the right-side panel is a 2x zoom covering the outer- and inner-segments of the photoreceptor. Retinas were analysed from n = 3 rats for each genotype, scale bar = 10 μM. POS: Photoreceptor outer segment, ONL: Outer nuclear layer, INL: Inner nuclear layer, GCL: Ganglion cell layer. NBD2: Nucleotide binding domain 2.
Figure 5
Figure 5
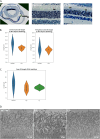
Cone length measurement in the rat retina. (A) Scan of a paraffin-embedded retina is shown on the left with central regions boxed in red and peripheral regions boxed in yellow. Representative images of paraffin sections stained for cone opsins in green with overlay of the haematoxylin eosin are shown for the central retina, middle panel, and peripheral retina, right panel. (B) Violin plots of cone OS length measured by opsin staining in designated regions of the central retina and peripheral retina, n = 5 rats at 3 months of age for each genotype. Differences are not significant. (C) Violin plots of cone OS length measured by PNA stain were measured in designated regions across the retina, n = 5 rats at 3 months of age for each genotype. Differences are not significant. (D) STEM images of the outer and inner segments of photoreceptors were examined between WT/WT, E/E, and E/− rats (n = 1 for each) show no changes in OS structure. Scale bar = 10 μm. OS: Outer segment, STEM: Scanning transmission electron microscopy, PNA: Peanut agglutinin.
Figure 6
Figure 6
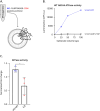
Impact of E/E mutation on ATPase function of ABCA4 protein. (A) ABCA4 protein was immunoaffinity purified from pooled retinas of rats. The eluted rat ABCA4 protein was dialysed on freshly prepared liposomes. Three distinct proteoliposome preparations were generated using n = 6 rats for each preparation. (B) The ATPase activity was measured by a luminescence microtiter-assay in the presence of 1 mM ATP with values normalised to the non-hydrolysable AMP-PNP as a control for the ATP substrate. The values were recorded in response to increasing proteolipid volume (0, 25, 50 and 100 μL). (C) The ATPase activity was measured by a luminescence microtiter-assay in the presence of 250 μM ATP with values normalised to the non-hydrolysable AMP-PNP. The values were recorded in response to 40 μm retinal and normalised to measurements without retinal. WT/WT preps show a significant increase in ATPase activity compared to E/E preps at 40 μm ATR, P = 0.035. Statistical analysis was carried out using an unpaired t-test. * is assigned to P < 0.05. ATR: All-trans-retinal.
Figure 7
Figure 7
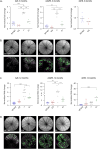
Mass spectrometry analysis of bisretinoids in the rat retinas. Measurements of bisretinoid concentrations were compared in the genotypes WT/WT, E/E, −/− and E/− and presented here as fold changes relative to wild-type levels. All values were normalised to a retinyl acetate sample processing standard. One eye was used from different rats for each data-point. (A) Measurements of A2E, A2GPE and dATR levels in eye-cups of rats at 3 months of age. (B) Representative fundus images from eyes of rats at 3 months of age (top row) and autofluorescent speckles detected in fundus images (bottom row). Green spots show speckles > 10 pixels and magenta show speckles discarded based on size. (C) Measurement of A2E, A2GPE and dATR levels in eye-cups of rats at 12 months of age. (D) Representative fundus images from eyes of rats at 12 months of age (top row) and autofluorescent speckles detected in fundus images (bottom row). Green spots show speckles > 10 pixels and magenta show speckles discarded based on size. Statistical analysis was carried out using ANOVA followed by Tukey’s post hoc test for A2E (3 months), A2GPE (3 and 12 months); Kruskal-Wallis followed by Dunn’s post hoc test for A2E (12 months), dATR (12 months); or an unpaired t-test for dATR (3 months). Significance levels are displayed as * for parametric tests (ANOVA, t-test) and # for non-parametric tests (Kruskal-Wallis). * is assigned to P < 0.05, **P < 0.005, ***P < 0.0005, ****P < 0.00005. A2E: Di-retinoid-pyridinium-ethanolamine, A2GPE: A2-glycerophosphoethanolamine, dATR: Dimers of all-trans retinal.
Figure 8
Figure 8
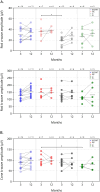
Photoreceptor function in the Abca4E/E and Abca4E/− rat models. (A) Full-field rod ERG responses were recorded to dim flashes on dark-adapted rats. Lines link each individual rat response at 3 months to its response at 12 months. Amplitudes were recorded for a-wave (top panel) and b-wave (bottom panel). (B) Full-field cone-driven ERG responses were recorded to high intensity flashes on light-adapted rats. Lines link each individual rat response at 3 months to its response at 12 months. Statistical analysis was carried out using ANOVA followed by Tukey’s post hoc test for rod a-wave (3 and 12 months), rod b-wave (12 months) and cone b-wave (12 months); or Kruskal-Wallis followed by Dunn’s post hoc test for rod b-wave (3 months), cone b-wave (3 months). Significance levels are displayed as * for parametric tests (ANOVA, t-test) and # for non-parametric tests (Kruskal-Wallis). * is assigned to P < 0.05, **P < 0.005, ***P < 0.0005, ****P < 0.00005.

Similar articles

References

    1. Higgins CF. ABC transporters: from microorganisms to man. Annu Rev Cell Biol 1992;8:67–113. - PubMed
    1. Sun H, Nathans J. Stargardt’s ABCR is localized to the disc membrane of retinal rod outer segments. Nat Genet 1997;17:15–16. - PubMed
    1. Molday RS, Garces FA, Scortecci JF. et al. Structure and function of ABCA4 and its role in the visual cycle and Stargardt macular degeneration. Prog Retin Eye Res 2022;89:101036. - PubMed
    1. Eldred GE, Lasky MR. Retinal age pigments generated by self-assembling lysosomotropic detergents. Nature 1993;361:724–726. - PubMed
    1. Mata NL, Weng J, Travis GH. Biosynthesis of a major lipofuscin fluorophore in mice and humans with ABCR-mediated retinal and macular degeneration. Proc Natl Acad Sci USA 2000;97:7154–7159. - PMC - PubMed

Substances