. 2025 Jun 26;188(13):3513-3529.e26.
doi: 10.1016/j.cell.2025.03.045. Epub 2025 Apr 23.

Transcriptional regulation by PHGDH drives amyloid pathology in Alzheimer's disease

Affiliations

Transcriptional regulation by PHGDH drives amyloid pathology in Alzheimer's disease

Junchen Chen et al. Cell. .

Abstract

Virtually all individuals aged 65 or older develop at least early pathology of Alzheimer's disease (AD), yet most lack disease-causing mutations in APP, PSEN, or MAPT, and many do not carry the APOE4 risk allele. This raises questions about AD development in the general population. Although transcriptional dysregulation has not traditionally been a hallmark of AD, recent studies reveal significant epigenomic changes in late-onset AD (LOAD) patients. We show that altered expression of the LOAD biomarker phosphoglycerate dehydrogenase (PHGDH) modulates AD pathology in mice and human brain organoids independent of its enzymatic activity. PHGDH has an uncharacterized role in transcriptional regulation, promoting the transcription of inhibitor of nuclear factor kappa-B kinase subunit alpha (IKKa) and high-mobility group box 1 (HMGB1) in astrocytes, which suppress autophagy and accelerate amyloid pathology. A blood-brain-barrier-permeable small-molecule inhibitor targeting PHGDH's transcriptional function reduces amyloid pathology and improves AD-related behavioral deficits. These findings highlight transcriptional regulation in LOAD and suggest therapeutic strategies beyond targeting familial mutations.

Keywords: Alzheimer’s disease; LOAD; PHGDH; amyloid pathology; astrocyte; biomarker; small molecule; therapeutic candidate; transcriptional regulation.


Conflict of interest statement

Declaration of interests S.Z. is a founder and shareholder of Genemo, Inc. and Neurospan, LLC.

Figures
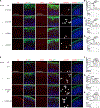
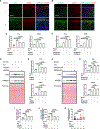
Figure 1.
Figure 1.. PHGDH promotes Aβ aggregates and synaptic loss in LOAD-BO
(A–D) Representative images and quantification of Aβ aggregates, SYN1 puncta, and activated CASPASE-3-positive (aCASP3+) cells in 142-day BOs with and without serum (serum = + and −), with astrocyte-specific KD of PHGDH (KD column) using two shRNAs (shRNA1 and shRNA2) and a scramble control (Scr). (E–H) Representative images and quantification of Aβ aggregates, SYN1 puncta, and aCASP3+ cells with astrocyte-specific expression of WT PHGDH (PHGDH-WT), enzymatic-dead PHGDH (PHGDH-ED), and GFP (Ctrl) (OE column). Arrows, CASPASE-3-positive cells. n = 3 biological replicates. Error bars: mean ± SE. p values were derived from two-sided t test or one-way ANOVA. Scale bar, 100 μm. See also Figures S1–S4.
Figure 2.
Figure 2.. PHGDH associates with promoters and regulates transcription
(A–C) ChIP-seq analysis in BOs. (A) ChIP-seq experimental design. (B) Distribution of PHGDH ChIP-seq peaks among different genomic features, showing an enrichment in promoters. (C) A representative genome-track view of ChIP-seq signals in the two biological replicates (replicate = 1 and 2), with and without serum (serum = + and −), with and without PHGDH KD (KD = + and −). Red box, a ChIP-seq peak. (D–F) ChIP-qPCR and luciferase assays in U87MG cells. (D) Comparison of ChIP-qPCR signals between transfection of WT PHGDH (PHGDH-WT) and HHTH-deleted PHGDH (PHGDH-dHHTH). IgG was used as ChIP’s internal reference. Additional genomic regions including GAPDH’s intron 1 (GAPDH) and ACTB’s intron 2 (ACTB) were included as negative controls. (E and F) Promoter activities measured by a dual luciferase assay (y axis) in cells transfected with the control vector (vector), PHGDH-WT, or PHGDH-dHHTH (E), together with WT (cis-WT) or mutated promoters (cis-Mut) (F). The NEDD4L and the NFKBIB promoters each contain two motif instances, which were separately tested, with data detonated as NEDD4L-1, NEDD4L-2, NFKBIB-1, and NFKBIB-2, respectively. n = 3 biological replicates. Error bars: mean ± SE. ns, p > 0.05; *p < 0.05; **p < 0.01; and ***p < 0.001. p values were derived from two-sided t test or one-way ANOVA. See also Figures S5 and S6.
Figure 3.
Figure 3.. PHGDH regulates IKKa and HMGB1 expression
(A and B) Co-immunostaining of IKKa (A) or HMGB1 (B) with GFAP in 142-day BOs treated with (+) or without (−) serum. (C–E) RT-qPCR and western blot analysis showing mRNA and protein levels of IKKa and HMGB1 in 142-day BOs with or without serum (serum = + and −), with astrocyte-specific KD of PHGDH using two shRNAs (shRNA1 and shRNA2) and a scramble control (Scr). n = 3 biological replicates. (F–H) RT-qPCR and western blot analysis showing mRNA and protein levels of IKKa and HMGB1 in 142-day BOs with or without serum (serum = + and −), with astrocyte-specific overexpression of WT PHGDH (PHGDH-WT), enzymatic-dead PHGDH (PHGDH-ED), and GFP (Ctrl). n = 3 biological replicates. (I–K) Quantification of nuclear-localized NF-κB, phosphorylated mTOR (p-mTOR), and autophagosome in 142-day BOs with and without serum (serum = + and −), with astrocyte-specific KD of PHGDH (KD column) using two shRNAs (shRNA1 and shRNA2) and a Scr. n = 3 biological replicates for (I) and (J). n = 30 biological replicates for (K). Error bars: mean ± SE. p values were derived from two-sided t test or one-way ANOVA. Scale bar, 100 μm. See also Figure S7.
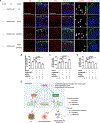
Figure 4.
Figure 4.. Dual KD of IKKa and HMGB1 ameliorates PHGDH-induced AD pathology
(A–D) Representative images and quantification of Aβ aggregates, SYN1 puncta, and activated CASPASE-3-positive (aCASP3+) cells in 142-day BOs with KD of IKKa (siRNA = siIKKa) and HMGB1 (siRNA = siHMGB1), dual KD of IKKa and HMGB1 (siRNA = siIKKa + siHMGB1), or with scramble siRNA (siRNA = Scr). n = 3 biological replicates. Error bars: mean ± SE. p values were derived from one-way ANOVA. Scale bar, 100 μm. (E) A model of PHGDH’s role in LOAD development. See also Figure S7.
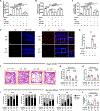
Figure 5.
Figure 5.. NCT-503 ameliorates AD pathology and behavioral deficits
(A–C) Quantification of Aβ aggregates, SYN1 puncta, and activated CASPASE-3-positive (aCASP3+) cells in 142-day BOs with and without serum exposure (serum = + and −), where the culture media are supplied with DMSO, NCT-503, IPA, L-serine, or NCT-503 and L-serine (NCT-503 + L-serine). n = 3 biological replicates. (D) Representative immunostaining images of the dentate gyrus (DG) of 5.5-month-old 5XFAD mice injected with DMSO (Veh) and NCT-503 (NCT). (E) Quantification of the Aβ plaques in DG. The average number of Aβ plaques (y axis) is calculated from four coronal sections of a half hemisphere in each mouse (dot). n = 3 or 5 biological replicates. (F) Representative movement traces of WT and APP-KI mice treated with DMSO (Veh) or NCT-503 (NCT) during open field tests. (G and H) Time spent (G) and distance traveled (H) in the center of the arena. n = 6 or 10 biological replicates. (I) Percentage of escape strategies (random, serial, and direct) across trials (trial 1, trial 2, and trial 3) and the test phase in the Barnes maze. (J) Escape distance during the test in the Barnes maze. n = 6 or 10 biological replicates. Error bars represent mean ± SE. p values were derived from two-sided t test, one-way ANOVA, or two-way ANOVA. Scale bar, 100 μm. See also Figures S8–S10.

References

    1. Lambert JC, Ibrahim-Verbaas CA, Harold D, Naj AC, Sims R, Bellenguez C, DeStafano AL, Bis JC, Beecham GW, Grenier-Boley B, et al. (2013). Meta-analysis of 74,046 individuals identifies 11 new susceptibility loci for Alzheimer’s disease. Nat. Genet 45, 1452–1458. 10.1038/ng.2802. - DOI - PMC - PubMed
    1. Bertram L, Lill CM, and Tanzi RE (2010). The genetics of Alzheimer disease: back to the future. Neuron 68, 270–281. 10.1016/j.neuron.2010.10.013. - DOI - PubMed
    1. Rademakers R, Cruts M, and van Broeckhoven C (2004). The role of tau (MAPT) in frontotemporal dementia and related tauopathies. Hum. Mutat 24, 277–295. 10.1002/humu.20086. - DOI - PubMed
    1. Corder EH, Saunders AM, Strittmatter WJ, Schmechel DE, Gaskell PC, Small GW, Roses AD, Haines JL, and Pericak-Vance MA (1993). Gene dose of apolipoprotein E type 4 allele and the risk of Alzheimer’s disease in late onset families. Science 261, 921–923. 10.1126/science.8346443. - DOI - PubMed
    1. Long JM, and Holtzman DM (2019). Alzheimer Disease: An Update on Pathobiology and Treatment Strategies. Cell 179, 312–339. 10.1016/j.cell.2019.09.001. - DOI - PMC - PubMed

MeSH terms