. 2025 Apr 23;13(4):e011155.
doi: 10.1136/jitc-2024-011155.

Gut microbiota derived indole-3-acetic acid ameliorates precancerous inflammatory intestinal milieu to inhibit tumorigenesis through IL-35

Affiliations

Gut microbiota derived indole-3-acetic acid ameliorates precancerous inflammatory intestinal milieu to inhibit tumorigenesis through IL-35

Juanjuan Wang et al. J Immunother Cancer. .

Abstract

Background: Gut microbiota can significantly alter the risk or progression of cancer by maintaining gut immune system homeostasis. However, the exact mechanism by which the gut microbiota and its metabolites influence colorectal tumorigenesis is unclear.

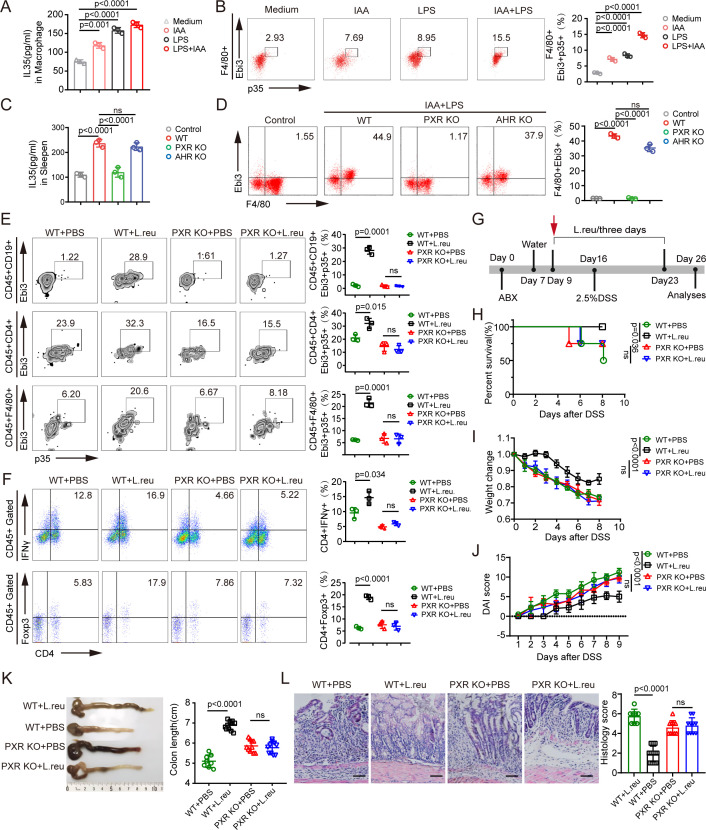
Methods: The roles of tryptophan metabolite indole-3-acetic acid (IAA) in inflammation and tumor development were investigated in dextran sodium sulfate (DSS) and azoxymethane (AOM)-DSS mouse models with or without IAA supplementation and with or without Lactobacillus reuteri-produced IAA. Pregnane X receptor (PXR) knockout (KO) mice and aryl hydrocarbon receptor KO mice were used to explore the mechanism by which IAA regulates interleukin (IL)-35 expression. IL-35+ immune cells were stimulated in vitro and analyzed by flow cytometry. Additionally, metabolites were analyzed by liquid chromatography-mass spectrometry.

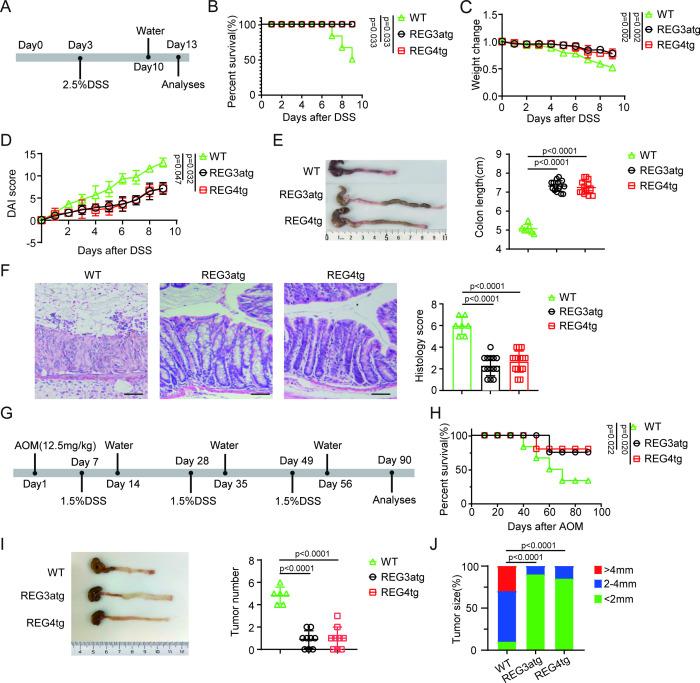
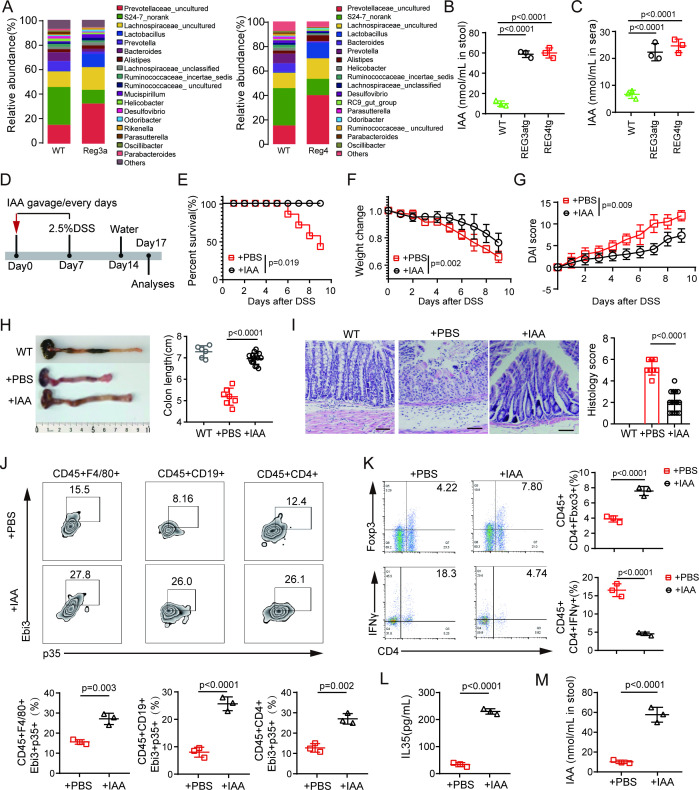
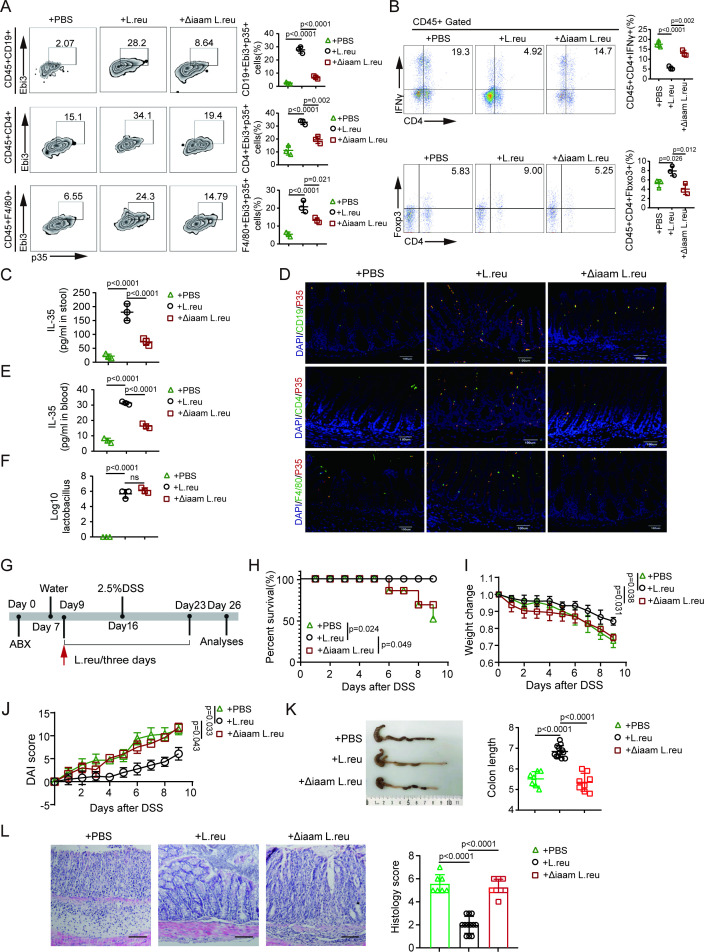
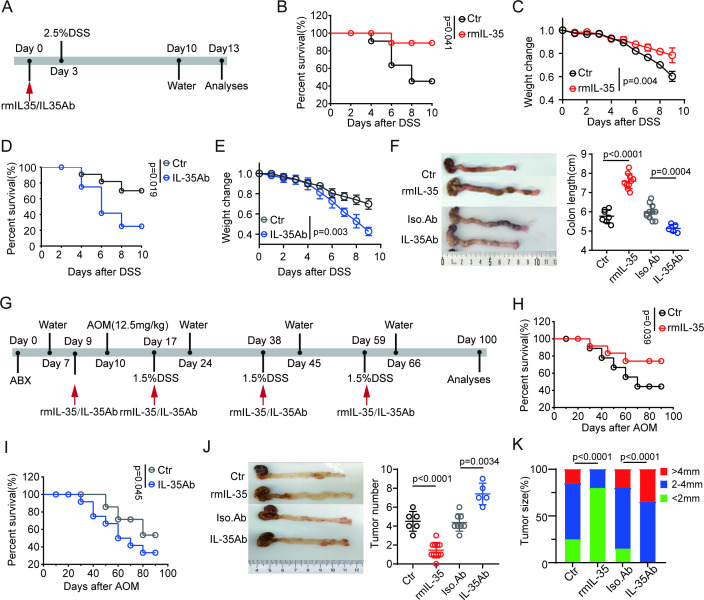
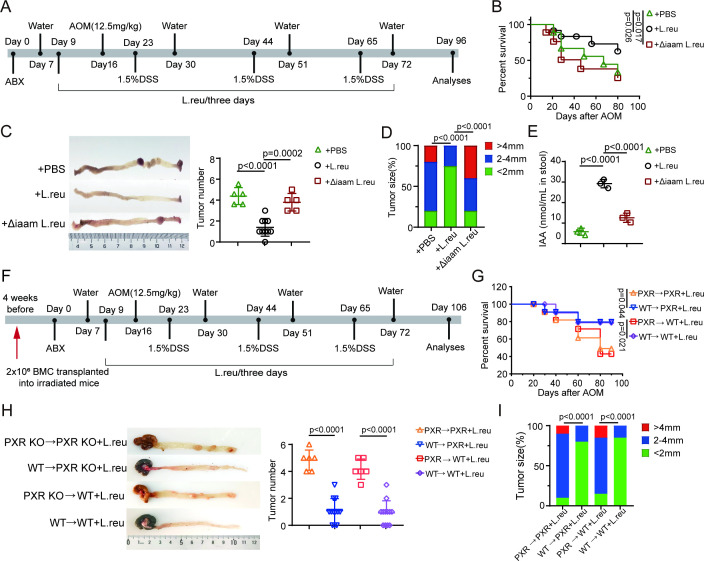
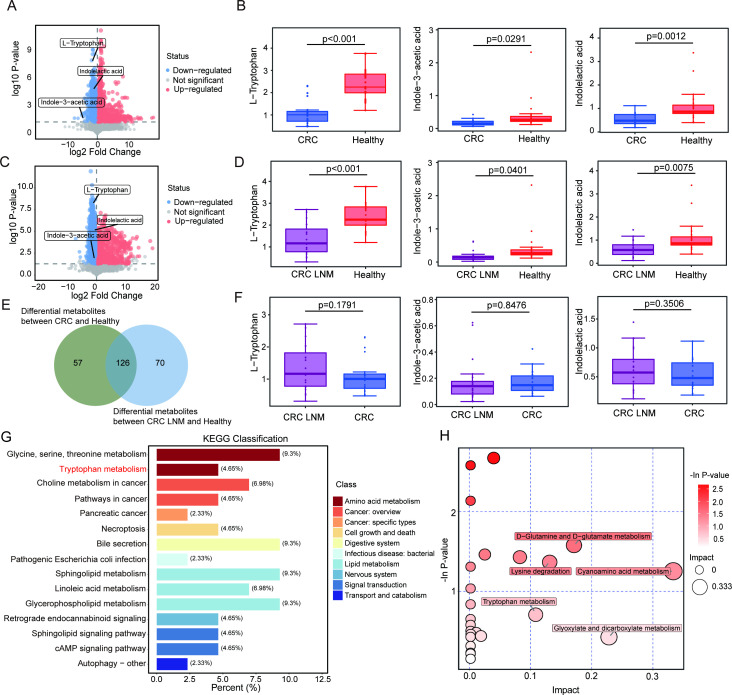
Results: We found that IAA, a metabolite of tryptophan produced in the gut by L. reuteri, can inhibit the development of colitis by inducing IL-35 expression in immunosuppressant cells. HuREG3αIECtg mice had high levels of intestinal microbiota-derived IAA, and these mice were resistant to AOM-DSS-induced cancer. Patients with colorectal cancer also had low peripheral blood levels of IAA. Further studies revealed that IAA-producing L. reuteri alleviated colitis symptoms and inhibited colon tumors by inducing macrophages, T cells, and B cells to produce IL-35. Finally, PXR KO completely abolished the effects of IAA on immune cells.

Conclusion: We demonstrate that gut microbiota-derived IAA can improve the precancerous colon inflammatory environment through IL-35, thereby inhibiting tumorigenesis, suggesting that IAA may be a preventive factor for colitis-related cancers.

Keywords: Colorectal Cancer; Immune modulatory; Immunosuppression; Macrophage.


Conflict of interest statement

Competing interests: None declared.

Figures

Figure 1
Figure 1. HuREG3αIECtg mice are resistant to AOM-DSS-mediated colitis carcinoma. (A) Schematic diagram of DSS-induced colitis model in huREG3αIECtg (REG3atg), huREG4IECtg (REG4tg) and their control (WT) mice. Mice were exposed to 2.5% DSS for 7 days, and followed by regular water for 3 days. (B) Survival rates of the mice in indicated groups, n=15 mice (7–8 weeks, male)/group. (C–D) Body weight changes (C) and Disease Activity Index (D) in the indicated groups after DSS (WT, n=7; REG3atg, n=15; REG4tg, n=15). (E) Representative colon images and statistical analysis of colon length in the indicated groups (WT, n=7; REG3atg, n=15; REG4tg, n=15). (F) Representative H&E staining images and histological analysis of the colon tissues from the indicated groups (WT, n=7; REG3atg, n=15; REG4tg, n=15); scale bar=45 µm. (G) Schematic diagram of the experimental design for the AOM-DSS-induced colitis cancer model; After the initial AOM injection (12.5 mg/kg), three cycles of 1.5% DSS were administered to mice in drinking water. (H) Survival rates of the mice in indicated groups, n=15 mice (7–8 weeks, male)/group. (I) Representative images and statistical analysis of colon tumor numbers in the indicated groups (WT, n=6; REG3atg, n=9; REG4tg, n=9). (J) Tumor size distribution in the indicated groups (WT, n=6; REG3atg, n=9; REG4tg, n=9). Error bars indicate mean±SD (C–E and I) or mean±SEM (F). Statistic test: two-way analysis of variance test (C and D); unpaired Student’s t-test (E–F and I); log-rank (Mantel-Cox) test (B and H); Fisher’s exact test (J). Data were representative of three experiments. AOM, azoxymethane; DSS, dextran sulfate sodium; WT, wild-type.
Figure 2
Figure 2. Resistance of huREG3αIECtg mice to DSS-mediated colitis is through gut microbiota derived IAA. (A) 16S rRNA analyses of the gut microbiota in huREG3αIECtg (REG3a), huREG4IECtg (Reg4) and their control mice (WT); each sample was a pooled sample from six mice. (B and C) Analyses of the IAA contents in the stool (B) and serum (C) of the indicated groups. (D) Schematic diagram of the experimental design for determining the effect of IAA on DSS-mediated colitis. Mice were treated with IAA via gavage daily for 7 days before exposure to 2.5% DSS. (E) Survival rates of the mice treated with or without IAA, n=15 mice (7–8 weeks, male)/group. (F–G) Body weight changes (F) and Disease Activity Index (G) of the mice treated with IAA or PBS after DSS (PBS, n=7; IAA, n=10). (H) Representative colon images and statistical analysis of colon length in mice treated with IAA or PBS (WT, n=6; PBS, n=7; IAA, n=10). WT, control mice without DSS; (I) Representative H&E staining images and histological analysis of colon tissues from the mice treated with IAA or PBS (WT, n=6; PBS, n=7; IAA, n=10). WT, control mice without DSS; scale bar=45 µm. (J) Flow cytometry analyses of CD45+ F4/80+Ebi3+P35+ cells in the colon tissues of mice treated with IAA or PBS. (K) Flow cytometry analyses of CD45+CD4+IFN-γ+ cells in the colon tissues of mice treated with IAA or PBS. (L–M) Concentration of IL-35 (L) and IAA (M) in the stool of mice treated with IAA or PBS. Error bars indicate mean±SD (B, C, F–H and J–M) or mean±SEM (I). Statistic test: two-way analysis of variance test (F and G); unpaired Student’s t-test (B, C and H–M): log-rank (Mantel-Cox) test (E). Data were representative of three experiments. DSS, dextran sulfate sodium; IAA, indole-3-acidic acid; IEC, intestinal epithelial cell; IFN, interferon; PBS, phosphate-buffered saline; WT, wild-type.
Figure 3
Figure 3. Lactobacillus-derived IAA promotes IL-35 in immune cells. (A) Flow cytometry analyses of CD45+CD19+Ebi3+P35+, CD45+CD4+Ebi3+P35+ and CD45+F4/80+Ebi3+P35+ cells in the colon tissues of mice subjected to the indicated treatments. (B) Flow cytometry analyses of CD4+IFN-γ+ and CD4+Foxp3+ cells in the colon tissues of mice subjected to the indicated treatments. (C) Concentration of IL-35 in the stool of the indicated groups detected by ELISA. (D) Representative images of CD19+P35+, CD4+P35+ and F4/80+ P35+ cells in the colon tissues from indicated groups. Blue, DAPI. Scale bar=45 µm. (E) Concentration of IL-35 in the peripheral blood of the indicated groups. (F) Lactobacillus contents in the stool of the mice subjected to the indicated treatments. (G) Schematic diagram of the experimental design for evaluating the effects of IAA-producing L. reu on DSS-induced colitis. Mice were treated with ABX and then with L. reuteri (L. reu) or L. reuteri ΔiaaM (Δiaam L. reu) gavage 3 days later (once every 3 days) for 7 days. After gavage, the mice were exposed to 2.5% DSS. (H) Survival rates of the indicated groups, n=15 mice (7–8 weeks, male)/group; (I–J) Body weight changes (I) and Disease Activity Index (DAI) (J) in the indicated groups (PBS, n=7; L. reu, n=12; Δiaam L. reu, n=8); (K) Representative colon images and statistical analysis of the colon length in the indicated groups (PBS, n=7; L. reu, n=12; Δiaam L. reu, n=8); (L) Representative H&E staining images and histological analysis of the colon tissues from indicated groups (PBS, n=7; L. reu, n=12; Δiaam L. reu, n=8). Scale bar=45 µm. Error bars indicate mean±SD (A–C, E, F and I–K) or mean±SEM (L). Statistic test: two-way analysis of variance test (I–J); unpaired Student’s t-test (A–C, E, F and K–L); log-rank (Mantel-Cox) test (H). Data were representative of three experiments. ABX, antibiotics; DAPI, 4', 6-diamidino-2-phenylindole; DSS, dextran sulfate sodium; IAA, indole-3-acidic acid; IFN, interferon; IL, interleukin; L. reu, Lactobacillus reuteri; PBS, phosphate-buffered saline; Δiaam L. reu, iaaM deleted Lactobacillus reuteri.
Figure 4
Figure 4. IL-35 inhibits colitis-associated tumorigenesis. (A) Schematic diagram of the experimental design for detecting the effects of IL-35 on DSS-induced colitis. Mice were treated with rmIL-35/IL-35Ab and then exposed to 2.5% DSS. (B) Survival rates of mice treated with rmIL-35 or Ctr (control, PBS), n=15 mice (7–8 weeks, male)/group. (C) Body weight changes were measured and recorded in mice treated with rmIL-35 (n=10) or Ctr (control, PBS, n=7) after DSS. (D) Survival rates of the mice treated with IL-35Ab or Iso.Ab (isotypic control), n=15 mice (7–8 weeks, male)/group. (E) Body weight changes of the mice treated with IL-35Ab (n=5) or Iso. Ab (isotypic control, n=11). (F) Representative colon images and statistical analysis of colon length in mice treated with or without rmIL-35/IL35Ab (Ctr (control, PBS), n=7; rmIL-35, n=10; Iso.Ab (isotypic control), n=11; IL-35Ab, n=5). (G) Schematic diagram of the experimental design for detecting the effects of IL-35 on DSS-induced colitis carcinoma. Mice were treated with rmIL-35/IL-35Ab before being injected with AOM and exposed to DSS. (H and I) Survival rates in the mice treated with or without rmIL-35/IL-35Ab, n=15 mice (7–8 weeks, male)/group. (J) Representative images and statistical analysis of colon tumors in the mice treated with or without rmIL-35/IL-35Ab (Ctr (control, PBS), n=6; rmIL-35, n=11; Iso.Ab (isotypic control), n=8, IL-35Ab, n=5). (K) Tumor size distribution in the mice treated with or without rmIL-35/IL-35Ab (Ctr (control, PBS), n=6; rmIL-35, n=11; Iso.Ab (isotypic control), n=8, IL-35Ab, n=5). Error bars indicate mean±SD (C, E, F and J). Statistic test: two-way analysis of variance test (C and E); unpaired Student’s t-test (F and J); log-rank (Mantel-Cox) test (B, D, H and I); Fisher’s exact test (K). Data were representative of three experiments. ABX, antibiotics; AOM, azoxymethane; DSS, dextran sulfate sodium; IL, interleukin; PBS, phosphate-buffered saline; rmIL, recombinant mouse IL.
Figure 5
Figure 5. IAA induces IL-35 in macrophages through PXR. (A–B) Concentration of IL-35 in the supernatants (A) of isolated monocytes/macrophages and flow cytometry of F4/80+Ebi3+P35+ cells (B) in isolated monocytes/macrophages after exposure to IAA (100 µM), LPS (100 ng/mL) or LPS (100 ng/mL)+IAA (100 µM) for 24 hours; medium, control. (C–D) Concentration of IL-35 in the supernatants (C) of isolated monocytes/macrophages and flow cytometry of F4/80+Ebi3+ cells (D) in isolated monocytes/macrophages from WT, PXR KO and AHR KO mice after exposure to LPS (100 ng/mL)+IAA (100 µM) for 24 hours; control, the supernatant of monocytes/macrophages without LPS+IAA treatment. (E) Flow cytometry analyses of CD45+F4/80+Ebi3+P35+, CD45+CD19+Ebi3+P35+ and CD45+CD4+Ebi3+P35+ cells in the PXR KO or control mice (WT) treated with or without L. reu gavage. (F) Flow cytometry analyses of CD45+CD4+IFN-γ+ and CD45+CD4+Foxp3+ cells in the PXR-KO or control mice (WT) treated with or without L. reu gavage. (G) Schematic diagram of the experimental design to evaluate L. reuteri treatment in a DSS-induced colitis mouse model. PXR-KO and WT mice were treated with ABX and then with L. reuteri (L. reu) or PBS gavage 3 days later (once every 3 days) for 7 days. After L. reu gavage, mice were exposed to 2.5% DSS. (H) Survival rates in the PXR KO or WT mice treated with L. reu or PBS gavage, n=15 mice (7–8 weeks, male)/group. (I–J) Body weight changes (I) and Disease Activity Index (J) were measured and recorded in the indicated groups after DSS (WT+PBS, n=8; WT+L. reu, n=12; PXR KO+PBS, n=10; PXR KO+L. reu, n=10). (K) Representative colon images and statistical analysis of colon length in the indicated groups (WT+PBS, n=8; WT+L. reu, n=12; PXR KO+PBS, n=10; PXR KO+L. reu, n=10). (L) Representative H&E staining images and histological analysis of colon tissues from indicated groups (WT+PBS, n=8; WT+L. reu, n=12; PXR KO+PBS, n=10; PXR KO+L. reu, n=10); scale bar=45 µm. Error bars indicate mean±SD (A–F and I–K) or mean±SEM (L). Statistic test: two-way analysis of variance test (I–J); unpaired Student’s t-test (A–F and K–L), log-rank (Mantel-Cox) test (H); Ns, no significance. Data were representative of three experiments. ABX, antibiotics; DSS, dextran sulfate sodium; AHR, aryl hydrocarbon receptor; IAA, indole-3-acidic acid; IFN, interferon; IL, interleukin; KO, knockout; LPS, lipopolysaccharide; L. reu, Lactobacillus reuteri; PBS, phosphate-buffered saline; PXR, pregnane X receptor; WT, wild-type.
Figure 6
Figure 6. IAA-producing L. reu inhibits tumorigenesis. (A) Schematic diagram of the experimental design for the AOM/DSS-induced model in mice treated with IAA-producing L. reuteri. Mice were treated with ABX and then with L. reuteri (L. reu) or L. reuteri ΔiaaM (Δiaam L. reu) gavage or PBS (once every 3 days) 3 days later for 7 days. After gavage, mice were treated with AOM injection (12.5 mg/kg) and then exposed to three cycles of 1.5% DSS in drinking water. (B) Survival analysis of mice in indicated groups, n=15 mice (7–8 weeks, male)/group. (C) Representative images and statistical analysis of colon tumors from the indicated groups (PBS, n=5; L. reu, n=10; Δiaam L. reu, n=5). (D) Histogram showing size distribution of tumors in the indicated group (PBS, n=5; L. reu, n=10; Δiaam L. reu, n=5). (E) Concentration of IAA in the stool of the mice with indicated treatment; (F) schematic diagram of the experimental design for the AOM-DSS model in chimera mice. Mice received 8 Gy irradiation and then were followed by transplantation of BMCs via tail vein injection. After 4 weeks, mice were treated with ABX, and then with L. reu gavage (once every 3 days). After gavage, the mice were treated with AOM injection (12.5 mg/kg) and then exposed to three cycles of 1.5% DSS in drinking water. (G) Survival curves in the chimera mice treated with L. reu (+L. reu); n=15 mice (7–8 weeks, male)/group. (H) Representative images and statistical analysis of colon tumors in the indicated groups (PXR→PXR, n=6; WT→PXR, n=12; PXR→WT, n=6; WT→WT, n=12). (I) Tumor size distribution in the chimera mice treated with L. reu (PXR→PXR, n=6; WT→PXR, n=12; PXR→WT, n=6; WT→WT, n=12). Error bars indicate mean±SD. Statistic test: unpaired Student’s t-test (C, E and H); log-rank (Mantel-Cox) test (B and G); Fisher’s exact test (D and I). Chimera mice: PXR→PXR, PXR KO BMCs were transplanted into irradiated PXR KO mice; WT→PXR, WT BMCs were transplanted into irradiated PXR KO mice; PXR→WT, PXR KO BMCs were transplanted into irradiated WT mice; WT→WT, WT BMCs were transplanted into irradiated WT mice. AOM, azoxymethane; BMC, bone marrow cell; DSS, dextran sulfate; IAA, indole-3-acidic acid; KO, knockout; L. reu, Lactobacillus reuteri; PBS, phosphate-buffered saline; PXR, pregnane X receptor; WT, wild-type; Δiaam L. reu, iaaM deleted Lactobacillus reuteri.
Figure 7
Figure 7. Patients with colorectal carcinoma have decreased levels of IAA. (A) Volcano plot illustrating the global metabolic alterations in the sera of patients with CRC (male, n=21) and healthy individuals (male, n=21). (B) Box plot comparing the serum levels of L-tryptophan, IAA and ILA between patients with CRC (male, n=21) and healthy individuals (male, n=21). (C) Volcano plot showing differentially abundant metabolites in the serum of patients with CRC LNM (male, n=22) compared with healthy individuals (male, n=21). (D) Box plot showing the concentrations of L-tryptophan, IAA and ILA in the sera of patients with CRC LNM (male, n=22) and healthy individuals (male, n=21). (E) Comparative analysis of differentially abundant metabolites between metastatic (male, n=22) and non-metastatic CRC (male, n=21). (F) Box plot showing the concentrations of L-tryptophan, IAA and ILA in the sera of patients with CRC LNM (male, n=22) and CRC (male, n=21). (G) KEGG analysis identified top pathways enriched with the differential metabolites in the sera of patients with CRC (male, n=21) and healthy individuals (male, n=21); the abscissa represents the number of annotated differentially abundant metabolites in the signaling pathway, and the ordinate represents the enriched KEGG metabolic pathway. (H) Bubble plot showing the differential metabolic pathways with importance in patients with CRC (male, n=21) and healthy individuals (male, n=21). The color and p value represent the enrichment degree, and the bubble size indicates the impact factor size of the pathway in the topological analysis. Error bars indicate mean±SD (B, D and F). Statistic test: unpaired Student’s t-test (B, D and F). CRC, colorectal carcinoma; CRC LNM, colorectal carcinoma with lymph node metastasis; IAA, indole-3-acidic acid; ILA, indolelactic acid; KEGG, Kyoto Encyclopedia of Genes and Genomes.

Similar articles

References

    1. Akimoto N, Ugai T, Zhong R, et al. Rising incidence of early-onset colorectal cancer - a call to action. Nat Rev Clin Oncol. 2021;18:230–43. doi: 10.1038/s41571-020-00445-1. - DOI - PMC - PubMed
    1. Li J, Zhang A-H, Wu F-F, et al. Alterations in the Gut Microbiota and Their Metabolites in Colorectal Cancer: Recent Progress and Future Prospects. Front Oncol. 2022;12:841552. doi: 10.3389/fonc.2022.841552. - DOI - PMC - PubMed
    1. Onfroy-Roy L, Hamel D, Malaquin L, et al. Colon Fibroblasts and Inflammation: Sparring Partners in Colorectal Cancer Initiation? Cancers (Basel) 2021;13:1749. doi: 10.3390/cancers13081749. - DOI - PMC - PubMed
    1. Shah SC, Itzkowitz SH. Colorectal Cancer in Inflammatory Bowel Disease: Mechanisms and Management. Gastroenterology. 2022;162:715–30. doi: 10.1053/j.gastro.2021.10.035. - DOI - PMC - PubMed
    1. Gros B, Kaplan GG. Ulcerative Colitis in Adults: A Review. JAMA. 2023;330:951–65. doi: 10.1001/jama.2023.15389. - DOI - PubMed

LinkOut - more resources