. 2025 Apr 23;13(4):e011379.
doi: 10.1136/jitc-2024-011379.

Serum analytes as predictors of disease recurrence and the duration of invasive disease-free survival in patients with triple negative breast cancer enrolled in the OXEL trial treated with immunotherapy, chemotherapy, or chemoimmunotherapy

Affiliations

Serum analytes as predictors of disease recurrence and the duration of invasive disease-free survival in patients with triple negative breast cancer enrolled in the OXEL trial treated with immunotherapy, chemotherapy, or chemoimmunotherapy

Nicole J Toney et al. J Immunother Cancer. .

Abstract

Background: The OXEL study (NCT03487666) was a phase II trial of patients with triple negative breast cancer (TNBC) with residual disease following neoadjuvant chemotherapy, randomized to receive immunotherapy (anti-programmed cell death protein 1, nivolumab), chemotherapy (capecitabine), or chemoimmunotherapy. We previously reported on the primary endpoint of the OXEL trial, demonstrating that a peripheral immunoscore based on circulating immune cells reflecting immune activation was increased in patients treated with immunotherapy. However, compared with cell-based immune assays, sera assays are more cost-effective, less labor-intensive, and samples easier to obtain. Here, we report on differences in serum analytes between treatment arms and associations with clinical response.

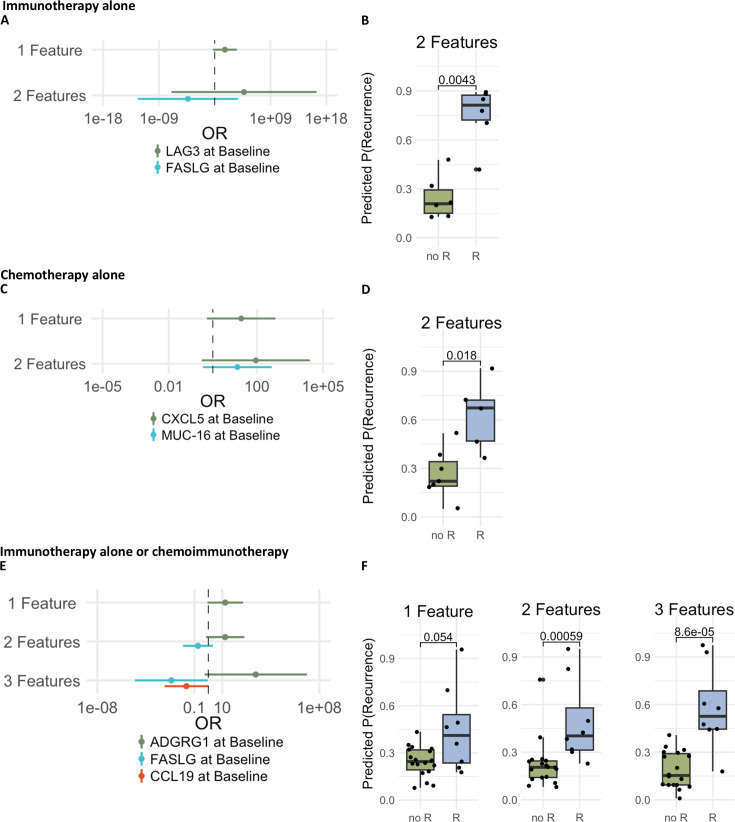
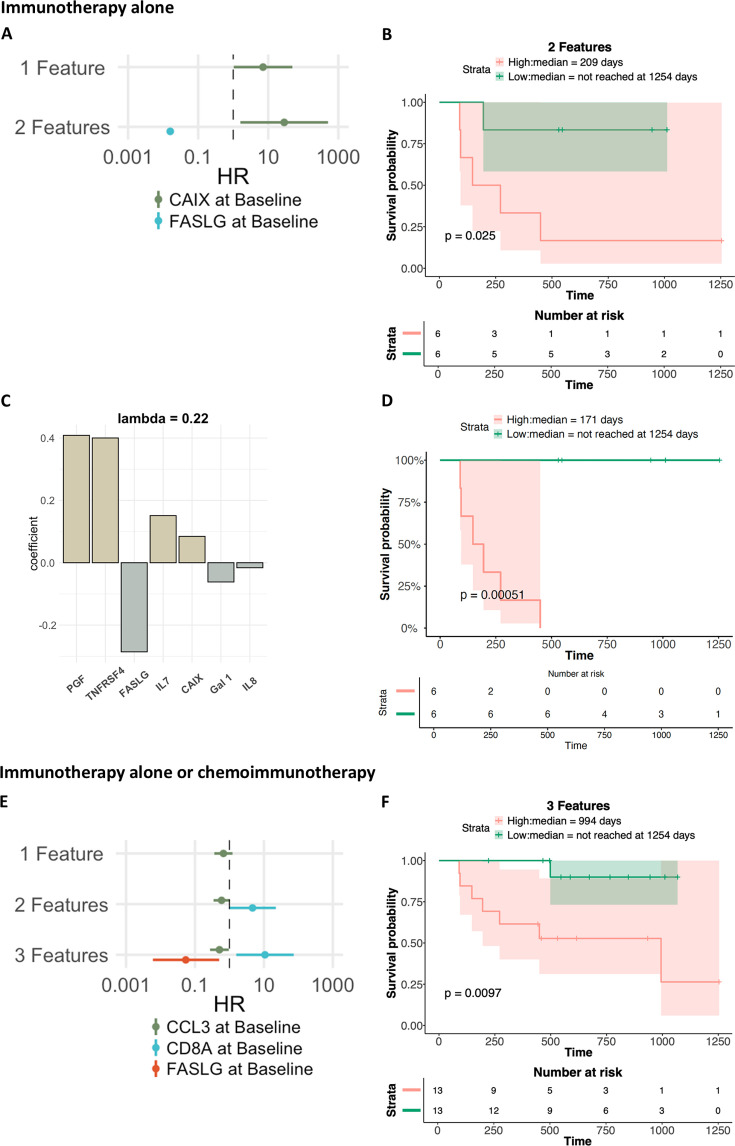
Methods: Patients (n=38) were assayed for 97 serum analytes before and after 6 and 12 weeks of therapy. Serum analytes were assessed for changes with therapy, and as predictors of disease recurrence and the duration of invasive disease-free survival (iDFS) in both single analyte analyses and machine learning models.

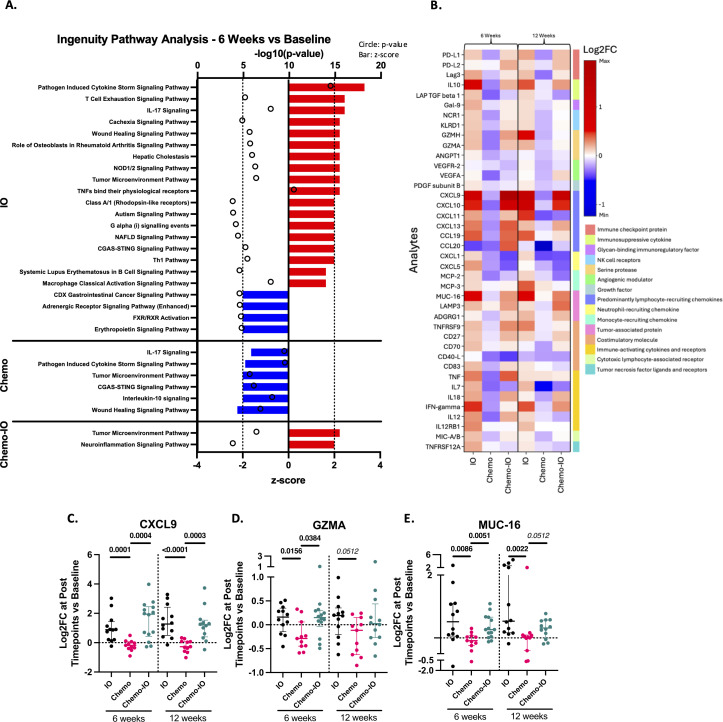
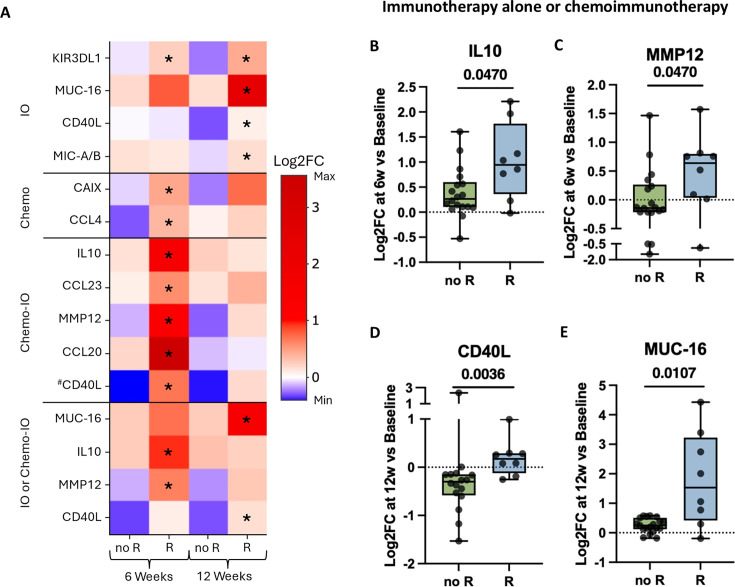
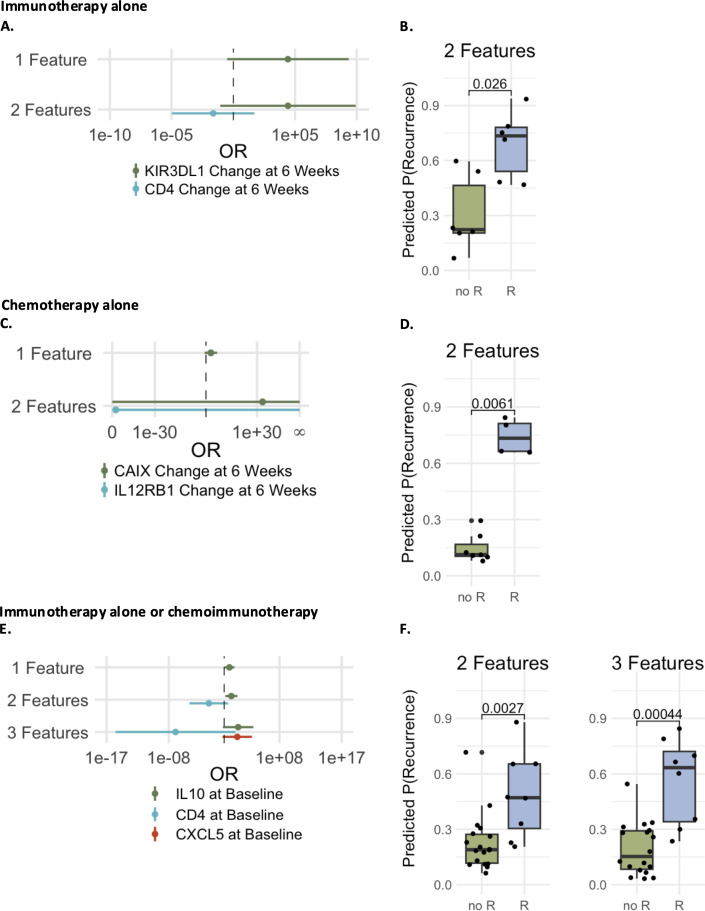
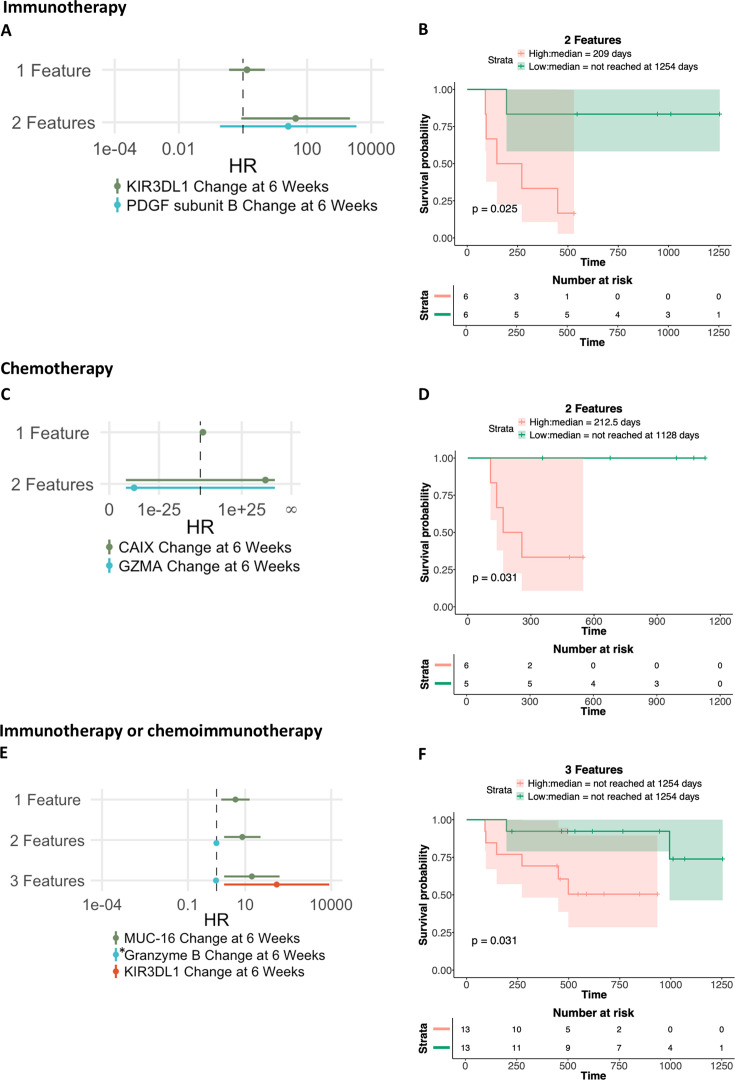
Results: Levels of specific analytes at baseline and changes in levels at early time points on treatment preceding recurrence were associated with eventual development of disease recurrence and/or the duration of iDFS. These associations varied based on the therapy patients received. Immunotherapy led to enrichment in pro-inflammatory analytes following treatment, whereas chemotherapy resulted in overall decreases. Changes seen in patients receiving chemoimmunotherapy more closely resembled those observed in patients receiving immunotherapy alone as opposed to chemotherapy alone. Furthermore, logistic regression and Cox proportional hazard models, developed using machine learning methods, demonstrated that combinations of serum analytes were more predictive of disease recurrence and iDFS duration than analyses of single serum analytes. Notably, the multivariable models that predicted patient outcomes were highly specific to the class of treatment patients received.

Conclusions: In patients with TNBC with residual disease after neoadjuvant chemotherapy, treatment with immunotherapy alone or chemoimmunotherapy resulted in enhanced immune activation compared with chemotherapy alone as measured by changes in serum analyte levels. Distinct serum analytes, both at baseline and as changes after therapy, predicted clinical outcomes for patients receiving immunotherapy alone, chemotherapy alone, or chemoimmunotherapy.

Trial registration number: NCT03487666.

Keywords: Biomarker; Breast Cancer; Chemotherapy; Immunotherapy.


Conflict of interest statement

Competing interests: FL reports consulting for AstraZeneca, Pfizer, Eli-Lilly, Daiichi Sankyo; and institutional research funding from Merck, AstraZeneca, Zentalis, Ideaya, and Gilead. CI reports consultancies for AstraZeneca, Genentech, Gilead, ION, Merck, Medscape, MJH Holdings, Novartis, Pfizer, PUMA, and Seagen; Royalties from Wolters Kluwer (up-to-date) and McGraw Hill (Goodman and Gillman); and institutional research support from Tesaro/GSK, Seattle Genetics, Pfizer, AstraZeneca, BMS, Genentech, Novartis, and Regeneron. All other authors declare no competing interests.

Figures

Figure 1
Figure 1. Association between baseline levels of individual serum analytes and disease recurrence. Baseline levels of serum analytes were compared in patients who developed recurrence (R) versus those not developing recurrence (no R) for patients treated with immunotherapy alone (A), chemotherapy alone (B), chemoimmunotherapy (C), and immunotherapy alone or chemoimmunotherapy in a combined analysis (D). P values were calculated using the Mann-Whitney U test. Graphs display the median and IQR. *Indicates serum analyte measured by ELISA. ADA, adenosine deaminase; CXCL5, C-X-C motif chemokine ligand 5; LAG3, lymphocyte activation gene 3; LAMP3, lysosomal-associated membrane protein 3; NPX, Normalized Protein eXpression; PD-L1, programmed death-ligand 1; PGF, placental growth factor; TNF, tumor necrosis factor.
Figure 2
Figure 2. Predicting disease recurrence using recursive feature elimination in logistic regression models with baseline serum analyte levels. Logistic regression models were generated with levels of serum analytes at baseline by recursive feature elimination for patients treated with immunotherapy alone (A–B), patients treated with chemotherapy alone (C–D), and patients treated with immunotherapy alone or chemoimmunotherapy in a combined analysis (E–F). Forest plots show effect size, confidence intervals, and OR of each analyte included in the models (A, C, E). The predicted probabilities of disease recurrence generated from the models were compared in patients who had an actual recurrence (R) or no recurrence (no R) by Mann-Whitney U test and are displayed for the 1-feature, 2-feature and 3-feature models where applicable (B, D, F). ADGRG1, adhesion G-protein coupled receptor G1; CCL19, chemokine ligand 19; CXCL5, C-X-C motif chemokine ligand 5; FASLG, FAS ligand; LAG3, lymphocyte activation gene 3; MUC-16, mucin-16; OR, odds ratio.
Figure 3
Figure 3. Predicting iDFS by recursive feature elimination with Cox models and LASSO-based Cox regression using baseline serum analyte levels. Cox proportional hazard models were generated with levels of serum analytes at baseline by recursive feature elimination for patients treated with immunotherapy alone (A–B) and for patients treated with immunotherapy alone or chemoimmunotherapy in a combined analysis (E–F). Forrest plots show effect size, CIs, and HRs of each analyte included as a predictor in 1-feature, 2-feature, and 3-feature models where applicable (A, E). LASSO-based CPH models were generated with levels of serum analytes at baseline for patients treated with immunotherapy alone (C–D). The bar plot shows coefficient values of the remaining features at the specified lambda cut-off (C). The predicted survival probabilities were calculated from these models and patients were stratified by ≥ (high) or < (low) median value to plot Kaplan-Meier curves with the duration of iDFS (B, D, F). For iDFS analyses, a log-rank (Mantel-Cox) test was used, and 95% CIs were determined by the Mantel-Haenszel method and shaded on Kaplan-Meier curves. P values and median time of iDFS for patients in the high and low groups are indicated. CAIX, carbonic anhydrase IX; CCL3, chemokine ligand 3; CD8A, cluster of differentiation 8A; CI, confidence interval; CPH, Cox proportional hazard; FASLG, FAS ligand; HR, hazard ratio; iDFS, invasive disease-free survival; LASSO, Least Absolute Shrinkage and Selection Operator.
Figure 4
Figure 4. Serum analytes differentially changing with therapy between treatment arms. Ingenuity Pathway Analysis of analytes measured by the Olink assay that were changed after 6 weeks of therapy compared with baseline (p<0.05 by Wilcoxon signed-rank test) for patients treated with immunotherapy alone (IO), chemotherapy alone (Chemo), or chemoimmunotherapy (Chemo-IO) (A). Pathways with an absolute z-score >1.5 are displayed. Circles indicate the −log10 (p value) and bars indicate z-score (red: upregulated pathway; blue: downregulated pathway). Vertical dashed lines at an absolute z-score >2 highlight pathways with a greater potential for biological relevance. Heatmap displaying the median log2 fold change (Log2FC) at 6 and 12 weeks on treatment compared with baseline of serum analytes that were significantly changed differently between treatment arms, with functional groups indicated (B). Select graphs displaying differences in change of circulating analytes including CXCL9 (C), GZMA (D), and MUC-16 (E) after 6 and 12 weeks of therapy compared with baseline. Differences were calculated between treatment arms as Log2FC. P values were calculated using the Mann-Whitney U test. CXCL9, C-X-C motif chemokine ligand 9; GZMA, granzyme A; MUC-16, mucin-16.
Figure 5
Figure 5. Changes in individual serum analytes after therapy associate with disease recurrence. Heatmap displaying the magnitude of change in levels of serum analytes (Log2FC) after 6 and 12 weeks of therapy versus baseline in patients who developed disease recurrence (R) versus those not developing recurrence (no R), for patients treated with immunotherapy alone (IO), chemotherapy alone (Chemo), chemoimmunotherapy (Chemo-IO), and immunotherapy alone or chemoimmunotherapy in a combined analysis. In the heatmap, *indicates a significantly greater increase in the change from baseline to post-time points for patients with R compared with no R. The difference in the change in select serum analytes for individual patients treated with immunotherapy alone or chemoimmunotherapy in a combined analysis with R versus no R after 6 weeks of therapy is displayed for IL-10 (B) and MMP12 (C), and after 12 weeks of therapy for CD40L (D) and MUC-16 (E). P value was calculated using the Mann-Whitney U test. Graphs display the median and IQR. #Indicates serum analyte measured by ELISA. CD40L, cluster of differentiation 40 ligand; IL10, interleukin 10; Log2FC, log2 fold change; MMP12, matrix metalloproteinase 12; MUC-16, mucin-16.
Figure 6
Figure 6. Predicting disease recurrence using recursive feature elimination in logistic regression models of early changes in serum analytes after therapy. Logistic regression models were generated with changes in serum analytes at 6 weeks versus baseline by recursive feature elimination for patients treated with immunotherapy alone (A–B), patients treated with chemotherapy alone (C–D), and patients treated with immunotherapy alone or chemoimmunotherapy in a combined analysis (E–F). Forest plots show effect size, confidence intervals, and ORs of each analyte included in the models (A, C, E). The predicted probabilities of recurrence generated from the models were compared in patients who had actual disease recurrence (R) or no recurrence (no R) by Mann-Whitney U test and are displayed for the 2-feature and 3-feature models (B, D, F). CAIX, carbonic anhydrase IX; CD4, cluster of differentiation 4; CXCL5, C-X-C motif chemokine ligand 5; IL10, interleukin 10; IL12RB1, interleukin 12 receptor, beta subunit 1; KIR3DL1, killer cell immunoglobulin-like reception 3DL1; OR, odds ratio.
Figure 7
Figure 7. Predicting iDFS using recursive feature elimination with Cox models using early changes in serum analytes. Cox proportional hazard models were generated from changes in serum analytes at 6 weeks versus baseline by recursive feature elimination for patients treated with immunotherapy alone (A–B), patients treated with chemotherapy alone (C–D), and patients treated with immunotherapy alone or chemoimmunotherapy in a combined analysis (E–F). Forest plots show effect size, CIs, and HRs of each analyte included as a predictor in 1-feature, 2-feature, and 3-feature models, where applicable (A, C, E). The predicted survival probabilities were calculated from these models and patients were stratified by ≥ (high) or < (low) median change values to plot Kaplan-Meier curves with the duration of invasive disease-free survival (iDFS) (B, D, F). For iDFS analyses, a log-rank (Mantel-Cox) test was used, and 95% CIs were determined by the Mantel-Haenszel method and shaded on Kaplan-Meier curves. P values and median time of iDFS for patients in the high and low groups are indicated. *Indicates serum analyte measured by ELISA. CAIX, carbonic anhydrase IX; CI, confidence interval; GZMA, granzyme A; HR, hazard ratio; KIR3DL1, killer cell immunoglobulin-like receptor 3DL1; MUC-16, mucin-16; PDGF, platelet-derived growth factor.

References

    1. Dent R, Trudeau M, Pritchard KI, et al. Triple-negative breast cancer: clinical features and patterns of recurrence. Clin Cancer Res. 2007;13:4429–34. doi: 10.1158/1078-0432.CCR-06-3045. - DOI - PubMed
    1. Cortazar P, Zhang L, Untch M, et al. Pathological complete response and long-term clinical benefit in breast cancer: the CTNeoBC pooled analysis. Lancet. 2014;384:164–72. doi: 10.1016/S0140-6736(13)62422-8. - DOI - PubMed
    1. Xia L-Y, Hu Q-L, Zhang J, et al. Survival outcomes of neoadjuvant versus adjuvant chemotherapy in triple-negative breast cancer: a meta-analysis of 36,480 cases. World J Surg Oncol. 2020;18:129. doi: 10.1186/s12957-020-01907-7. - DOI - PMC - PubMed
    1. Bellon JR, Burstein HJ, Frank ES, et al. Multidisciplinary considerations in the treatment of triple‐negative breast cancer. CA A Cancer J Clinicians. 2020;70:432–42. doi: 10.3322/caac.21643. - DOI - PubMed
    1. von Minckwitz G, Untch M, Blohmer J-U, et al. Definition and Impact of Pathologic Complete Response on Prognosis After Neoadjuvant Chemotherapy in Various Intrinsic Breast Cancer Subtypes. JCO. 2012;30:1796–804. doi: 10.1200/JCO.2011.38.8595. - DOI - PubMed

Publication types

MeSH terms

Substances

Associated data

LinkOut - more resources