

Tau profiling across Alzheimer's disease staging reveals vulnerability to disease pathophysiology
- PMID: 40274672
- PMCID: PMC12397142
- DOI: 10.1007/s00259-025-07257-4
Tau profiling across Alzheimer's disease staging reveals vulnerability to disease pathophysiology
Abstract
Background: Inter-individual variability in tau topography challenges the propagation hypothesis of tau aggregates.
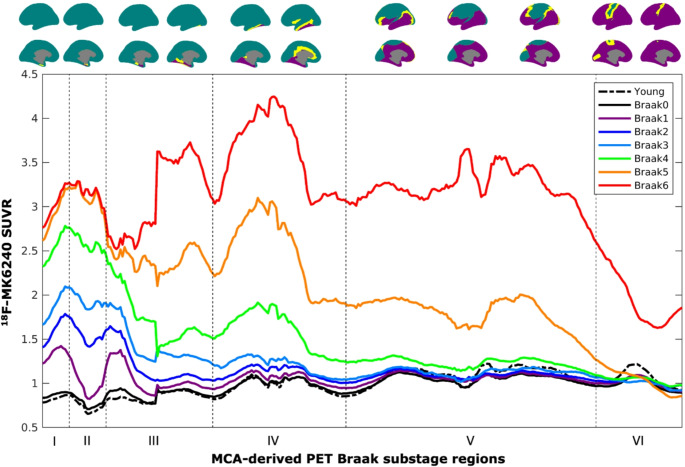
Methods: To address this gap, we propose the Manifold Component Analysis (MCA), for identifying pseudo-continuous profiles informed by the spatial continuity of stage regions.
Results: Longitudinal and cross-sectional MCA in large aging cohort identified individual profiles (N = 753) expressing tau load in the entorhinal, limbic and neocortical regions. Using these profiles, we found neuropsychological and blood-based milestones of early and late disease stages. Finally, we also found evidence of rapid tau load increases and cognitive decline centered at the early-to-mid neocortical stages of Alzheimer's disease.
Conclusions: Stage system based on tau load and spreading profiles across cortical areas provide a compelling framework for inferring pathophysiological prognosis in Alzheimer's disease.
Keywords: 18F-MK6240 PET; Alzheimer’s disease; Component analysis; Dimensionality reduction; Neurofibrillary tangles; PET braak staging; Propagation; Tau.
© 2025. The Author(s).
Conflict of interest statement
Declarations. Ethics approval and consent to participate: The TRIAD cohort study was conducted in line with the principles of the Declaration of Helsinki. The study was approved by the Douglas Mental Health University Institute Research Ethics Board, and written informed consent was obtained from all participants. Consent for publication: Not applicable. Competing interests: HZ has served at scientific advisory boards and/or as a consultant for Abbvie, Alector, Annexon, Artery Therapeutics, AZTherapies, CogRx, Denali, Eisai, Nervgen, Novo Nordisk, Pinteon Therapeutics, Red Abbey Labs, Passage Bio, Roche, Samumed, Siemens Healthineers, Triplet Therapeutics, and Wave, has given lectures in symposia sponsored by Cellectricon, Fujirebio, Alzecure, Biogen, and Roche, and is a co-founder of Brain Biomarker Solutions in Gothenburg AB (BBS), which is a part of the GU Ventures Incubator Program (outside submitted work). KB has served as a consultant, at advisory boards, or at data monitoring committees for Abcam, Axon, BioArctic, Biogen, JOMDD/Shimadzu. Julius Clinical, Lilly, MagQu, Novartis, Ono Pharma, Pharmatrophix, Prothena, Roche Diagnostics, and Siemens Healthineers, and is a co-founder of Brain Biomarker Solutions in Gothenburg AB (BBS), which is a part of the GU Ventures Incubator Program, outside the work presented in this paper.
Figures


References
-
- Markson LE, Nash DB, Louis DZ, Gonnella JS. Clinical outcomes management and disease staging. Eval Health Prof. 1991;14(2):201–27. - PubMed
-
- Therriault J, Zimmer ER, Benedet AL, Pascoal TA, Gauthier S, Rosa-Neto P. Staging of Alzheimer’s disease: past, present, and future perspectives. Trends Mol Med. 2022;28(9):726–41. - PubMed
-
- Braak H, Braak E. Neuropathological stageing of Alzheimer-related changes. Acta Neuropathol. 1991;82(4):239–59. - PubMed
MeSH terms
Substances
Grants and funding
LinkOut - more resources
Full Text Sources
Medical
Miscellaneous
