

Exploring predictive biomarkers of efficacy and survival with nivolumab treatment for unresectable/recurrent esophageal squamous cell carcinoma
- PMID: 40274705
- PMCID: PMC12167336
- DOI: 10.1007/s10388-025-01120-z
Exploring predictive biomarkers of efficacy and survival with nivolumab treatment for unresectable/recurrent esophageal squamous cell carcinoma
Abstract
Background: Programmed cell death protein-1 (PD-1) blockade has improved survival for patients with esophageal squamous cell carcinoma (ESCC), but response rates are low. Biomarkers to predict who will benefit from PD-1 blockade are urgently needed.
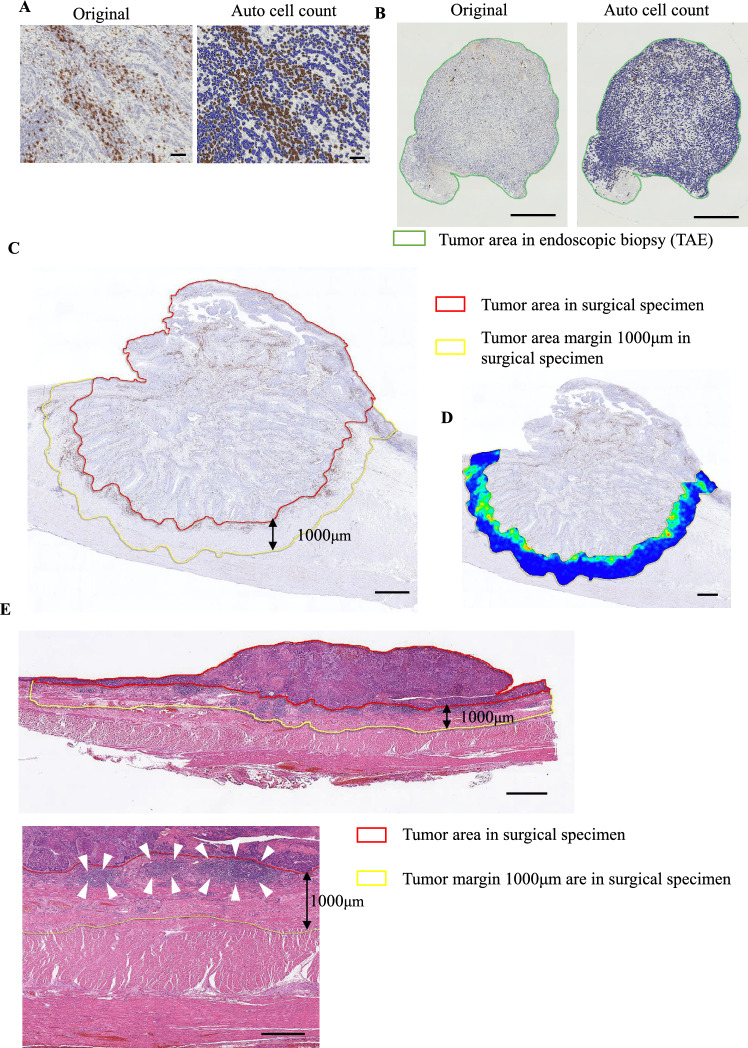
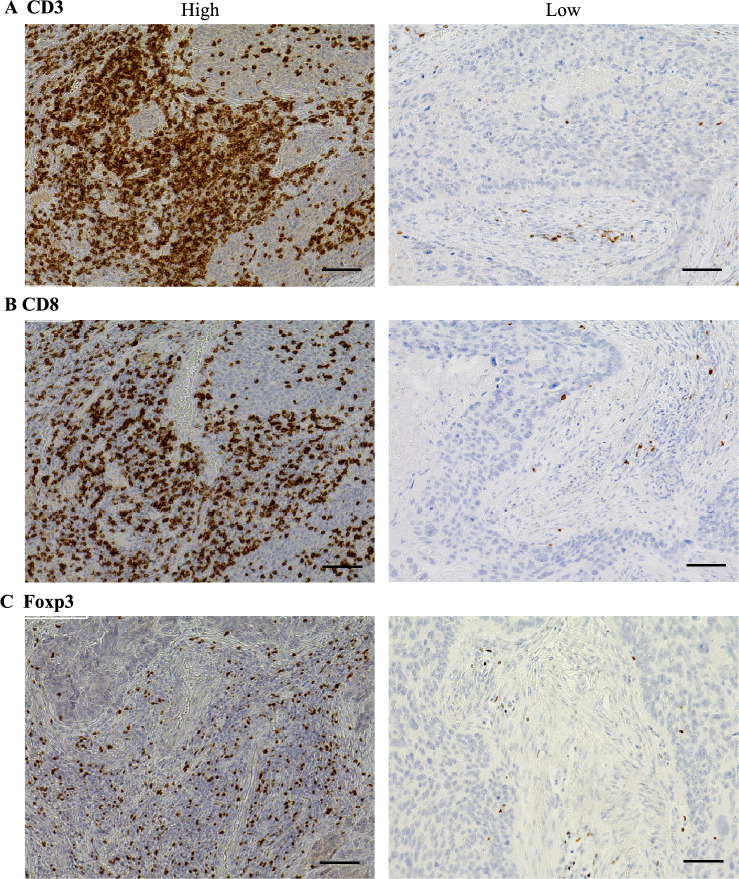
Methods: This multicenter study involved 250 patients with recurrent/unresectable advanced ESCC receiving nivolumab as second- or later-line therapy. We assessed tumor-infiltrating T lymphocytes (TILs) and tertiary lymphoid structure (TLS) density using immunohistochemistry and hematoxylin/eosin staining in surgical specimens and pre-nivolumab endoscopic biopsies.
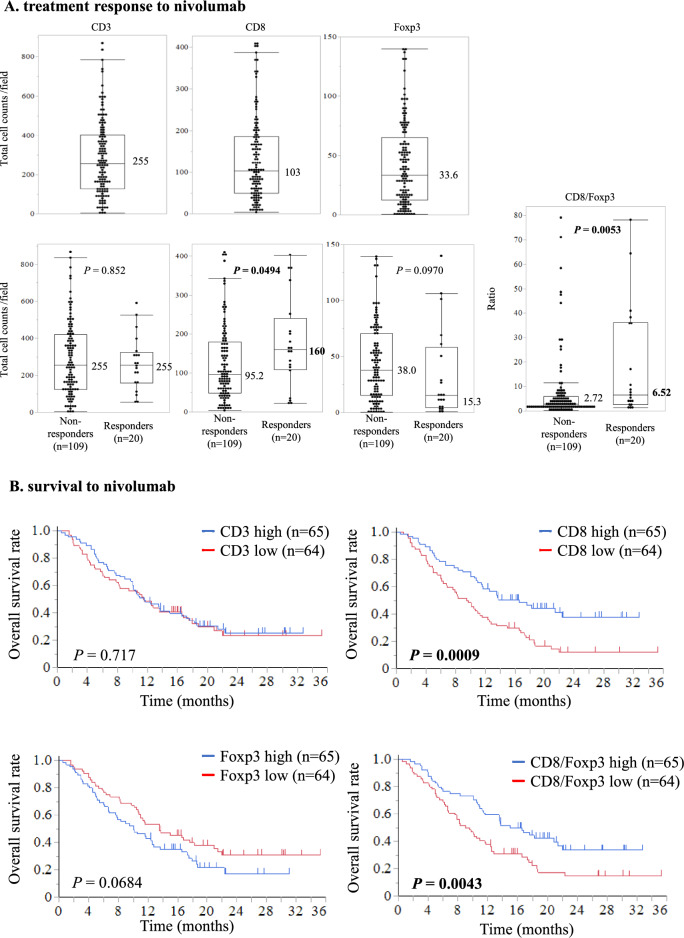
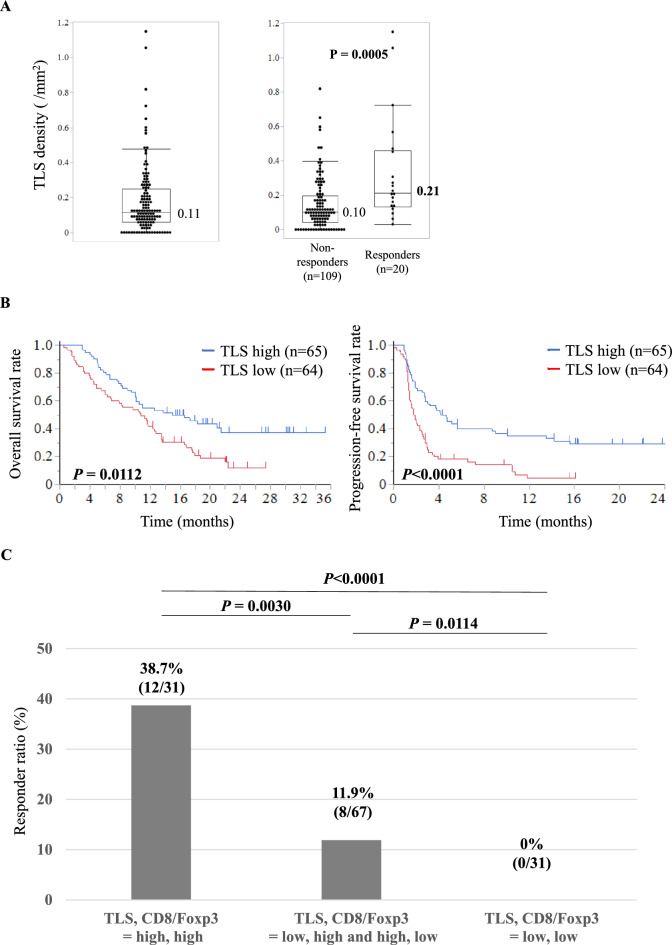
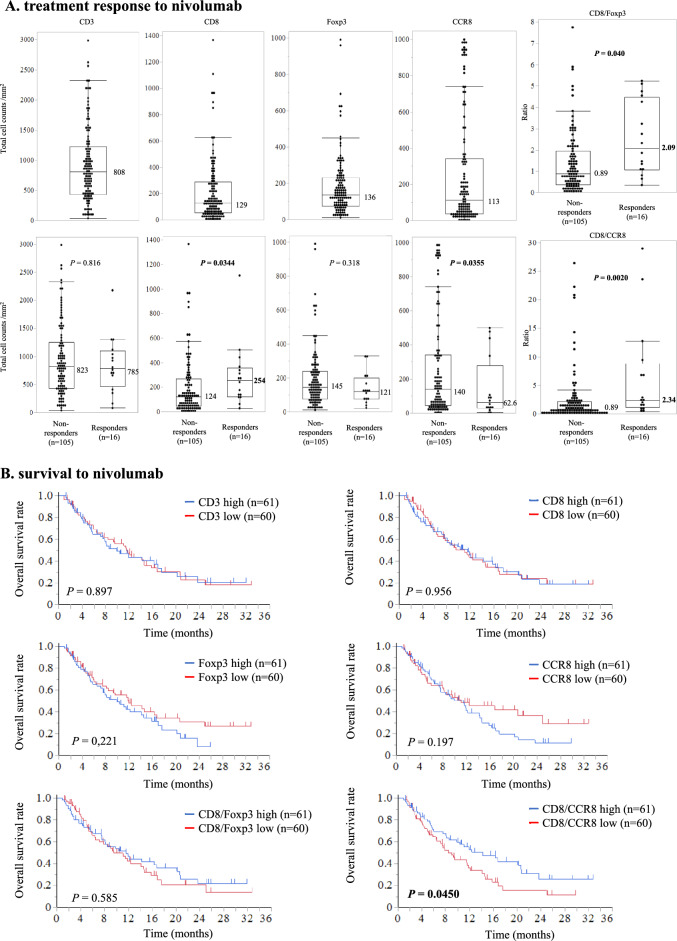
Results: In surgical specimens, clinical response (vs. non-response) to nivolumab correlated significantly with CD8+ lymphocyte count (160 vs. 95.2 cells/field, P = 0.0494), CD8/Foxp3 ratio (6.52 vs. 2.72, P = 0.0053), and TLS density (0.21/mm2 vs. 0.10/mm2, P = 0.0005). In terms of overall survival, multivariate analysis identified CD8/Foxp3 ratio (hazard ratio [HR] = 1.83, P = 0.0050) and TLS density (HR = 1.67, P = 0.0171 as independent prognostic parameters in surgical specimens. Similarly, in endoscopic biopsies, clinical response (vs. non-response) to nivolumab correlated significantly with CD8+ counts (254 cells/mm2 vs. 124 cells/mm2, P = 0.0344), CCR8+ lymphocyte count (62.6 cells/mm2 vs. 140 cells/mm2, P = 0.0355), CD8/Foxp3 ratio (2.09 vs. 0.89, P = 0.040), and CD8/CCR8 ratio (2.34 vs. 0.89, P = 0.0020). Multivariate analysis also identified CD8/CCR8 ratio in endoscopic biopsies (HR = 1.66, P = 0.0313) as an independent prognostic parameter.
Conclusions: CD8+ and CCR8+ cell counts, CD8/Foxp3 and CD8/CCR8 ratios, and TLS density may be predictive biomarkers of therapeutic efficacy and survival with PD-1 blockade for ESCC.
Keywords: Anti-PD-1 antibody; Biomarker; Esophageal squamous cell carcinoma; Tertiary lymphoid structure; Tumor-infiltrating T lymphocytes.
© 2025. The Author(s).
Conflict of interest statement
Declarations. Ethical Statement: All studies were performed in accordance with the ethical guidelines of the Declaration of Helsinki and Japanese Ethical Guidelines for Human Genome/Gene Analysis Research. The use of resected samples and clinicopathological data was approved by the Human Ethics Review Committee of the Graduate School of Medicine, Osaka University (no. 19146-5). This study is registered with UMIN Clinical Trials Registry, number UMIN000040462. Included patients gave written informed consent before enrollment, which was not required for patients who had died or been lost to follow-up.
Figures
Similar articles
-
Efficacy and safety of camrelizumab combined with chemotherapy as second-line treatment for locally advanced, recurrent, or metastatic esophageal squamous cell carcinoma.World J Surg Oncol. 2025 Feb 4;23(1):38. doi: 10.1186/s12957-025-03690-9. World J Surg Oncol. 2025. PMID: 39905538 Free PMC article.
-
Inflammatory markers correlate with lymphocytes infiltrating and predict immunotherapy prognosis for esophageal cancer.Future Oncol. 2024 Dec;20(39):3267-3278. doi: 10.1080/14796694.2024.2421151. Epub 2024 Nov 12. Future Oncol. 2024. PMID: 39530611
-
Prognostic Value of Deep Learning-Extracted Tumor-Infiltrating Lymphocytes in Esophageal Cancer: A Multicenter Retrospective Cohort Study.Cancer Med. 2025 Jul;14(14):e71054. doi: 10.1002/cam4.71054. Cancer Med. 2025. PMID: 40673386 Free PMC article.
-
Efficacy and safety of cisplatin-based versus nedaplatin-based regimens for the treatment of metastatic/recurrent and advanced esophageal squamous cell carcinoma: a systematic review and meta-analysis.Dis Esophagus. 2017 Feb 1;30(2):1-8. doi: 10.1111/dote.12490. Dis Esophagus. 2017. PMID: 27868295
-
Comparison of efficacy and safety of PD-1/PD-L1 combination therapy in first-line treatment of advanced NSCLC: an updated systematic review and network meta-analysis.Clin Transl Oncol. 2024 Oct;26(10):2488-2502. doi: 10.1007/s12094-024-03442-3. Epub 2024 Apr 16. Clin Transl Oncol. 2024. PMID: 38625495
References
-
- Bray F, Ferlay J, Soerjomataram I, et al. Global cancer statistics 2018: GLOBOCAN estimates of incidence and mortality worldwide for 36 cancers in 185 countries. CA Cancer J Clin. 2018;68:394–424. - PubMed
Publication types
MeSH terms
Substances
Grants and funding
LinkOut - more resources
Full Text Sources
Medical
Research Materials